Article
J. Braz. Chem. Soc., Vol. 26, No. 10, 2137-2143, 2015. Printed in Brazil - ©2015 Sociedade Brasileira de Química 0103 - 5053 $6.00+0.00
A
*e-mail: [email protected]
Rapid Determination of Lead in Progressive Hair Dye Lotion by Spot Test/Diffuse
Reflectance Spectroscopy with a Paper Platform
Vitor H. M. Luiz, Lívia M. Saraiva, Ângela P. Martins, Leonardo Pezza and Helena R. Pezza*
Instituto de Química, Universidade Estadual Paulista - UNESP, Rua Prof. Francisco Degni 55, CP 355, 14800-900 Araraquara-SP, Brazil
A simple, inexpensive, and clean methodology employing a combined spot test/diffuse reflectance spectroscopy procedure was developed and applied for the quality control analysis of lead in hair dyes, using a filter paper platform. The method is based on the complexation reaction of lead, present in a pH 2.8 buffer medium containing tartaric acid and sodium and potassium tartrate, with sodium rhodizonate (ROD) in an aqueous medium containing sodium dodecyl sulfate (SDS) surfactant, yielding a colored compound on the surface of a filter paper. The concentrations of ROD and SDS were optimized using experimental design. The linear range obtained for reflectometric measurements carried out at 545 nm was 4.70-140 mg L-1 of lead (R = 0.998), and the limits of
detection and quantification were 1.12 and 3.75 mg L-1, respectively. The proposed method was
successfully applied to the analysis of lead in progressive hair dyes.
Keywords: lead, progressive hair dye, spot test, diffuse reflectance spectroscopy
Introduction
Lead is neither essential nor beneficial to plants and animals. It is one of the most common elements toxic to mammals and can cause mental retardation in young children. Tests with rats and mice have shown that the chemical and toxicological properties of inorganic lead salts, where the bond between the metal and the ligand is ionic, are different to those of covalently bonded organolead compounds. The kidney is the principal organ affected by
lead salts, regardless of the route of exposure.1-3
Most methods for the determination of lead employ
atomic absorption spectrometry4-7 or voltammetry,8-11
although fluorescence spectroscopy12 and potentiometry
have also been used.13 These techniques have been applied
to matrices including water,6,7 urine,4 gunshot residues,9
food,12 blood,13 and cosmetics.14
The use of cosmetics is not a recent practice. Hair dyes and other kinds of cosmetics have been used since the times
of the ancient Egyptians and the Roman Empire.14 However,
with the development of new products that are accessible and easy to use, there is increasing use of cosmetics. These products enter into direct contact with the hair, skin, mouth, or other parts of the human body. Since the skin does not
provide an impermeable barrier to many topically applied
substances,15 it is important to determine the maximum
permissible concentrations of potentially toxic substances, in order to avoid any harm to the users.
Given the chemical nature of hair dye ingredients and the size of the exposed population, hair dyes are among the most extensively studied and regulated cosmetic products, and their use has been included in the investigation of
endpoints in numerous epidemiological studies.15
One of the elements of interest present in progressive hair dyes is lead, found as lead acetate and used as a color additive. Lead acetate is approved by the United States
Food and Drug Administration (FDA)16 and the Brazilian
National Health Surveillance Agency (ANVISA)17 as an
additive for coloring hair on the scalp, at concentrations not exceeding 0.6% (m/v) of metallic lead.
food, and water analyses.18,19 Spot tests are performed by
mixing a drop of the sample and a drop of a specific reagent on a porous support. A filter paper impregnated with a stable reagent is the most common configuration for spot tests
used in clinical and water quality analyses.19
Filter papers are used as platforms in analytical and
clinical applications20-22 because they can be readily
disposed of safely by incineration.23 Whitesides and
co-workers24 developed patterned paper-based microfluidic
systems for biodetection. Colorimetric paper platforms can be used without any instrumentation or trained personal, with samples delivered by spotting. A white filter paper provides a good surface for spot tests, ensuring a high contrast background for colorimetric reactions that are
measured by reflectance.23,25-27
Reflectance takes place when light strikes a surface. Two distinct processes are responsible for this, namely specular reflectance and diffuse reflectance. Specular reflectance occurs at the interface of a medium with no transmission through it, while diffuse reflectance occurs when the radiation penetrates the material surface and subsequently reappears on the surface after undergoing partial absorption and multiple scattering within the internal layer. Specular reflection can be eliminated or minimized by means of optical engineering, with use of spherical
or 45o illumination systems. Specular reflectance is not
of importance in the field of colorimetry.28 In contrast,
diffuse reflectance has a broad range of applications, using materials with irregular surfaces, such as paper, as solid supports. Scheme 1 shows these two kinds of reflectance and the process that occurs when the incident radiation strikes the spot test.
Diffuse reflectance measurements can be performed
in situ using a very simple homemade reflectometer29
or a portable diffuse reflectance spectrophotometer.23,26
Alternatively the analyte of interest can be collected on the filter paper and retrieved to the laboratory, under appropriate storage conditions, for subsequent analysis.
It is also possible to photograph the result of the in situ
reaction and send the image to an analyst by e-mail or
cell phone.30
The required instrumentation is small, lightweight, inexpensive, and can be battery operated. These characteristics make the method highly attractive for use in many applications, in almost any location, by nearly
everyone.25 Previous studies have demonstrated that diffuse
reflectance spectroscopy can yield reliable results and that the technique is suitable for quantitative analysis. Several analytical applications have been reported for different
kinds of matrices and analytes.23,25-27,29-34
Diffuse reflectance is known to be dependent on the composition of the system, analogous to light absorption. Therefore, reflectance studies can be used for quantitative chemical analysis in much the same way that transmission spectrometry is used. In reflectance analysis, the optical
density for reflectance measurements is AR = −log TR,
analogous to absorbance, where TR = I/I0 is the reflecting
power, I0 being the intensity of the incident radiant energy
and I the intensity of the radiant energy reflected by the
medium.33,34
This paper describes the development and application of a simple, portable, and environmentally friendly method for the rapid determination of lead in progressive hair dye products. The proposed method is based on diffuse reflectance measurements of the colored product
(λmax = 545 nm) produced from the spot test reaction
between lead and sodium rhodizonate in a buffer medium of tartaric acid and sodium and potassium tartrate at pH 2.8, using a filter paper as the platform.
Experimental
Apparatus
Reflectance measurements were made using a handheld integrating sphere (ISP-REF, Ocean Optics) connected to a fiber optic mini-spectrometer (USB2000, Ocean Optics). The USB2000 mini-spectrometer was fitted with a 2048 pixels Sony ILX511 CCD array detector. The SpectraSuite and OOIBase 32 software packages (Ocean Optics) were used for acquisition and processing of the spectra. Measurements of pH were made with a Tec-2 pH meter (Tecnal) equipped with a glass electrode. Eppendorf (10-100 µL) and Brand (100-1000 µL) micropipettes were used to deliver measured volumes in the experiments. Grade “A” glassware was employed in all the procedures. Weighing was performed with a Mettler Toledo model AG204 analytical balance. The analyte was separated from the samples using an Eppendorf 5702R centrifuge. Samples were evaporated using a Marconi MA 126 water bath, and a Corning magnetic stirrer was used for agitation. In the comparative method, samples were calcined in a Marconi MA 385 muffle furnace.
Reagents and solutions
Whatman No. 1 qualitative filter paper was used as the solid support. All the reagents employed were analytical grade and were used without any prior purification.
Ultrapure water (18 MΩ cm, Milli-Q system, Millipore)
was used to prepare the solutions.
The chromogenic reagent solution consisted of a mixture of sodium rhodizonate (ROD, Sigma-Aldrich, 97%) and sodium dodecyl sulfate (SDS, Sigma, 99%)
at concentrations of 13 mmol L-1 and 9.0 mmol L-1,
respectively, in pH 2.8 buffer medium containing sodium and potassium tartrate (Synth, 99%) and tartaric acid
(Synth, 99%), both at 0.2 mol L-1.
A stock standard solution of 2000 mg L-1 of lead(II)
((Pb(NO3)2, Sigma-Aldrich, purity > 99.0%) was prepared
once. Working solutions of lead (4.70, 9.40, 18.75, 37.50,
65.60, 93.70, and 140 mg L-1) were prepared by appropriate
dilution of the stock solution with deionized water. Nitric
acid (HNO3, Quimex, 65% m/m) and sulfuric acid (H2SO4,
Sigma-Aldrich, 98% m/m) were used for sample digestion.
Samples and preparation
Four progressive hair dye lotions were obtained from supermarkets in Brazil. The samples solutions were prepared by dilution of 1.0 mL of each lotion up to 25 mL with deionized water in volumetric flask. This dilution was stipulated after preliminary tests. Samples with higher lead content require appropriate dilution. In the case of the reference method, sample preparation was performed
according to the procedure established by ANVISA.35
Experimental design
The significant parameters were evaluated by means of experimental design methodology. The selected variables were the concentrations of ROD and SDS. These multivariate analyses were performed with the Minitab 16 and Statistica v. 8.0 software packages.
Spot test - recommended procedure
For the spot test reaction, the solutions were spotted onto 2.25 cm² filter papers (Whatman No. 1). The
chromogenic reagent solution (20 µL) was added first,
immediately followed by 20 µL of the lead solution. The
solutions were spotted onto the center of the filter paper using a micropipette fixed in a holder, according to the
procedure described by Tubino et al.27 The reflectance was
then measured at 545 nm. The blank was prepared using
20 µL of the chromogenic reagent solution and 20 µL of
deionized water.
Stability study
The stability of the colored reaction product in the filter paper was evaluated by kinetic monitoring of the absorbance signal at 545 nm, with measurements every five minutes during one hour.
Evaluation of interferences
This study employed solutions containing 0.6% (m/v) of lead, together with each of the other hair lotion ingredients (propylene glycol, ammonium chloride, panthenol, acetic acid, and benzoate), used separately at concentrations equal to the lead concentration. After mixing, 1 mL of each solution was diluted in a 250 mL volumetric flask with deionized water. The analysis was carried out as described in the recommended procedure.
Analytical curves
Under optimized conditions, lead standard solutions
(from 4.70 to 140.0 mg L-1) were reacted in triplicate
with the reagent, using the filter paper as solid support. Formation of the colored product was monitored at 545 nm.
Proposed method
The determination of lead was performed using four samples of progressive hair dye lotion, considering the
maximum limit allowed by ANVISA17 (0.6% m/v of lead).
The samples were diluted in deionized water as described in the Samples and preparation section, followed by the spot test. The measurements were made at 545 nm by coupling an integrating sphere to a portable spectrophotometer.
Reference method
The gravimetric method was performed as described
by ANVISA,35 with each sample analyzed in triplicate.
Results and Discussion
the formation of a colored reaction product in a spot test conducted on a qualitative filter paper. This chromogenic reagent has been used previously in forensic spot testing
for lead in firearm discharge residues.19
It is known that micellar media are capable of changing the equilibrium, kinetic, and spectral properties of reactions in which they are involved, and this has been used to
improve the characteristics of analytical procedures.36
However, there have been no previous reports concerning the use of micelles in the complexation of lead with rhodizonate.
The experiments showed that there was a significant enhancement of solubility in the presence of SDS, with increased sensitivity of the method and no shift in the
absorbance maximum (λ = 545 nm). No precipitation was
observed when lead was reacted with rhodizonate in the presence of SDS.
The uniformity and intensity achieved using spot tests with reflectance measurements is influenced by various experimental parameters. Here, the order of addition of the reagents was studied, together with tests to determine any need to adjust the pH of the medium. It was found
that when 20 µL of the chromogenic reagent (ROD and
SDS) was added to the filter paper before 20 µL of lead
solution, there was a better signal and greater homogeneity of the spot, with no need to dry the reaction mixture on the filter paper.
No change in the uniformity of the colored spot was observed when different volumes of the solutions were added to the paper. In view of this, it was decided to add
20 µL of the chromogenic reagent solution followed by
20 µL of lead solution, which produced a spot of sufficient
diameter to be measured by the reflectometer. In terms of the stability of the colored product over time, no significant change in the optical signal was observed for at least 60 minutes.
Optimization of variables
After identification of the significant parameters, the variables were optimized using a central composite
design37 in order to obtain the best analytical conditions
for the spot reaction on the filter paper. All experimental
designs were carried out with the lead concentration fixed
at 250 mg L-1. The statistical calculations were performed
using Statistica 6.0 software.
The factors studied were the ROD and SDS concentrations. The values of the variables were studied using five levels, with four central points. The points of a central composite design are coded unities distant from the central point (which is coded as zero); all the points therefore lie on a circumference with radius. The variables and their levels (non-coded and coded) used in the central composite design matrix are shown in Table 1. The repeatability of the method was determined by carrying out the experiment corresponding to the central point using extra replicates (four) in the center in order to estimate the experimental error.
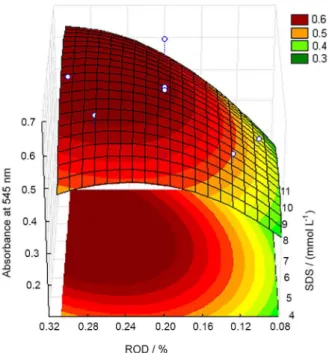
Figure 1 shows the three-dimensional response surface graph obtained from the fitting of the experimental data.
The quadratic regression model could be described by: z = –0.083 + 0.082[SDS] – 0.007[SDS]² + 2.714[ROD] – 7.125[ROD]² + 0.154[ROD][SDS], where z is the response factor corresponding to the absorbance (optical density for reflectance measurements) value.
The response surface graph shows a darker region representing higher values of absorbance, indicative of the optimum conditions for the reaction to take place. After application of the statistical treatments, the best concentrations found were 0.28% (m/v) for ROD and
9 mmol L-1 for SDS.
Determination of the figures of merit
The proposed method was validated by considering the linear dynamic range, repeatability, limit of detection
Scheme 2. Reaction between sodium rhodizonate and Pb2+ ions.
Table 1. Matrix obtained from the coordinates of the central composite design points
Experiment Factor
SDS / (mmol L-1)a ROD / % (m/v)a
1 5.73 (–) 0.129 (–)
2 9.27 (+) 0.129 (–)
3 5.73 (–) 0.271 (+)
4 9.27 (+) 0.271 (+)
5 5.00 (–) 0.200 (0)
6 10.0 (+) 0.200 (0)
7 7.50 (0) 0.100 (–)
8 7.50 (0) 0.300 (+)
9 7.50 (0) 0.200 (0)
10 7.50 (0) 0.200 (0)
11 7.50 (0) 0.200 (0)
12 7.50 (0) 0.200 (0)
(LOD), limit of quantification (LOQ), precision, and recovery.
The analytical curve (Figure 2) was constructed in the
concentration range from 4.70 to 140.0 mg L-1 (2.27 × 10⁻⁵
to 6.74 × 10⁻⁴ mol L-1), by appropriate dilution of a stock
solution of lead(II). The regression equation obtained
was: Absorbance= 0.00407[Pb2+] – 0.00511 (R = 0.998).
Statistical analysis was performed as described by Harris.38
The LOD and LOQ were determined according
to IUPAC recommendations:39 LOD = 3(σ/S) and
LOQ = 10(σ/S), where σ is the standard deviation of
measurements of the blank (n = 10) and S is the slope of the linear dynamic range. The LOD and LOQ were 1.12
and 3.75 mg L-1, respectively.
The precision of the method, expressed as the relative standard deviation (RSD) of the response, was assessed by repetition of points of the analytical curve at different times
on one day (intra-day) and on different days (inter-day). The coefficients of variation obtained were 1.1% and 2.4%, respectively.
Compared to previously reported methods for the determination of lead in cosmetic products for changing the
color of hair14 and another matrices,4-6,9,12,40-43 the proposed
method provides lower sensitivity (higher detection limit). Nevertheless, considering the quantities of lead present in the samples studied, the proposed method is sufficiently sensitive to permit the determination of this analyte in commercial products. Table 2 shows a comparison of the analytical features of the proposed method with those achieved in previous methods described in the literature for the determination of lead in cosmetic products used to change the color of hair.
Study of interferences
Investigation was made of the effects of the common ingredients present together with lead acetate in commercial hair dye formulations (propylene glycol, ammonium chloride, panthenol, acetic acid, and benzoate). No
Figure 1. Optimized response surface for the measurements of absorbance at 545 nm as a function of the concentrations of ROD and SDS.
Table 2. Comparison of analytical parameters of methods for the determination of lead in cosmetic products used to change the color of hair
Analytical parameter GF-AASa DRSb
Linear range 1.50-50.0 µg L-1 4.70-140 mg L-1
LOD 0.33-0.44 µg L-1 (depending on the sample) 1.12 mg L-1 Remarks Direct analysis without prior digestion; dilution
with 2.5% (v/v) HNO3 and 1.5% (v/v) H2O2 is required; without pre-concentration.
Sample preparation involves dilution with water without pre-concentration; no sophisticated instrumentation; rapid response time, less expensive, use of small volumes of
reagents, and a single filter paper platform.
Samples Liquid, dust, and cream hair dyes Progressive hair lotion
Reference 14 Proposed method
interferences were observed, with the signals showing differences that were less than 3%.
Application
The proposed method was applied using four samples of progressive hair dye lotion. The results obtained by the new method were compared statistically (using
the paired t-test at a 95% confidence level) with those
obtained using the reference method,35 and showed good
agreement (Table 3).
The calculated t-values did not exceed the critical values,
indicating that there was no significant difference between the two methods, in terms of precision and accuracy. The
Pb2+ concentrations measured in the progressive hair dye
samples were lower than 0.6% (m/v), and were therefore in compliance with Brazilian legislation.
Conclusions
A micellar SDS medium was used in development of a diffuse reflectance spectroscopy method that showed good sensitivity, compared to other reported methods employing the same technique for quantitative
determination of cations.27,33,34 The proposed method for
the analysis of lead by diffuse reflectance spectroscopy has the advantages of fast reaction and measurement, simplicity, low reagent consumption, minimal waste generation, relatively low cost, and good precision and reliability. A further benefit is that, unlike many other methods, no sample pretreatment is required (except dilution). This environmentally friendly technique was successfully applied for the determination of lead in samples of progressive hair dye lotion.
Acknowledgements
We would like to thank CAPES and CNPq for financial support.
References
1. Alloway, B. J.; Heavy Metals in Soils, 2nd ed.; Blackie Academic
& Professional: London, 1995.
2. Silbergeld, E. K.; Waalkes, M.; Rice, J. M.; Am. J. Ind. Med.
2000,38, 316.
3. Markus, J.; McBratney, A. B.; Environ. Int. 2001, 27, 399. 4. Saenz, M.; Fernandez, L.; Dominguez, J.; Alvarado, J.;
Electroanalysis 2010, 22, 2842.
5. Anthemidis, A. N.; Adam, I. S. I.; Zachariadis, G. A.; Talanta
2010, 81, 996.
6. Quinaia, S. P.; Rollemberg, M. C. E.; da Silva, J. B. B.; Can. J. Anal. Sci. Spect. 2006, 51, 225.
7. Soylak, M.; Narin, I.; Bezerra, M. A.; Ferreira, S. L. C.; Talanta
2005, 65, 895.
8. Alizadeh, T.; Amjadi, S.; J. Hazard. Mater. 2011, 190, 451. 9. Rodriguez, J. A.; Ibarra, I. S.; Galan-Vidal, C. A.; Veja, M.;
Barrado, E.; Electroanalysis 2009, 21, 452.
10. Xu, Q.; Liu, N.; Zhu, J.; Chinese J. Chem. Eng. 2005, 23, 1510. 11. Adraoui, I.; El Rhasi, M.; Amine, A.; Idrissi, L.; Curulli, A.;
Palleschi, G.; Electroanalysis 2005, 17, 685.
12. Qin, D.; Zheng, W.; Yang, X.; Zhiye Yu Jiankang2005, 21, 1964.
13. Mathieu, H.; Le Moigne, F.; Panteix, G.; Derache, P.; Jouzier, E.;
Ann. Biol. Clin. Paris 2003, 61, 667.
14. Soares, A. R.; Nascentes, C. C.; Anal. Lett. 2013, 46, 356. 15. Nohynek, G. J.; Gerhard, J.; Fautz, R.; Benech-Kieffer, F.;
Toutain, H.; Food Chem. Toxicol. 2004, 42, 517.
16. United States Food and Drug Administration (FDA); Color Additives Exempt from Certification, Title 21 of the Code of Federal Regulations, Section 73.2396, USFDA: Silver Spring, 2014.
17. Agência Nacional de Vigilância Sanitária (ANVISA); Resolução RDC No. 79, 2000.
18. Pezza, L.; Tubino, M.; Melios, C. B.; Pezza, H. R.; Anal. Sci.
2000, 16, 313.
19. Jungreis, E.; Spot Test Analysis: Clinical, Environmental,
Forensic and Geochemical Applications, 2nd ed.; Wiley: New
York, 1997.
20. Pelton, R.; TrAC, Trends Anal. Chem. 2009, 28, 925. 21. Parolo, C.; Merkoci, A.; Chem. Soc. Rev. 2013, 42, 450. 22. Martinez, A. W.; Phillips, S. T.; Whitesides, G. M.; Carrilho, E.;
Anal. Chem. 2010, 82, 3.
23. Luiz, V. H. M.; Pezza, L.; Pezza, H. R.; Food Chem. 2012, 134, 2546.
24. Carrilho, E.; Phillips, S. T.; Vella, S. J.; Martinez, A. W.; Whitesides, G. M.; Anal. Chem. 2009, 81, 5990.
25. Dias, N. C.; Porter, M. D.; Fritz, J. S.; Anal. Chim. Acta 2006,
558, 230.
26. Luiz, V. H. M.; Pezza, L.; Pezza, H. R.; Microchem. J. 2013,
109, 68. Table 3. Results for the determination of lead(II) in progressive hair
lotion samples
Sample Proposed method Pb2+ / % (m/v)
Reference method35
Pb2+ / % (m/v) t-test a
1 0.061 ± 0.001 0.061 ± 0.001 0.163
2 0.059 ± 0.005 0.062 ± 0.002 0.678
3 0.100 ± 0.002 0.099 ± 0.002 0.853
4 0.252 ± 0.002 0.254 ± 0.004 1.35
27. Tubino, M.; Rossi, A. V.; Magalhães, M. E. A.; Anal. Lett. 1997,
30, 271.
28. Frei, R. W.; Frodvma, M. M.; Lieu, V. T.; Comprehensive Analytical Chemistry, Volume IV: Instrumentation for
Spectroscopy; Elsevier: Amsterdam, The Netherlands, 1975.
29. Veras, G.; Silva, E. C.; Lyra, W. S.; Soares, S. F. C.; Guerreiro, T. B.; Santos, S. R. B.; Talanta 2009, 77, 1159.
30. Benedetti, L. P. S.; Santos, V. B.; Silva, T. A.; Filho, E. B.; Martins, V. L.; Fatibello-Filho, O.; Anal. Methods 2015, 7, 4138. 31. Arena, M. P.; Porter, M. D.; Fritz, J. S.; Anal. Chem. 2002, 74,
185.
32. Lima, L. S.; Weinert, P. L.; Lemos, S. C.; Sequinel, R.; Pezza, H. R.; Pezza, L.; Spectrochim. Acta A 2009, 71, 1999. 33. Ghauch, A.; Rima, J.; Charef, A.; Suptil, J.; Fachinger, C.;
Martin-Bouver, M.; Talanta 1999, 48, 385.
34. Ghauch, A.; Turnar, C.; Fachinger, C.; Rima, J.; Charef, A.; Suptil, J.; Martin-Bouver, M.; Chemosphere 2000, 40, 1327. 35. Agência Nacional de Vigilância Sanitária (ANVISA); Guia
de Controle de Qualidade de Produtos Cosméticos, 2ª ed.;
ANVISA: Brasília, 2008.
36. Esteve-Romero, J. S.; Simó-Alfonso, E. F.;
Garcia-Alvarez-Coque, M. C.; Ramis-Ramos, G.; TrAC, Trends Anal. Chem.
1995, 14, 29.
37. Montegomery, D. C.; Myers, R. H.; Response Surface Methodology: Process and Product Optimization Using
Designed Experiments, 2nd ed.; Wiley: New York, 2002.
38. Harris, D. C.; Quantitative Chemical Analysis, 8th ed.; W. H.
Freeman Book Companion: New York, 2012.
39. Thompson, M.; Ellison, S. L. R.; Wood, R.; Pure Appl. Chem. 2002, 74, 835.
40. Anthemidis, A. N.; Giakisikli, G.; Xidia, S.; Miro, M.;
Microchem. J. 2011, 98, 66.
41. Savvin, S. B.; Dzherayan, T. G.; Petrova, T. V.; Mikhailova, A. V.; J. Anal. Chem-(USSR) 1997, 52, 154.
42. Trutneva, L. M.; Shvoeva, O. P.; Savvin, S. B.; J. Anal. Chem
(USSR) 1989, 44, 1804.
43. Zaporozhets, O. A.; Tsyukalo, L. Y.; Talanta 2002, 58, 861.
Submitted: May 19, 2015
Published online: August 14, 2015