Mr.N.Vimalraj et al Int. Journal of Engineering Research and Applications
www.ijera.com
ISSN : 2248-9622, Vol. 4, Issue 1( Version 4), January 2014, pp.69-72
www.ijera.com 69 |P a g e
An Automated System To Classify Alloy Steel Surface Using
Contourlet Transform
Mr.N.Vimalraj*, Dr.B.Giriraj**
*(Department of Mechanical Engineering, Anna University, Chennai-25)
** (Department of Mechanical Engineering, PSG College of Technology, Coimbatore-4)
ABSTRACT
Surface defect detection of metallic surfaces is a major challenge in any manufacturing industry. In this paper, an automated system to classify alloy steel surface based on contourlet transform is presented. As the contourlet transform is a multi resolution analysis, texture present in alloy steel surface is represented in various scales and directions. The image is decomposed at various scales and directions and the energy features are extracted. By analyzing the energies from the trained images, the best set that distinguishes the surface into defect or non defect is chosen for classification. The classification results are evaluated on the given set of images of alloy steel surface and the performance of the system is evaluated.
Keywords
- Contourlet transform, Image classification, Energy features, Alloy steel surface.I.
Introduction
Automatic inspection of metallic surface defects using genetic algorithms is proposed in [1]. An experimental system has been developed to take images of external metallic surfaces and an intelligent approach based on morphology and genetic algorithms is proposed to detect structural defects on bumpy metallic surfaces. The approach employs genetic algorithms to automatically learn morphology processing parameters such as structuring elements and defect segmentation threshold.
A dissimilarity measure based on the optical flow technique for surface defect detection, and aims at light-emitting diode wafer die inspection is proposed in [2]. From an optical flow field, the dissimilarity measure of each pixel is derived. An automated visual inspection scheme for multi crystalline solar wafers using the mean shift technique is presented in [3]. Mean shift technique is used to detect the defects in a complicated background. This technique is then applied on an entropy image for removing the noises and to detect free grain edges. A simple adaptive threshold method is used to identify the defected surface.
To extract a set of features that can effectively address the problem of defect detection on hot rolled steel surface by using machine learning algorithm is explained in [4]. Two types of features are extracted with two and three resolution levels.
They are wavelet and contourlet features. SVM classifier is used for detecting the surface into normal or abnormal. A unified approach for defect detection is proposed in [5] for finding anomalies in surface images. This approach consists of global estimation and local refinement. Global estimation is
used to estimate the defects roughly by applying a spectral based approach. Then refine the estimated regions locally based on the pixel intensity distribution which is derived from the defect and defect free regions.
An effective de-blurring method is proposed in [6] for surface defect detection on Gaussian blur images. Learned Partial Differential Equation (L-PDE) is applied for Gaussian blur images as a pre processing method. L-PDE model achieve much better results in comparison with the traditional image de-blurring methods. The detection of surface defects of the ceramic-glass based on digitized images is proposed in [7]. In order to gain the binary images threshold is used. Markov random field models are fitted to binary textures. This experiment is applied on the factory samples to verify the feasibility of this method.
A novel technique for detecting defects in fabric image based on the features extracted using a new multi resolution analysis tool called digital curvelet transform is proposed in [8]. The extracted features are direction features of curvelet coefficients and texture features based on GLCM of curvelet coefficients. K-nearest neighbor is used as a classifier for detecting the surface. A new method to detect the defect of texture images by using curvelet transform is presented in [9]. The curvelet transform can easily detect defects in texture, like one-dimensional discontinuities or in two dimensional signal or function of image. The extracted features are energy and standard deviation of division sub-bands.
Mr.N.Vimalraj et al Int. Journal of Engineering Research and Applications
www.ijera.com
ISSN : 2248-9622, Vol. 4, Issue 1( Version 4), January 2014, pp.69-72
www.ijera.com 70 |P a g e embedding algorithm is used to reduce the dimension
of the extracted feature vector with higher dimension. In order to implement the proposed feature extraction method the grouping of curvelet transform and the kernel locality preserving projection algorithm is selected, and for testing the validity of the method the samples from hot rolling production are used.
The organization of the paper is as follows. The methodologies used in the proposed surface defect detection algorithm are introduced in Section II. The proposed surface defect detection algorithm in alloy steel is presented in Section III. The evaluation of the proposed system is presented in Section IV. Finally, the conclusion is made in Section V.
II.
Methodology
The proposed system for the classification of alloy steel surface into defected or non-defected is built based on contourlet Transform. This section discusses some background information about contourlet transform related to the proposed system. Efficient representations of signals require that coefficients of functions, which represent the regions of interest, are sparse. Wavelets can pick up discontinuities of one dimensional piecewise smooth functions very efficiently and represent them as point discontinuities. 2D WVT obtained by a tensor product of one-dimensional wavelets are good to isolate discontinuities at edge points, but cannot recognize smoothness along contours. Numerous methods were developed to overcome this by adaptive [14], or filter bank-based techniques [11]. Do and Vetterli [11] proposed the Pyramidal Directional Filter-Bank (PDFB), which overcomes the block-based approach of CVT by a directional filter bank, applied on the whole scale, also known as CTT. It has been developed to offer the directionality and anisotropy to image representation that are not provided by separable WVT. CTT is a multiscale and directional decomposition of a signal using a combination of a modified Laplacian Pyramid (LP) [13, 14] and a Directional Filter Bank (DFB) [12]. PDFB allows for different number of directions at each scale/resolution to nearly achieve critical sampling.
As DFB is designed to capture high frequency components (representing directionality), the LP part of the PDFB permits subband decomposition to avoid ”leaking” of low frequencies into several directional subbands, thus directional information can be captured efficiently.
Figure 1. A flow graph of the contourlet transform. The image is first decomposed into subbands by the Laplacian pyramid and then each detail image is
analyzed by the directional filter banks.
III.
Proposed Method
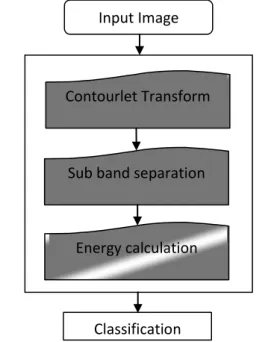
A novel computerized system to classify the steel alloy surface based on contourlet is described in this section. Contourlet analyze the input image in frequency domain. The main advantage of contourlet is the capability to extract the local features by separating the given input signal/image in both time and scale. The proposed approach is shown in Fig.2.
Figure 2 Automated system for the classification of steel alloy surface defect
In order to classify the given steel alloy image, the given image is decomposed by Contourlet transform initially. It represents the given steel alloy surface into various frequency components at different decomposition level. In the contourlet transform is analyzed at various scales and directions. The image of 512x512 pixels when decomposed to 2 levels 2 directions produces one approximation image of size 128x128 pixel, 4 detailed sub bands of
Sub band separation
Contourlet Transform
Energy calculation
Input Image
Mr.N.Vimalraj et al Int. Journal of Engineering Research and Applications
www.ijera.com
ISSN : 2248-9622, Vol. 4, Issue 1( Version 4), January 2014, pp.69-72
www.ijera.com 71 |P a g e size 128x128 pixel and 4 detailed sub bands of size
256x256 pixels. The detailed sub-bands have the detailed information about the given signal/image such as edges, textures. Due to this, only the detailed sub-bands are considered for classification analysis. The parameter used for classification is energy features computed from the detailed sub-bands. Among the various detailed sub-band energy, the best detailed sub-band is chosen for testing.
The steel alloy surface is characterized by the energy distribution of wavelet coefficients. The calculation of energy distribution can be done by taking the magnitude of coefficients. The energy of a sub-band is defined as the mean of the magnitude of the coefficients in that sub-band. It is given by:
1 1
1
( , )
R C
e e
i j
Energy
I i j
RC
(1)where Ie(i,j) is the pixel value of the eth
sub-band and R, C is width and height of the sub-band respectively.
IV.
Experimental Result
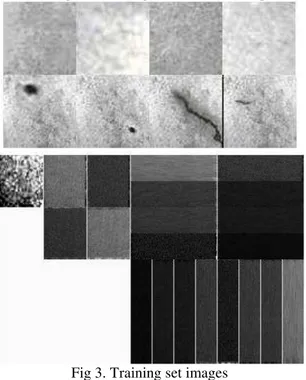
The performance of the proposed method is evaluated on 50 defect free alloy steel surface and 10 defected surface images. Fig.3 shows the images used for experiment. The top row images in the figure are no defect surfaces and bottom row images are defected images. The images are of 512x512 pixels.
Fig 3. Training set images
Figure 4. Contourlet coefficients at 2 level and 4 direction
Fig. 4 shows the contourlet coefficients for a 2 level and 4 direction copmosition of an image with
no defects. The energy feature described in the previous chapter is caluclated for the each sub band.
Table 1: classification rate of contourlet features for alloy steel surfaces at 4th level
S.No Number of Directions
Classification rate (%)
1 2 75.94
2 4 78.43
3 8 82.19
4 16 83.12
5 32 83.43
6 64 83.75
The Table displays the classification rate of the surface of various subbands of the test images at 4th level decomposition. The performance of the proposed system is evaluated by varying the direction filter size used in the decomposition. From the table 1, it is clearly found that over 83 % classification result is achieved. As the size of the directional filter increases, the classification rate of the proposed system based on contourlet also increases. But after 4th direction there is no significant increase in the classification rate.
V.
Conclusion
In this paper, contourlet transform based automated system for alloy steel surface classification is proposed. The classification of alloy steel surface into defect or defect free surface is done by using image processing techniques. The developed algorithm uses contourlet transform for feature extraction. From the result it is observed that over 83% classification rate is achieved by the system. However, the algorithm should be tested for surfaces having defects with various sizes and illumination variations, and this will be considered in the future work.
References
[1] Zheng, Hong, Ling Xue Kong, and Saeid Nahavandi. "Automatic inspection of metallic surface defects using genetic algorithms." Journal of materials processing technology 125 (2002): 427-433.
Mr.N.Vimalraj et al Int. Journal of Engineering Research and Applications
www.ijera.com
ISSN : 2248-9622, Vol. 4, Issue 1( Version 4), January 2014, pp.69-72
www.ijera.com 72 |P a g e Transactions on Industrial Informatics,vol.8,
no.1, pp 128 – 137.
[3] Du-Ming Tsai ,Yuan-Ze Univ, Taoyuan and Taiwan Jie-Yu Luo, 2011, Mean shift based defect detection in multicrystalline solar wafer surfaces, IEEE Transactions on Industrial Informatics, vol.7, no.1, pp 125 – 135.
[4] Ghorai.S, Singh. R and Gangadaran. M, 2012, Wavelet versus contourlet features for automatic defect detection on hot rolled steel sheet, Third International Conference on Emerging Applications of Information Technology (EAIT), pp 149 – 152.
[5] Jiwon Choi and Changick Kim, 2012, Unsupervised detec-tion of surface defects: A two-step approach, 19th IEEE International Conference Image Processing (ICIP), pp 1037 – 1040.
[6] Liang Wang, Yaping Hang,Siwei Luo, Xiaoyue Luo and Xinlan Jiang, 2011, A new cluster based feature ex-traction method for surface defect detection: De-blurring Gaussian blur images: A preprocessing for rail head surface defect detection, IEEE Interna-tional Conference on Service Operations, Logistics, and Informatics, pp 451 – 456.
[7] Jiaoyan Ai and Xuefeng Zhu, 2002, Analysis and detection of ceramic glass surface defects based on computer vision, Proceedings of the 4th World Congress on Intelligent Control and Automation, vol.4, pp 3014-3018
[8] Jianyun Ni, Jing Luo, Zaiping Chen and Enzeng Dong, 2013, A multi resolution method for detecting defects in fabric images, Research Journal of Applied Sciences, Engineering and Technology vol.5,no.5, pp 1689-1694.
[9] Moasheri. B.B.M and Azadinia. S, 2011, A new voting ap-proach to texture defect detection based on multiresolutional decomposition, World Academy of Science, Engineering and Technology, vol.49, pp 657-661
[10] Ke Xu, Yong hao Ai and Xiu-yong Wu, 2013, Application of multiscale feature extraction to surface defect classification of hot rolled steels, International Journal of Minerals, Metallurgy and Materials, vol.20, no.1, pp 37-41.
[11] M. Do. Directional Multiresolution Image Representations. Ph.D. Thesis, Department of Communication Systems, Swiss Federal Institute of Technology Lausanne, November 2001.
[12] M. Do and M. Vetterli. Contourlets. int J. Stoeckler, G. V. Welland (Eds.), Beyond Wavelets, pp.1-27., Academic Press,2002. [13] D.L. Donoho and M. Duncan. Digital
Curvelet Transform: Strategy, Implementation, and Experiments. in Proc. Aerosense 2000, Wavelet Applications VII, SPIE, 4056, 2000.