Article
*e-mail: [email protected]
Morphological, Structural, Microhardness and Corrosion Characterisations of
Electrodeposited Ni-Mo and Cr Coatings
Pedro de Lima-Neto,* Adriana N. Correia, Gustavo L. Vaz and Paulo N. S. Casciano
Departamento de Química Analítica e Físico-Química, Universidade Federal do Ceará, Campus do Pici, Bloco 940, 60455-960 Fortaleza-CE, Brazil
A resistência à corrosão de eletrodepósitos de Cr e Ni-Mo e a inluencia do tratamento térmico na estrutura cristalográica, na morfologia e nas propriedades de microdureza foram investigados. As caracterizações foram feitas usando as técnicas de microscopia eletrônica de varredura (SEM), difração de raios X (XRD) e energia dispersiva de raios X (EDX). Os ensaios de corrosão foram feitos à temperatura ambiente, em solução de NaCl 10−1 mol dm−3 e usando a técnica de
polarização linear potenciodinâmica. O teor de Mo na camada e a eiciência de corrente aumenta com a concentração do íon molibdato no banho de eletrodeposição, enquanto que a morfologia supericial evolui de rugosa e homogênea para trincada com o aumento do teor de Mo na camada. Os ensaios eletroquímicos de corrosão mostram que os eletrodepósitos de Cr são mais resistentes à corrosão que os eletrodepósitos de Ni-Mo e que todas as camadas estudadas corroem em meio de cloreto. Dentre os eletrodepósitos de Ni-Mo estudados, o de Ni-13Mo foi o que apresentou o comportamento de resistência à corrosão mais nobre. A microdureza do eletrodepósito Ni-13Mo aumenta com o aumento da temperatura de tratamento térmico e está relacionado à formação de fases de Ni, Ni4Mo e NiMo, durante o tratamento térmico. Ni-13Mo é um potencial candidato a substituir o Cr em aplicações industriais quando a temperatura de operação for maior que 100 °C e que boas propriedades de microdureza sejam requeridas.
The corrosion resistance of electrodeposited Cr and Ni-Mo coatings and the inluence of heat treatment on the crystallographic structure, morphology and microhardness properties were investigated here. The characterisations were carried out using scanning electron microscopy (SEM), X-ray diffraction (XRD) and energy dispersive X-ray analysis (EDX) techniques. Corrosion tests were performed at room temperature in 10−1 mol dm−3 NaCl solutions and by potentiodynamic
linear polarization technique.TheMo content in the layer and current eficiency increased with the molybdate ion concentration in the plating solution, while the surface morphology evolved from rough and homogeneous to cracked surface with the increase of the amount of Mo in the layer. The electrochemical corrosion tests showed that the Cr coatings have better corrosion resistance than the Ni-Mo coatings in chloride medium and that all the studied coatings corrode in chloride medium. Ni-13Mo coating has the nobler corrosion behavior among the studied Ni-Mo coatings. The microhardness of the Ni-13Mo coatings increased as the annealing temperature increased which is related with the precipitation of Ni, Ni4Mo and NiMo phases during the heat treatment of this coating. Ni-13Mo coating is a potential substitute for chromium coating in industrial applications when operating at temperatures higher than 100 °C and good microhardness properties are required.
Keywords: Ni-Mo, Cr, electrodeposition, corrosion, heat treatment, microhardness
Introduction
Hard chromium coating is yet widely used in industrial practice because it presents good corrosion resistant properties. However, due to the environmental and toxicological restrictions involved in the hard chromium industrial electroplating process, which requires the use
Some works reported in the literature were published regarding only the operational electroplating parameters or about the electrodeposition mechanism of the Ni-Mo layer. Podlaha et al.3,4 studied the electrodeposition of Ni-Mo coatings on rotating cylinder electrodes and observed that coating composition was inluenced by Ni2+/Mo
2O42− ratio in the plating solution and that Mo content was strongly inluenced by the convective transport. Pavlov et al.5 have presented a wide investigation about the electroplating of Ni-Mo alloys from ammonium citrate baths containing intermediate valence molybdenum compounds and they evaluated the electrolysis under different operational conditions, such as pH and temperature. The effect of differing molybdenum compounds (oxidation degrees of +6, +5, and +3) on the alloy formation makes possible controlling the alloy composition and the current eficiency by varying the concentration ratio of molybdenum in different states of the oxidation. The prospects for the formation of deposits of adequate quality with the current eficiency of nearly 80% were demonstrated.
Kuznetsov et al.6,7 investigated the effect of concentration of ammonia and citrate ions on the electrodeposition of a Ni-Mo alloys. The experimental data indicated an incomplete reduction of molybdate ions accelerated by ammonium ions forming intermediate products adsorbed on the electrode surface.
The electrodeposition of Ni-Mo was also performed using pulsed techniques. Yagi et al.8 carried out a study using alternating pulse electrolysis and they have demonstrated that molybdenum can be electrodeposited on a nickel substrate electrochemically using an aqueous Mo(VI) solution. Ni-Mo alloy with different compositions can be obtained without having to prepare various plating solutions by controlling the pulse parameters. Marlot et al.9 showed that at suficiently short pulse periods, the Mo content was higher than in dc plating condition.
On the other hand, little attention is given in the literature about the physical characterization of electrodeposited Ni-Mo coatings.10-13 Donten et al.10 performed the electrodeposition of Ni-Mo alloys from pyrophosphate baths and they showed that the use of this complexing agent resulted in the removal of bumps, spheres and cracks from the Ni-Mo alloy surface. The amorphous/nanocrystalline structures appeared for the deposits content Mo higher than 20% in atom while that obtained with the lower amount of Mo were crystalline. Chassaing et al.11 studied the electrodeposition of Ni-Mo nanocrystalline layers using direct current in citrate-ammonium plating solutions and found that the layers exhibited microhardness comparable with the hard chromium coating (ca. 800 Vickers) and also presented corrosion current higher than Hastelloy B alloy.
These authors also found that the alloys with Mo content high than 30 wt.% were amorphous. Sanches et al.12,13 studied the electrodeposition of Ni-Mo in citrate medium at pH 4 and obtained crystalline Ni-Mo coating and, using XPS technique, they detected the presence of multivalent molybdenum oxide or hydroxide.
Furthermore, nothing it is known about the inluence of annealing temperature on the crystal structure, coating morphology and hardness properties of the Ni-Mo coatings. In addition, despite many authors quote the good corrosion resistance properties of the electrodeposited Ni-Mo coatings at room temperature, relatively little reports about this subject are found in the literature.11 Thus, this work was carried out aiming to perform a comparative study of the corrosion resistance of both electrodeposited Cr and Ni-Mo coatings in chloride medium and also to evaluate the inluence of thermal treatments on corrosion resistance, on crystal structure and on microhardness properties of these coatings.
Experimental
Electrodeposition
Solutions were prepared from analytical grade purity chemicals dissolved in water puriied with a Millipore Milli-Q system. Ni-Mo coatings were electrodeposited on disc-shaped Cu substrate embedded in epoxy resin, with a geometric area of approximately 2 cm2 of exposure. The electrodepositions were performed in a single-compartment Pyrex glass cell with a Telon cover containing holes to
ix the Cu cathode and the platinum mesh anode. Prior to the alloy plating, the Cu surfaces were polished with 240, 400 and 600 SiC emery paper, degreased in a hot NaOH solution, rinsed in distilled water, etched in 15% HCl solution and, lastly, rinsed with distilled water. Table 1 gives the composition of the Ni-Mo plating solutions and the operational parameters used to electrodeposit Ni-Mo
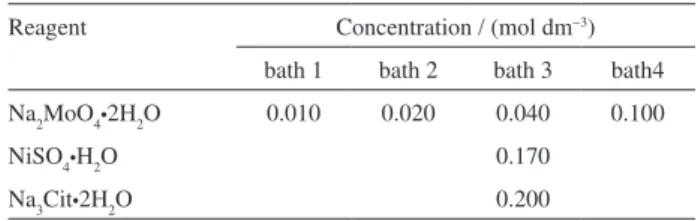
Table 1. Composition of the baths utilized in the electrodeposition (pH 9)
Reagent Concentration / (mol dm−3)
bath 1 bath 2 bath 3 bath4 Na2MoO4•2H
2O 0.010 0.020 0.040 0.100
NiSO4•H
2O 0.170
Na3Cit•2H2O 0.200
Operational deposition parameters: pH 9 (adjusted with ammonia)
Plating temperature = room temperature (ca. 27 °C) Electrodeposition current density = 50 mA cm−2
coatings. The Cr layers were deposited under galvanostatic control at 135 mA cm−2 from an industrial plating bath containing 0.5 mol dm−3 CrO
3 and 0.02 mol dm−3 H2SO4 at 60 °C with a total charge of 250 C.
Heat treatment
As-electrodeposited Cu/Ni-Mo and Cu/Cr samples were annealed in a N2 atmosphere at 100, 200, 400 and 600 °C, using a heating rate of 10 °C min−1 from room temperature to the desired temperature plateau, where they were held for 1 h and then cooled to room temperature.
Physical and chemical characterization
The surface and cross section morphologies of the electrodeposits were analyzed by a Philips XL-30 SEM. The SEM cross section allowed the determination of the coating thickness. The coating composition was analyzed by EDX apparatus attached to the SEM. The coating crystal phase structure was analyzed by XRD using a Philips model X’Pert pro diffractometer with Cu Kα radiation (λ = 1.54 Å) at 40 KV and 40 mA and an incident angle of 3°. The main peaks observed in the diffractograms were compared with XRD data from the Joint Committee of Powder Diffraction Standards (JCPDS). Microhardness measurements were carried out using Shimadzu, model HMV-2-Series, microhardeness tester with a diamond pyramid indenter at a load of 10 g, which was maintained for 30 s. An average of 10 readings was taken to obtain the hardness values of the coatings. To prevent the substrate from affecting the microhardness measurements, samples were obtained with a total electrodeposition charge of 1,500 C.
Corrosion tests
The corrosion behaviour of as-electrodeposited Ni-Mo and Cr coatings were evaluated by potentiodynamic linear polarization (PLP) technique with scan rate of 1 mV s−1 in 0.1 mol dm−3 NaCl aqueous solutions with a natural pH of 6.5. A potenciostato/galvanostato AUTOLAB PGSTAT 30, linked to a PC microcomputer and controlled by the GPES and FRA software, was used for the acquisition of the electrochemical data.
Results and Discussion
EDX analyses
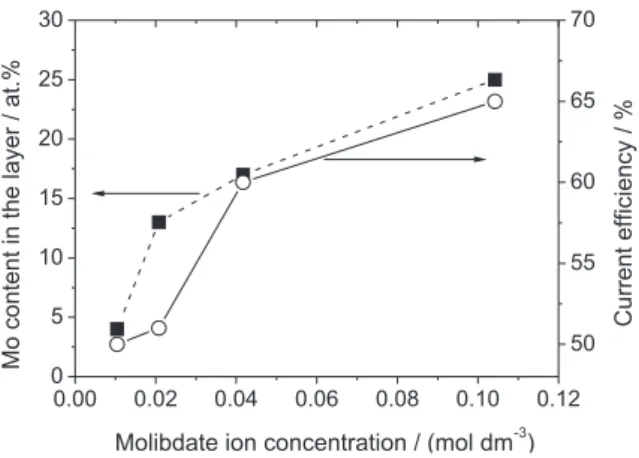
The inluence of the MoO42− ion concentration on the
Mo content in the layer and current eficiency is shown in
Figure 1. The current eficiency was calculated from the equation (1), where ηc is the cathodic current eficiency, tE is the experimental thickness determined from SEM cross section analyses and tT is the thickness calculated from Faraday’s laws.
ηc = (tE / tT) × 100 (1)
It can be observed in this igure that the molybdenum content in the layer and the current eficiency rise with the molybdate ion concentration in the plating solution. This behaviour is in close agreement the results reported in the literature by Marlot et al.,9 which electrodeposited Ni-Mo layers in ammonia-citrate electrolyte applying pulse potential and in similar concentration range of molybdate ion to that used in this investigation. Similar dependence between the amount of Mo in the layer and the molybdate ion concentration was also observed by Donten et al.10 in pyrophosphate plating bath using normal direct current. Marlot et al.9 pointed out that the observed dependence between the amount of Mo in the layer and the molybdate ion concentration in the plating solution suggests that the codeposition process is limited by diffusion of the molybdate ion.
SEM characterization of the as-electrodeposited coatings
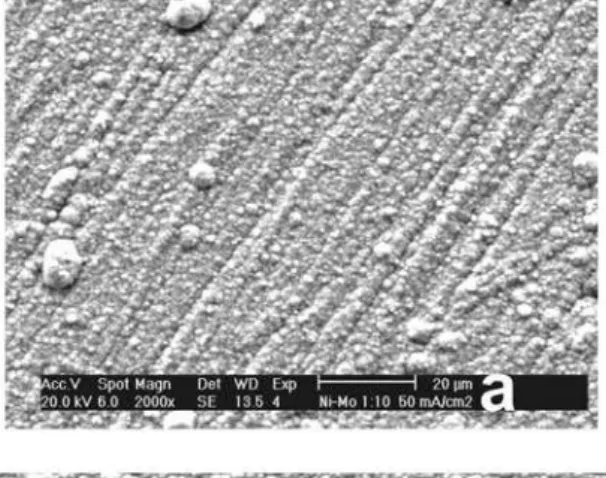
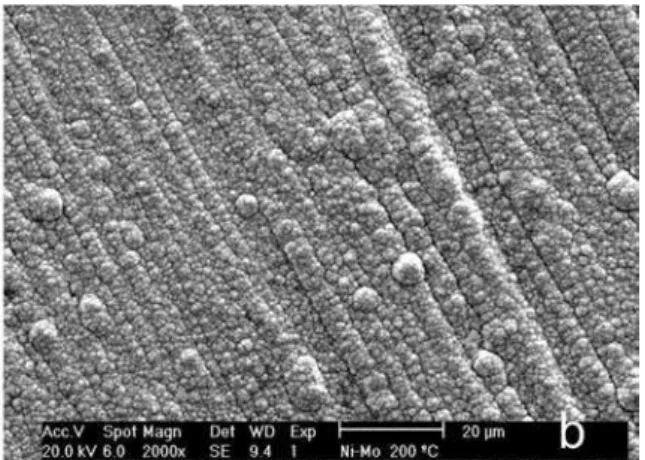
The surface and cross sections morphologies of the as-electrodeposited Ni-Mo coatings were analyzed by SEM and selected images are displayed in Figure 2. The surface SEM images show that the coatings obtained from the plating solutions containing 0.01 mol dm−3 and 0.02 mol dm−3 of molybdate ions (baths 1 and 2) are rough and homogeneous, without defects from top to bottom and with some nuclei distributed on the surface (Figures 2a-2d), while those obtained from the plating solution containing
Figure 1. Inluence of the MoO42− ion concentration on the Mo content
Figure 2. SEM images showing the surface and cross section morphologies of the Ni-Mo coatings obtained at 50 mA cm−2: Ni-4Mo obtained from bath
containing 0.01 mol dm–3 MoO
42– (a, b); Ni-13Mo obtained from bath containing 0.02 mol dm–3 MoO42– (c, d); Ni-17Mo obtained from bath containing
0.04 mol dm–3 MoO
0.04 mol dm−3 and 0.10 mol dm−3 of molybdate ions (baths 3 and 4) are cracked (Figures 2e and 2g), which cross from the surface until the substrate (Figures 2f and 2h). The presence of the observed nuclei on the Ni-Mo surface can be explained as a consequence of the growth of secondary nuclei on top of the layer that were formed in the primary nucleation phase. In addition, some polyhedral grains can be observed, suggesting that they are formed by several nuclei. Cracked morphologies were also observed by Chassaing et al.11 for Ni-Mo coatings containing Mo higher than 30 wt.%, which were electrodeposited from citrate bath and under force hydrodynamic operational conditions. The appearance of the cracks is explained as being caused by relaxation of internal tensile stress in the coating.
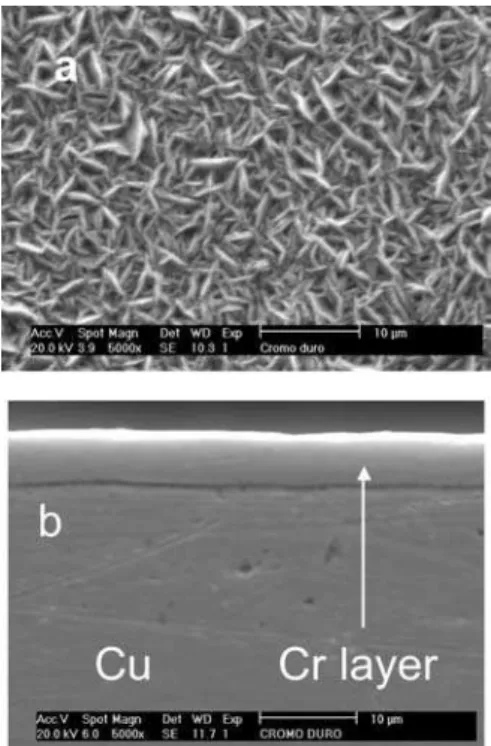
The surface and cross-sectional SEM micrographs of the Cr coating are shown in Figure 3. The surface morphology of the Cr coating is characterised by a dendrite microstructure (Figure 3a), while the cross-section micrograph reveals a homogeneous and compact coating without microcracks (Figure 3b). It is well known that a crack-free or a cracked morphology of electrodeposited Cr coating can be obtained by proper adjustment of the plating conditions,14 and the non-cracked morphologies shown in these micrographs are typical for the electrodeposited Cr coatings obtained under the operational condition used in this work. Yun et al.,15 using similar operational conditional, also obtained a non-cracked electrodeposited Cr coating. However, SEM images showed that the surface morphology was compact and dendrites were not observed.15
Electrochemical corrosion tests for the as-electrodeposited and as-annealed samples
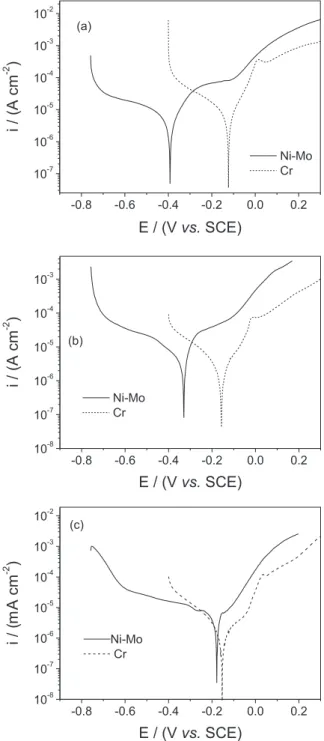
Potentiodynamic polarization curves for the as-electrodeposited Ni-Mo and Cr coatings in 0.1 mol L-1 NaCl solutions are shown in Figure 4. This igure shows that the Cr coating has the noblest corrosion potential, which is
−0.328 V. Among the Ni-Mo coatings, the nobler corrosion potential is presented by the Ni-13Mo coating, which is
−0.362 V. The experimental value of the corrosion potential for the Ni-Mo coatings are in close agreement with those reported in the literature,11 while the corrosion potential of the Cr coating is about 0.15 V more positive than that reported by others authors.15 This difference in the corrosion potential it is explained as to be related to the different surface morphology present by the electrodeposited Cr in this work (Figure 3a) compared to the surface morphology of the electrodeposited Cr coating reported in the literature.15
In addition, a current plateau is observed in the range from −0.048 V to 0.483 V in the polarization curve of the Cr coating, followed by an increase in the current for higher applied potentials, while an increase in the anodic current with the applied potential is observed in the anodic branch of all the studied Ni-Mo coatings. For the case of the Cr costing, the plateau is associated with the formation of surface ilms that can, initially, block the dissolution of the coating and the increase in current that follows the current plateau is related to the breakdown of said surface ilm, leading to the dissolution of the coating. For the Ni-Mo coatings, the increase of the anodic current is associated with the uniform dissolution of these coatings. These results demonstrate that the all coatings corrode in chloride medium. Finally, these curves also show that the
Figure 3. SEM images showing the surface (a) and the cross-section (b)
morphologies of the Cr coating.
Figure 4.Potentiodynamic polarization curves obtained in 0.1 mol dm−3
cracked coatings present the worse corrosion behavior, indicating that the cracks are deleterious for the corrosion resistance property.
From the results showed in Figure 4, Ni-13Mo coating was selected to be compared with the Cr coating in order to evaluate the inluence of the heat treatment in the corrosion resistance and microhardness properties, because it was previously shown that this proprieties deteriorate when Cr coating is heat treated, even at 100 °C.16,17 Figure 5
shows the polarization curves for the Ni-13Mo and Cr coatings annealed at the selected temperatures. This igure shows that both as-annealed Ni-Mo and as-annealed Cr coatings present uniform dissolution in chloride medium. In addition, this igure also shows that the as-annealed Cr coatings present superior corrosion resistance than the as-annealed Ni-13Mo coatings, since its corrosion potential is nobler and their anodic current densities are lesser than those presented by the as-annealed Ni-13Mo coatings.
Microhardness measurements and XRD characterization
The evolution of the microhardness of the Ni-13Mo and Cr coatings with the annealing temperature is shown in Figure 6. The as-electrodeposited Ni-13Mo and Cr coatings have microhardness about of 287 and 855 Hv, respectively. Additionally, the microhardness of the Ni-13Mo increases and the microhardness of the Cr coating decreases with the annealing temperature. Similar trend was previously observed for Ni-W-P16 and Ni-Cr-P.17
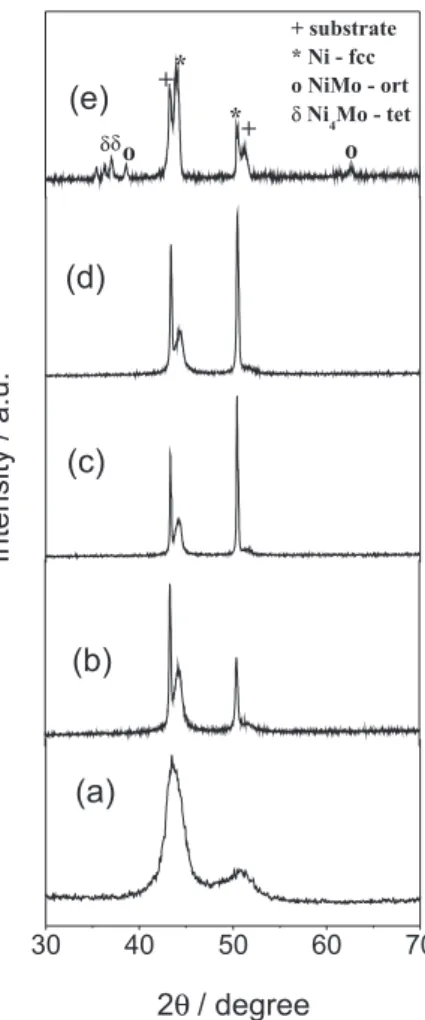
In order to understand the microhardness behaviour of the Ni-Mo coatings with the annealing temperature, X-ray diffractograms were obtained for annealed samples and the diffractograms are shown in Figure 7. For the as-electrodeposited Ni-13Mo coating (Figure 7a), two broad peaks can be observed in the diffractograms at 2θ angles of about 45° and 51°. These broad peaks can be related to the nickel diffraction peaks, and none are related to the molybdenum. This result is in close accordance with those already published in the literature for the electrodeposited Ni-Mo coatings.10,11 The X-ray diffractograms of the Ni-Mo coating electrodeposited from pyrophosphate bath10 or from citrate bath11 indicated the formation of Ni-Mo solid Figure 5. Potentiodynamic polarization curves obtained in 0.1 mol dm−3
NaCl solution for the Ni-Mo and Cr coatings annealed at 200 °C (a), 400 °C (b) and 600 °C (c).
Figure 6. Microhardness for the as-electrodeposited Ni-13Mo and Cr
Figure 7.X-ray diffractograms for the as-electrodeposited Ni-13Mo
coatings (a) and for the Ni-13Mo coatings annealed at: 100 °C (b), 200 °C (c), 400 °C (d) and 600 °C (e).
solution, with the diffraction peaks being sharp at the lower content of Mo (up to 12 wt.%) and broad for higher amount of Mo, showing that with the increase of the amount of Mo the layer becomes amorphous. Chassaing et al.11 also showed by transmission electron micrographs the same solid solution with the grain size ranging between 4 and 17 nm (average 5 nm), indicating that the electrodeposited Ni-Mo alloy is almost amorphous. Thus, the absence of peaks related to Mo in the diffractogram of the Ni-13Mo can be explained by the formation of a Mo solid solution in nickel that consists of molybdenum atoms substitutionally dissolved in nickel. In addition, the diffractograms of the as-electrodeposited Ni-13Mo is also similar with that presented by Sriraman et al.18 for the electrodeposited Ni-W coatings. From these authors, the broadened peaks observed in Figure 7a are explained as due to the reduction in the crystallite size of the alloys, with an increase in the amount of alloying molybdenum element with Ni-Mo crystallites distributed in the Ni-Mo amorphous matrix. The amorphous phase is formed during the electrodeposition process, either due to the formation
of mutually incoherent particles that are too small to permit the crystalline phase to be formed or atoms that do not bond together in the arrangement required for crystalline long-range order.19 Finally, the diffractograms of the as-electrodeposited coating suggests that Ni-13Mo coating consists of two phases: the crystalline phase and the amorphous phase.
The diffractograms of the annealed samples show that the thermal treatment leads to the precipitation of new crystalline phases, even when annealed at 100 °C. It is possible to observe that with the increase in the annealing temperature up to 400 °C the peaks with the 2θ angle of about 45° and 51° are better deined and that the relative intensity of the peak at 51° rises with the annealing temperature. These results suggest the increase of the annealing temperature up to 400 °C, Ni phases precipitate on the Ni-Mo amorphous matrix. The increase of the Ni peak intensity corresponds to an increase in the grain size with the annealing temperature. For the sample heat treated at 600 °C, new characteristic peaks are observed in the diffractograms which are associated with the precipitation of the Ni, NiMo and Ni4Mo phases. Just as the crystallographic structure can arise from the amorphous structure with the increase of the annealing temperature, the formation of NiMo and Ni4Mo phases after heat treatment at 600 °C may be explained by a separation of the these crystals phases during the heat treatment at this temperature from the amorphous phase.
From the X-ray analyses, the behaviour of the microhardness with the annealing temperature for the Ni-Mo coatings is explained due to the fact that with the increase of the annealing temperature occurs an increasing in the number of crystals separated out, and the new crystal phases that formed during the heat treatment, favouring an increase in microhardness. Thus, as the annealing temperature increases, Ni, Ni4Mo and NiMo phases precipitate leading to an increase in the microhardness of the Ni-13Mo coating.
As previously reported,16,17 the XRD diffractograms of annealed Cr coatings from 100 to 600 °C, were identical to the diffractogram obtained for the as-electrodeposited Cr coating sample. All the XRD diffractograms displayed a single characteristic peak at 2θ = 65° for the Cr (110) relection.
SEM characterisation of the as-annealed samples
Figure 8.SEM micrographs of Ni-13Mo coating annealed at 100 °C (a), 200 °C (b), 400 °C (c) and 600 °C (d) and of the Cr coating annealed at 100 °C (e).
annealing temperature for samples annealed up to 200 °C (Figure 8a and 8b) in comparison with that observed for the as-electrodeposited Ni-13Mo coatings (Figure 2a-2d). Cracks were observed on the Ni-13Mo coating annealed at 400 °C and crystals can be seen for the sample annealed at 600 °C which corresponding to phase that precipitated at this temperature. Cracks are also seen for as-annealed Cr coatings, even when heat treated at 100 °C. The presence of these cracks in the as-annealed samples is caused by residual stress due to the stress relief during the annealing process.
Conclusion
the Ni-Mo coatings in chloride medium and the all the studied coatings corrode in chloride medium. The Ni-13Mo coating is the nobler among the studied Ni-Mo coatings. The microhardness of the Ni-Mo coatings increased as the annealing temperature increased which is related with the precipitation of Ni, Ni4Mo and NiMo phases were during heat treatment of the Ni-13Mo coating. Ni-13Mo coating is a potential substitute for chromium coating in industrial applications when operating at temperatures higher than 100 °C and good microhardness properties are required.
Acknowledgments
The authors thank to Conselho Nacional de Desenvolvimento Cientíico e Tecnológico (CNPq) and Coordenadoria de Aperfeiçoamento de Pessoal de Nível Superior (CAPES), Brazil, for inancial assistance.
References
1. Brooman, E. W.; Metal Finish.2000, 98:7, 38 and references
cited therein.
2. Brooman, E. W.; Metal Finish.2000, 98:8, 39 and references
cited therein.
3. Podlaha, E. J.; Landolt, L.; J. Electrochem. Soc.1996, 143, 885.
4. Podlaha, E. J.; Matiosz, M.; Landolt, L.; J. Electrochem. Soc.
1996,143, 893.
5. Pavlov, M. P.; Morozova, N. V.; Kudryavtsev, V. N.; Prot. Met.
2007, 43, 459.
6. Kuznetsov, V. V.; Pavlov, M. R.; Zimakov, D. I.; Chepeleva, S. A.; Kudryavtsev, V. N.; Russ. J. Electrochem.2004, 40, 813.
7. Kuznetsov, V. V.; Pavlov, M. R.; Chepeleva, S. A.; Kudryavtsev, V. N.; Russ. J. Electrochem.2005, 41, 83.
8. Yagi, S.; Kawakami, A.; Murase, K.; Awakura, Y.; Electrochim. Acta2007, 52, 6041.
9. Marlot, A.; Kern P.; Landolt, D.; Electrochim. Acta2002, 48,
29.
10. Donten, M.; Cesiulis, H.; Stojek, Z.; Electrochim. Acta2005,
50, 1405.
11. Chassaing, E.; Portail, N.; Levy, A. F.; Wang, G.; J. Appl. Electrochem.2004, 34, 1085.
12. Sanches, L. S.; Domingues, S. H.; Marino, C. E. B.; Mascaro, L. H.; Electrochem. Comum.2004, 6, 543.
13. Sanches, L. S.; Domingues, S. H.; Marino, C. E. B.; Mascaro, L. H.; J. Braz. Chem. Soc.2003, 14, 556.
14. Dubpernell, G. In Modern Electroplating; Lowenheim, F. A.,
ed.; 3rd ed., Wiley-Interscience Publication: New York, 1974. 15. Yun, H. J.; Dulal, S. M. S. I.; Shin, C. B.; Kim, C. K.;
Electrochim. Acta2008, 54, 370.
16. de Lima-Neto, P.; da Silva, G. P.; Correia, A. N.; Electrochim. Acta2006, 51, 4928.
17. de Lima-Neto, P.; Correia, A. N.; da Silva, G. P.; J. Braz. Chem. Soc.2006, 17, 1419.
18. Sriramam, K. R.; Raman, S. G. S.; Seshadri, S. K.; Mater. Sci. Eng., A2006, 418, 303.
19. He, F.; Yang, J.; Lei, T.; Gu, C.; Appl. Surf. Sci.2007, 253, 7591.