Ar
ti
cle
0103 - 5053 $6.00+0.00
*e-mail: [email protected]
Direct Determination of Lanthanides in Environmental Samples using Ultrasonic
Nebulization and ICP OES
Fabrina R. S. Bentlin and Dirce Pozebon*
Instituto de Química, Universidade Federal do Rio Grande do Sul, Av. Bento Gonçalves, 9500, 91501-970 Porto Alegre-RS, Brazil
Baixas concentrações dos catorze elementos de ocorrência natural da série lantanídeos foram diretamente determinadas por espectrometria de emissão óptica com plasma indutivamente acoplado (ICP OES). Avaliaram-se interferências espectrais e linhas espectrais mais adequadas foram selecionadas. Os desempenhos da nebulização pneumática e ultra-sônica foram comparados com respeito aos limites de detecção, para ambas as posições de observação do plasma, radial e axial. A inluência da potência de radiofrequência sobre a precisão e exatidão foi também investigada para os dois tipos de nebulizadores. O método foi aplicado à determinação dos lantanídeos em amostras ambientais (sedimentos, cinza de carvão e água luvial). Este trabalho demonstrou que é possível a determinação direta de baixas concentrações (i.e. ng g-1 e ng L-1) dos lantanídeos de
ocorrência natural por ICP OES.
Low concentrations of the fourteen naturally occurring lanthanides were directly determined by inductively coupled plasma optical emission spectrometry (ICP OES). Spectral interferences were evaluated and the most appropriate spectral lines selected. Pneumatic and ultrasonic nebulization performances were compared with respect to limits of detection for both radial and axial viewed plasma. The inluence of plasma applied power on precision and accuracy was studied for both nebulizers. The developed method was applied to lanthanides determination in environmental samples (sediments, coal ly ash and river water). This work demonstrates that the use of ultrasonic nebulization combined with axially viewed plasma allowed direct determination of low concentrations (at ng g-1 and ng L-1 levels) of all naturally occurring lanthanides by ICP OES.
Keywords: lanthanides, ICP OES, ultrasonic nebulization, pneumatic nebulization, environmental samples
Introduction
The elements of the lanthanides series, ranging from lanthanum to lutetium comprises ithteen homologous trivalent metals, of which fourteen commonly occur in nature. Promethium does not occur naturally. Lanthanides mobilization from their natural sources has increased in the last decades. Because of their diversiied physical and chemical properties, the lanthanides elements have been widely used in a number of ields (e.g., in microelectronics and optics, in material science or in nuclear reactors, in biomolecular research or in medical diagnostics).1-3 The
lanthanides are also often used in fertilizers4 or as feeding
markers in nutritional and agronomic studies.4-6 These
elements have also been used as ingerprint markers for
cement and concrete7 and in geological8 or palenteology
studies.9
Uses and applications of lanthanides are still increasing and so are the associated emissions to the environment. In recent years, lanthanides-rich fertilizers have being widely used in China to enhance yield and improve crop quality. It is reported that application of these fertilizers not only increases the yield but also brings many visual beneits to plants including darker green foliage, enhanced development rate, greater production of roots, as well as better fruit color.10 It is expected that agricultural usage of
lanthanides will grow.
It has already been observed that Ce, Pr and Lu can accumulate in liver affecting cell physiology. These effects appeared to result from the similarity of lanthanides cationic radii to the size of Ca2+ ions. Trivalent lanthanide ions,
in human and animal cells and also affect numerous enzymes.11,12 Furthermore,the biological effects of the
lanthanides in living organisms, based on their similarity to calcium, have stimulated researches into their therapeutic application.13 Therefore, lanthanides determination in
environment samples is of increasing importance due to the accelerated input by anthropogenic activities and possible contamination.
The lanthanides elements are chemically and physically similar, have complex absorption and emission spectra, and are generally present in low concentration in environmental samples. Therefore, multi-element determination of all naturally occurring lanthanides is usually troublesome. Inductively coupled plasma optical emission spectrometry (ICP OES) and inductively coupled plasma mass spectrometry (ICP-MS) are very feasible techniques for quantitative determination of the lanthanides. The most important advantages of these techniques are high sample throughput, simplicity and good sensitivity, in comparison to other techniques14,15 used for lanthanides determination.
Matrix separation/analyte pre-concentration has been used until now in the determination of lanthanides by ICP OES in order to overcome spectral interferences and/or improve the limits of detection (LODs).16-21 Navarro et al.20 determined lanthanides in geological materials, but
matrix separation was performed in cationic exchange column prior analyte determination by ICP OES, and ultrasonic nebulization was used for introducing the sample solution in the plasma. In another work,21 nine lanthanides
elements were determined in silicate rocks using ultrasonic nebulization and ICP OES; online ion-exchange was used for iron separation prior to analyte determination.
The ICP-MS technique due to its higher sensitivity and lower spectral interferences seems more appropriate than ICP OES for determination of lanthanides at trace levels. However, the determination may be dificult due to isobaric interferences, particularly oxides and hydroxides.22
Consequently, special nebulizers may be necessary for sample introduction into the plasma. Nowadays, due to the higher sensitivity achieved with axially viewed plasma and better spectral resolution given by high-resolution monochromators, it is expected that low concentrations of all naturally occurring lanthanides may be directly quantiied by ICP OES. Furthermore, depending on the nebulizer used to introduce the sample solution in the plasma, sensitivity improves. By using ultrasonic nebulizer or pneumatic nebulizer coupled to a dessolvator system the amount of solvent entering the plasma can be drastically reduced and sensitivity improved.23-25 However, the
occurrence of spectral interferences needs to be rigorously controlled in order to achieve precise and accurate results.
Moreover, the reagents used in the decomposition of the sample must be evaluated, since the lanthanides precipitated in presence of HF,26 which is commonly used to decompose
environmental samples.
The aim of the present study was to develop a method for the determination of all naturally occurring lanthanides in environmental samples by using ICP OES, without matrix separation. The objectives set include (i) inding out appropriate spectral lines, (ii) develop a procedure for sample preparation and (iii) select a feasible nebulizer for introducing the sample solution into the plasma.
Material and Methods
Instrumentation
All determinations were performed using an OptimaTM
2000 DV ICP OES sequential spectrometer (Perkin-Elmer, Shelton, CT, USA). An ultrasonic nebulizer (US-5000 AT+ from CETAC, Omaha, NE, USA), pneumatic nebulizer (MicroMist MCN-600 from Glass Expansion, Pocasset, MA, USA) attached to a Cinnabar cyclonic spray chamber (from Glass Expansion) and a 2-mm injector tube made of alumina were used for introducing the sample solution into the plasma. The heating and cooling temperatures of the ultrasonic nebulizer were 140 and − 4 °C, respectively. In order to avoid any carry-over effect, the ultrasonic nebulizer was washed out with 1% (v/v) HNO3 for 60 s between each sample run. The instrumental parameters are shown in Table 1. The following spectral lines (wavelength in nm) were monitored: La-392.852, 408.672, 379.478, 333.749, 379.083, 403.169, 407.733, 384.902; Ce-418.660, 413.380, 394.724, 456.236; Pr-390.844, 414.311, 422.293; Nd-406.109, 401.225, 430.358, 424.738, 384.824; Sm-359.260, 442.434, 360.949, 388.529, 428.079; Eu-381.967, 412.97, 393.048; Gd-342.247, 336.223, 335.047, 376.839; Tb-350.917, 384.873, 367.635; Dy-353.170, 364.540, 394.468, 407.796; Ho-339.898, 347.426, 345.600; Er-337.271, 369.265, 349.910; Tm-384.802, 346.220, 313.126, 336.261, 324.154; Yb-328.937, 369.419; Lu-261.542 and 291.139. All emission lines monitored are ionic (II). For Eu determination in the Tibet sediment by ICP-MS, an ELAN DRC II instrument (from PerkinElmer/SCIEX) was employed. Ultrasonic nebulization was used for introducing the sample solution into the plasma.
Standards and reagents
obtained from a Milli-Q system (Millipore, Bedford, MA, USA). Calibration solutions were prepared from serial dilutions of mono-element standard solutions from Merck. The calibration was performed with a multi-element mixed solution in 5% (v/v) HNO3. The concentrations of the calibration solutions ranged from 1.0 to 25 µg L-1, depending on the lanthanide element,
nebulizer type and plasma view. Each calibration curve was obtained by using at least ive calibration solutions with different concentrations.
Samples and sample preparation
Coal ly ash (SRM 1633b, from the National Institute of Standards and Technology – NIST, Gaithersburg, MD, USA) was used for method development. River sediment (BCR 320, from the Community Bureau of Reference, Geel, Belgium), Tibet sediment (NCS DC70319) and river water were further analyzed. The water sample was taken from Guaíba River (Porto Alegre, RS, Brazil). This river receives water from other rivers that crosses large agricultural areas where a number of different plantations are grown. The water sample was collected by using a decontaminated polyethylene lask, which was subsequently carried to the laboratory where the sample was iltered (a quantitative Whatman ilter paper for fast iltration was used) and acidiied up to 5% (v/v) HNO3. Two different procedures were used for the coal ly ash and sediments samples decomposition: (A) three 150 mg aliquots of sample were transferred to PTFE pumps to which 7 mL of HNO3, 2 mL of HF and 2 mL of H2O2, all them concentrated, were added and the mixture let standing for 60 min. After closing with screw caps, the pumps containing the mixture were heated in a metallic block (TE 0070 Tecnal, Piracicaba, SP, Brazil) for a period of 6 h at 200 oC. After cooling to room temperature, 4 mL of 20%
(m/v) H3BO3 were added and the mixture heated again for 90 min at 160 oC. Afterwards, the heating was turned off
and the solution let standing to achieve room temperature. Then, the lask was opened and the digest was transferred to a graduated lask made of polypropylene. The volume was made up to 50 mL. For recovery tests, aliquots of the analyte solution were added to the sample (in triplicate) before its decomposition, with replicates of the sample without addition of the analyte; (B) 200 mg aliquots of sample were transferred to Pt crucibles followed by the addition of 2 mL of concentrated HNO3. The crucibles were placed on a hot plate and heated in order to evaporate the acid. After, a volume of 2 mL of concentrated HF was added and also evaporated. Subsequently, 1 g of Na2B4O7•7H
2O
(from Merck) was added and the crucibles were placed in a mufle furnace. The temperature of the furnace was increased up to 1,100 ºC and kept for 1 h. After cooling to
room temperature, a transparent melt was observed, which was dissolved by immersion of the crucible in 10% (v/v) HCl solution under heating (about90 oC). Once the melt
was dissolved, the crucible was removed from the sample solution. Then, this solution was evaporated to about 10 mL and transferred to a polyethylene lask containing 1 mL of concentrated HNO3 and the volume made up to 50 mL with water. This solution was ten-fold diluted with water before introduction into the plasma using an ultrasonic nebulizer.
Results and Discussion
Method development
Investigations were made with respect to possible spectral interferences and sensitivity, using mono or multi-element solutions with all lanthanides in the same solution and at the same concentration (2.0 µg L-1 and 20 µg L-1
for ultrasonic and pneumatic nebulizer, respectively). The signals of the analytes were measured by using both radially and axially viewed plasma, and at least two spectral lines
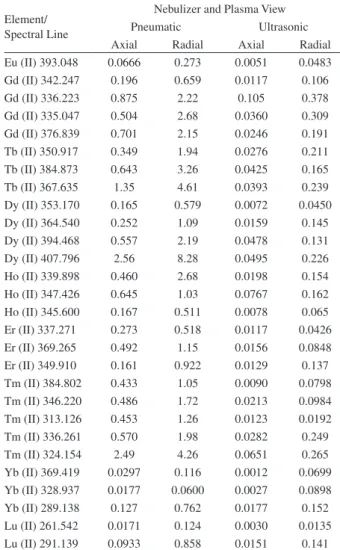
per element were monitored. Limits of detection, LODs, for all investigated spectral lines are show in Table S1 (see Supplementary Information). The spectral lines shown in Table 2 were selected because no spectral interferences between the lanthanides were observed and/or the better LODs obtained.
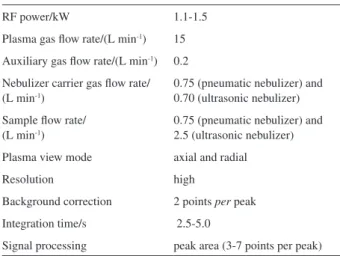
It was further observed that Pr 414.311 nm, Sm 360.949 nm and Gd 335.047 nm should be used (instead of Pr 390.844 nm, Sm 359.260 nm and Gd 342.247 nm) for Pr, Sm and Gd determination in coal ly ash, in order to obtain accurate results. The lanthanides may interfere with each other27,28 and Dy (spectral lines at 390.840, 359.316 Table 1. ICP OES: Operational conditions and instrumental parameters
RF power/kW 1.1-1.5
Plasma gas low rate/(L min-1) 15
Auxiliary gas low rate/(L min-1) 0.2
Nebulizer carrier gas low rate/ (L min-1)
0.75 (pneumatic nebulizer) and 0.70 (ultrasonic nebulizer) Sample low rate/
(L min-1)
0.75 (pneumatic nebulizer) and 2.5 (ultrasonic nebulizer) Plasma view mode axial and radial
Resolution high
Background correction 2 points per peak Integration time/s 2.5-5.0
and 342.239 nm)27 may interfere on Pr, Sm and Gd,
which depends on the concentrations of these elements in the sample. A more sensitive spectral line of Tb (at 350.917 nm) could not be used due to Pr interference (Pr 350.918 nm),28 and this was observed for the Tibet
sediment sample.
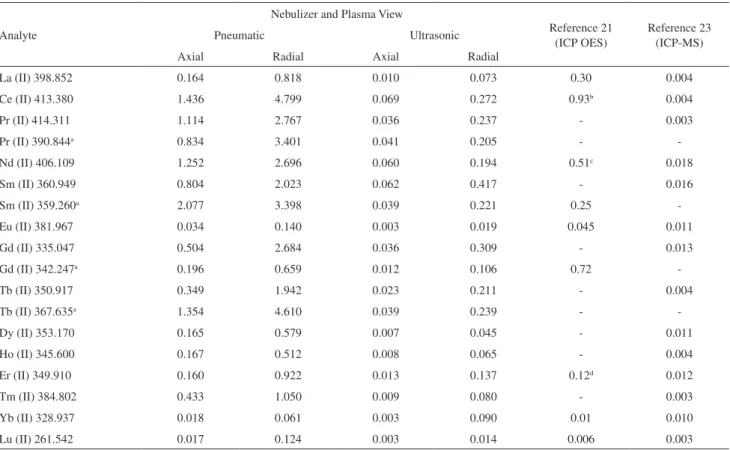
The LOD for each spectral line was obtained from b + 3s where b is the mean concentration of 10 consecutive measurements of the blank (5% v/v HNO3) and s is the standard deviation. As expected, the lowest LODs were obtained by using ultrasonic nebulization and axially viewed plasma (Table 3). The best LODs obtained with ultrasonic nebulization are mainly due to the greater aerosol output of the ultrasonic nebulizer (the sample uptake rate and aerosol transportation to the plasma are higher than those of the MicroMist nebulizer). The LODs found using ultrasonic nebulization and axially viewed plasma are lower than those reported for La, Ce, Nd, Sm, Eu, Er and Yb, measured using ultrasonic nebulization, ICP OES and matrix removal.21 For comparison purposes, the LODs
obtained using ICP-MS and pneumatic nebulization23 are
also shown in Table 2. It can be seen in this table that LODs found using ultrasonic nebulization and axially viewed plasma are in general only one order of magnitude higher, or less, than those found by ICP-MS.
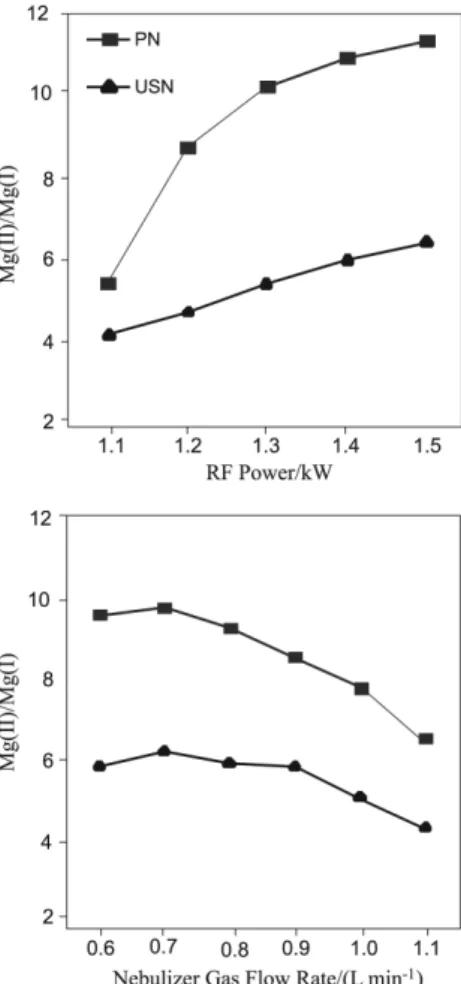
The nebulizer gas low rate in pneumatic nebulization and plasma power can have a major effect on the formation of oxides of lanthanides, as well as in emission intensity and plasma robustness. Robust conditions of the plasma have been associated to high applied power by radiofrequency generator, low carrier gas low rate and large diameter of the injector.29,30 For robustness quantiication, the ratio of the
emission intensities of two magnesium lines (atomic and ionic transition) has been used. The plasma has been considered robust if the ratio Mg(II) 280.271 nm/Mg(I) 285.213 nm is 10 or greater. In the present work, the plasma robustness was evaluated for both the pneumatic and ultrasonic nebulizers (Figure 1). For the pneumatic nebulizer, the plasma can be considered robust when the RF power ranged from 1.3 to 1.5 kW, and the nebulizer gas low rate from 0.6 to about 0.8 mL min-1. The results found (Figure 1) are in agreement
with previous reported data.29,30 However, the plasma cannot
be considered robust when ultrasonic nebulization was used. According to reported results,31 the Mg(II)/Mg(I) ratio was
lower than 5 when solutions of digested plants were introduced into the plasma by means of ultrasonic nebulization. In another work,32 the Mg(II)/Mg(I) ratio found was about 7 in the
absence of matrix. The degradation in the Mg(II)/Mg(I) ratio in matrix solutions can be caused by higher matrix loading in the plasma, lowering the plasma robustness.31
Table 2. Selected spectral lines of the lanthanides and respective ICP OES limits of detection (in µg L-1) as a function of the nebulizer and plasma view
Analyte
Nebulizer and Plasma View
Reference 21 (ICP OES)
Reference 23 (ICP-MS)
Pneumatic Ultrasonic
Axial Radial Axial Radial
La (II) 398.852 0.164 0.818 0.010 0.073 0.30 0.004
Ce (II) 413.380 1.436 4.799 0.069 0.272 0.93b 0.004
Pr (II) 414.311 1.114 2.767 0.036 0.237 - 0.003
Pr (II) 390.844a 0.834 3.401 0.041 0.205 -
-Nd (II) 406.109 1.252 2.696 0.060 0.194 0.51c 0.018
Sm (II) 360.949 0.804 2.023 0.062 0.417 - 0.016
Sm (II) 359.260a 2.077 3.398 0.039 0.221 0.25
-Eu (II) 381.967 0.034 0.140 0.003 0.019 0.045 0.011
Gd (II) 335.047 0.504 2.684 0.036 0.309 - 0.013
Gd (II) 342.247a 0.196 0.659 0.012 0.106 0.72
-Tb (II) 350.917 0.349 1.942 0.023 0.211 - 0.004
Tb (II) 367.635a 1.354 4.610 0.039 0.239 -
-Dy (II) 353.170 0.165 0.579 0.007 0.045 - 0.011
Ho (II) 345.600 0.167 0.512 0.008 0.065 - 0.004
Er (II) 349.910 0.160 0.922 0.013 0.137 0.12d 0.012
Tm (II) 384.802 0.433 1.050 0.009 0.080 - 0.003
Yb (II) 328.937 0.018 0.061 0.003 0.090 0.01 0.010
Lu (II) 261.542 0.017 0.124 0.003 0.014 0.006 0.003
It had been observed23 that the signals of the lanthanides
elements measured by ICP-MS remained almost the same while the oxides formation rate was reduced when a MicroMist nebulizer and carrier gas low rate between 0.75 and 0.95 L min– 1 were used. In this work, the nebulizer gas
low rate was varied in the range of 0.60 to 0.80 L min-1
and the maximum signal was observed at 0.75 L min-1. This
condition was then established for further measurements by using this nebulizer. According to Figure 1, the Mg(II)/ Mg(I) ratio is close to 10 when the nebulizer gas low rate is 0.75, which means the plasma is still robust.
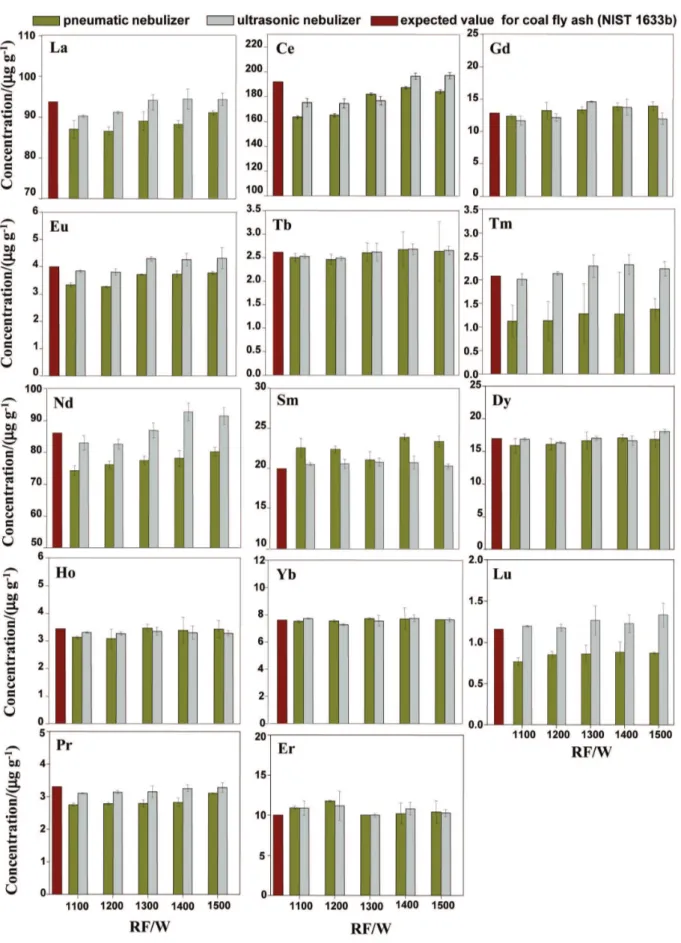
The performance of the ultrasonic and pneumatic nebulizers as a function of plasma applied power is shown in Figure 2 for coal ly ash.
Figure 2 shows that precision and accuracy were better for most elements when ultrasonic nebulization was used for introducing the sample solution into the plasma. In this case, the RF power can be set at 1.3 kW for La, Tb, Nd, Dy, Ho, Yb Pr and Er; 1.4 kW for Ce, Gd and
Sm; and 1.2 kW for Tm and Lu. These conditions were established for further experiments. Taking into account pneumatic nebulization, RF applied power can be 1.4 kW for Ce and Gd, and 1.3 kW for Eu, Tb, Sm, Dy, Ho, Yb and Er. It is observed the concentrations of Tm, Nd, Lu, Pr, Eu, La and Ce found are lower than the expected values at any RF applied power tested using the pneumatic nebulizer. The best performance observed for ultrasonic nebulizer can be explained by the quality of the produced aerosol. Signiicant amounts of the aerosol droplets are distributed over at least one order of magnitude, whereas the diameter of 90% of droplets is greater than 4 µm and lower than 30 µm.33 Although the ultrasonic nebulizer
generates aerosols with signiicantly broader particle size distributions than concentric pneumatic nebulizer, the ultrasonic nebulizer produces an aerosol of much greater particles density than the pneumatic nebulizer.33 The
higher aerosol density ultimately results in the production of many more appropriately sized droplets than found with pneumatic nebulizer, making the conversion to atomic and ionic species easier.33 Furthermore, aerosol
desolvation minimizes the oxide formation rate23 and
improves the plasma characteristics.32 Therefore, despite
the larger sample consumption, ultrasonic nebulization is advantageous for lanthanides determination by ICP OES in comparison to the conventional pneumatic nebulization. As a result of the better results obtained, the ultrasonic nebulizer was used for lanthanides determination in environmental samples.
Sample analysis
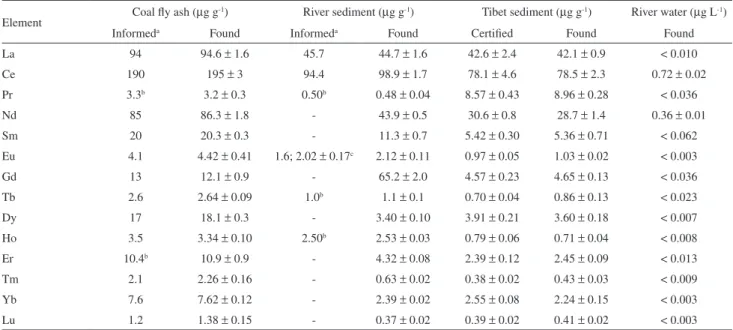
The applicability of the method was evaluated for river water, coal fly ash and sediment samples. The concentrations found are shown in Table 3 and they are in agreement with those reported in the certiicate or obtained for spiked samples, except for Eu in river sediment. Since the informed concentration is different of that found, Eu was also determined in this sample by ICP-MS with an ultrasonic nebulizer. According to Table 3, the Eu concentration determined by ICP-MS agrees with that found by ICP OES.
Most lanthanides were not detected in river water, which shows that contamination by those elements fortunately is still low. It was observed that both procedures investigated for sample decomposition can be used. However, the sample solution obtained by fusion needs to be more diluted to reduce matrix interferences caused by the fusion agent in the plasma and also prevent clogging of the MicroMist nebulizer. Therefore, the procedure (A) (acid decomposition) is recommended because it is faster
Figure 1. Effect of RF applied power and nebulizer gas low rate on Mg(II)/Mg(I) intensities ratio for pneumatic (PN) and ultrasonic (US) nebulizers. For the RF study the nebulizer gas low rate was kept in 0.75 L min-1, whereas the RF was kept in 1.5 kW for the nebulizer gas
Figure 2. Inluence of plasma applied power on precision and accuracy; sample low rate: 0.75 and 2.5 mL min-1 for pneumatic and ultrasonic nebulizers,
and easier to carry out than the procedure (B) (alkaline fusion). It is important to mention that the H3BO3 addition not only dissolves the precipitated-lanthanides luorides,26
but also neutralize the HF, avoiding damage of the sample introduction system and quartz torch.
Conclusions
This study demonstrated the applicability of the ICP OES technique for direct determination of low concentrations of lanthanides in environmental samples. By monitoring the most sensitive spectral lines when possible, using ultrasonic nebulizer and plasma with axial view of observation, concentration at ng g-1 or ng L-1
levels can be accurately determined. Both accuracy and precision were improved when using ultrasonic nebulizer in comparison to conventional pneumatic nebulizer. Siliceous samples can be decomposed eficiently with HNO3, HF and H2O2 and conventional heating in PTFE closed vessels for the determination of lanthanides by ICP OES, but the addition of H3BO3 is necessary to obtain accurate results.
Supplementary Information
Supplementary data (limits of detection for all investigated spectral lines are shown inTable S1) and are available free of charge at http://jbcs.sbq.org.br, as PDF ile.
Acknowledgment
Fabrina R. S. Bentlin would like to thank CAPES (Coordenação de Aperfeiçoamento de Pessoal de Nivel Superior) for the scholarship.
References
1. Rao, T. P.; Biju, V. M.; Crit. Rev. Anal. Chem.2000, 30, 179. 2. Ornatsky, O. I.; Kinach, R.; Bandura D. R.; Lou, X.; Tanner,
S.; Baranov, V.; Nitz, M.; Winnik, M. A.; J. Anal. At. Spectrom. 2008, 23, 463.
3. Jakubowski, N.; Waentig, L.; Hayen, H.; Venkatachalam, A.; Von Bohlen, A.; Roos, P. H.; Manz, A.; J. Anal. At. Spectrom.
2008, 23, 1497.
4. Miaokang, S.; Yinyu, S.; J. AOAC Int. 1992, 75, 667. 5. Combs; D. K.; Satter, L. D.; J. Dairy Sci. 1992, 75, 2176. 6. Wang, Z.; Li, D.; Lu, P.; Wang, C.; J. Environ. Qual.2001, 30,
37.
7. Coguel, R. L.; St. John, D. A.; Cem. Concr. Res. 1993, 23, 59. 8. Worrall, F.; Pearson, D.G.; Appl. Geochem. 2001, 16,
1465.
9. MacFadden, B.J.; Labs-Hochstein, J.; Hulbert, R.C.; Baskin, J.A.; Geology 2007, 35, 123.
10. Zhang, S.; Shan, X.; Environ. Pollut. 2001, 112, 395. 11. Palasz, A.; Czekaj, P.; Acta Biochim. Pol.2000, 47, 4. 12. Lennart, W.; Lars, R.C.W.; Verhoof, V.W.; Timo, H.; Environ.
Sci. Technol. 2004, 24. 6597.
13. Fricker, S. P.; Chem. Soc. Rev. 2006, 35, 524.
Table 3. Lanthanides concentration found in certiied reference materials by using ultrasonic nebulizer and axially viewed plasma; uncertainties are the standard deviations for three samples replicates (n = 3). The spectral lines shown in Table 2 were monitored. The coal ly ash and sediment were acid decomposed according to procedure (A)
Element Coal ly ash (µg g
-1) River sediment (µg g-1) Tibet sediment (µg g-1) River water (µg L-1)
Informeda Found Informeda Found Certiied Found Found
La 94 94.6 ± 1.6 45.7 44.7 ± 1.6 42.6 ± 2.4 42.1 ± 0.9 < 0.010
Ce 190 195 ± 3 94.4 98.9 ± 1.7 78.1 ± 4.6 78.5 ± 2.3 0.72 ± 0.02
Pr 3.3b 3.2 ± 0.3 0.50b 0.48 ± 0.04 8.57 ± 0.43 8.96 ± 0.28 < 0.036
Nd 85 86.3 ± 1.8 - 43.9 ± 0.5 30.6 ± 0.8 28.7 ± 1.4 0.36 ± 0.01
Sm 20 20.3 ± 0.3 - 11.3 ± 0.7 5.42 ± 0.30 5.36 ± 0.71 < 0.062
Eu 4.1 4.42 ± 0.41 1.6; 2.02 ± 0.17c 2.12 ± 0.11 0.97 ± 0.05 1.03 ± 0.02 < 0.003
Gd 13 12.1 ± 0.9 - 65.2 ± 2.0 4.57 ± 0.23 4.65 ± 0.13 < 0.036
Tb 2.6 2.64 ± 0.09 1.0b 1.1 ± 0.1 0.70 ± 0.04 0.86 ± 0.13 < 0.023
Dy 17 18.1 ± 0.3 - 3.40 ± 0.10 3.91 ± 0.21 3.60 ± 0.18 < 0.007
Ho 3.5 3.34 ± 0.10 2.50b 2.53 ± 0.03 0.79 ± 0.06 0.71 ± 0.04 < 0.008
Er 10.4b 10.9 ± 0.9 - 4.32 ± 0.08 2.39 ± 0.12 2.45 ± 0.09 < 0.013
Tm 2.1 2.26 ± 0.16 - 0.63 ± 0.02 0.38 ± 0.02 0.43 ± 0.03 < 0.009
Yb 7.6 7.62 ± 0.12 - 2.39 ± 0.02 2.55 ± 0.08 2.24 ± 0.15 < 0.003
Lu 1.2 1.38 ± 0.15 - 0.37 ± 0.02 0.39 ± 0.02 0.41 ± 0.02 < 0.003
14. Danko, B.; Dybczyński, R. S.; SamczyńskiZ.; J. Radioanal. Nucl. Chem. 2008, 27, 81.
15. Donati, G.L.; Gu, J.; Nóbrega, J.A.; Calloway, C.P.; Jones, B.T.;
J. Anal. At. Spectrom. 2008, 23, 361.
16. Gásquez, J.A.; De Lima, E.; Roberto, A.; Martinez, O.L.D.; De La Guardia, M.; Talanta2005, 67, 824.
17. Premadas, A.; Khorge, C.R.; At. Spectrosc. 2006, 27, 170. 18. Sileiman, J. S.; Huang, C.Z.; Pu, X.L.; Zhang, N.; Hu, B.;
At. Spectrosc. 2006, 27, 200.
19. Kulkarni, P.; Chellam, S.; Fraser, M. P.; Atmos. Environ.2006,
40, 508.
20. Navarro, M. S.; Ulbrich, H. H. G. J.; Andrade, S.; Janasi, V. A.;
J. Alloys Compd. 2002, 344, 40.
21. Lara, R.; Olsina, R. A.; Marchevsky, E.; Gásquez, J. A.; Martinez, L. D.; At. Spectrosc. 2000, 21, 172.
22. Longerich, H. P.; Fryer, B.J.; Strong, D. F.; Kantipuly, C.J.;
Spectrochim. Acta, Part B1987, 42, 75.
23. Dresssler, V.L.; Pozebon, D.; Matusch, A.; Becker, J.S.; Int. J. Mass Spectrom. 2007, 266, 25.
24. D’Ilio, S.; Violante, N.; Caime, S.; Gregório, D.; Petrucci, F.; Senofonte O.; Anal. Chim. Acta 2006, 432, 573.
25. Fragnière, C.; Haldimann, M.; Eastgate, A.; Krähenbühl, U.;
J. Anal. At. Spectrom. 2005, 20, 626.
26. Paulenova, A.; Yu, M.; Alyapyshev, V.; Babain, A.; Herbst, R. S.; Law, J. D.; Sep. Sci. Technol. 2008, 42, 439.
27. Kolibarska, I.; Velichkov, S.; Daskalova, N.; Spectrochim. Acta, Part B2008, 63, 603.
28. Sulcek, Z.; Rubeska, I.; Sixta, V.; Paukert, T.; At. Spectrosc.
1989, 10, 4.
29. Tognoni, E.; Hidalgo, M.; Canals, A.; Cristoforetti, G.; Legnaioli, S.; Salvetti, A.; Palleschi, V.; Spectrochim. Acta, Part B2007, 62, 435.
30. Trevisan, L. C.; Vieira, E. C.; Nogueira, A. R. A.; Nóbrega, J. A.; Spectrochim. Acta, Part B2005, 60, 575.
31. Borkowska-Burnecka, J.; Leśniewicz, A.; Żyrnicki, W.;
Spectrochim. Acta, Part B2006, 61, 579.
32. Grotti, M.; Cristina Lagomarsino, C.; Mermet, J.M.; J. Anal. At. Spectrom. 2006, 21, 963.
33. Tarr, M. A.; Zhu, G.; Browner, R. F.; Appl. Spectrosc.1991, 45, 1424.
Su
pp
le
m
enta
ry
Inf
or
m
ati
on
0103 - 5053 $6.00+0.00
*e-mail: [email protected]
Direct Determination of Lanthanides in Environmental Samples using Ultrasonic
Nebulization and ICP OES
Fabrina R. S. Bentlin and Dirce Pozebon*
Instituto de Química, Universidade Federal do Rio Grande do Sul, Av. Bento Gonçalves, 9500, 91501-970 Porto Alegre - RS, Brazil
Element/ Spectral Line
Nebulizer and Plasma View Pneumatic Ultrasonic Axial Radial Axial Radial La (II) 398.852 0.164 0.818 0.0096 0.0726 La (II) 408.672 0.442 1.00 0.0183 0.103 La (II) 379.478 0.304 0.886 0.0129 0.0921 La (II) 333.749 0.204 0.899 0.0267 0.358 La (II) 379.083 0.214 1.45 0.0105 0.0849 La (II) 403.169 0.482 1.34 0.0185 0.0753 La (II) 407.733 0.368 0.842 0.0153 0.150 La (II) 384.902 0.533 1.90 0.250 0.259 Ce (II) 413.764 2.12 4.98 0.244 0.691 Ce (II) 418.660 2.32 7.48 0.0996 0.229 Ce (II) 413.380 1.44 4.80 0.0693 0.272 Ce (II) 394.274 4.98 9.52 0.127 0.529 Ce (II) 456.236 2.41 4.11 0.0756 0.577 Pr (II) 390.844 0.834 3.40 0.0408 0.206 Pr (II) 414.311 1.11 2.77 0.0357 0.237 Pr (II) 422.293 2.08 3.31 0.0204 0.247 Nd (II) 406.109 1.25 2.70 0.0594 0.193 Nd (II) 401.225 1.62 7.76 0.0474 0.203 Nd (II) 430.358 2.46 4.91 0.0492 0.283 Nd (II) 424.738 6.41 7.22 0.0469 0.304 Nd (II) 384.824 7.16 18.0 0.123 0.709 Sm (II) 359.260 2.08 3.40 0.0387 0.221 Sm (II) 442.434 3.54 11.6 0.215 0.124 Sm (II) 360.949 0.804 2.02 0.0615 0.417 Sm (II) 388.529 1.08 3.48 0.0906 0.388 Sm (II) 428.079 1.63 6.97 0.0909 0.338 Eu (II) 381.967 0.0342 0.140 0.0027 0.019 Eu (II) 412.970 0.0642 0.187 0.0030 0.0210
Table S1. Spectral lines of the lanthanides elements and respective ICP OES limits of detection values (in µg L-1) as a function of the nebulizer and plasma view
Element/ Spectral Line