Ar
ti
cl
e
0103 - 5053 $6.00+0.00
*e-mail: [email protected]
#INCT de Energia e Ambiente inanced by CNPq, www.inct.cienam.ufba.br
Calibration Techniques and Modiiers for the Determination of Cd, Pb and Tl in
Biodiesel as Microemulsion by Graphite Furnace Atomic Absorption Spectrometry
Jessee S. Azevedo Silva,*,a,b Eduardo S. Chaves,#,b Éder J. dos Santos,c
Tatiana D. Saint’Pierre,d Vera Lúcia A. Frescurab and Adilson J. Curtius#,b
aInstituto Federal de Educação, Ciência e Tecnologia de Santa Catarina,
88047-240 Florianópolis-SC, Brazil
bUniversidade Federal de Santa Catarina, Departamento de Química, Campus Trindade,
88040-900 Florianópolis-SC, Brazil
cInstituto de Tecnologia do Paraná, TECPAR, 81350-010 Curitiba-PR, Brazil
dDepartamento de Química, Pontifícia Universidade Católica do Rio de Janeiro,
22453-900 Rio de Janeiro-RJ, Brazil
Diferentes calibrações e modiicadores foram testados para a determinação de Cd, Pb e Tl em biodiesel por espectrometria de absorção atômica em forno de graite (GF AAS). Foram preparadas microemulsões usando-se 2 g de biodiesel, 1 mL de solução aquosa de ácido nítrico 10% (v/v) e n-propanol até o volume inal de 10 mL. As temperaturas de pirólise foram: 600 °C para Cd e Tl com Pd como modiicador permanente e 800 °C para Pb com Ru como modiicador permanente. As temperaturas de atomização também foram otimizadas. A calibração aquosa não corrigiu as interferências não espectrais, mas a calibração com simulação de matriz produziu resultados exatos com recuperações entre 80 e 116%. Os valores de RSD foram menores do que
8% para e Cd e Pb com valores de LOD de 0,5 ng g-1 para Cd, 6 ng g-1 para Pb e 1 ng g-1 para Tl.
Os resultados obtidos usando-se calibração pelo método de adições de analito e por simulação de matriz foram concordantes. Padrões organometálicos não foram necessários. Diferentes amostras de biodiesel foram analisadas.
Different calibration approaches and modiiers were tested for Cd, Pb and Tl determination in biodiesel by graphite furnace atomic absorption spectrometry (GF AAS). Microemulsions were prepared by mixing 2 g of biodiesel, 1 mL of a 10% (v/v) nitric acid aqueous solution and n-propanol to a 10 mL inal volume. Pyrolysis temperatures of 600 °C for Cd and Tl with Pd as permanent modiier, and 800 °C for Pb with Ru as permanent modiier were used. Atomization temperatures were also optimized. Calibration solution prepared in aqueous medium did not correct non-spectral interferences, but matrix matching calibration using base oil led to accurate results with recoveries from 80 to 116%. The RSD values were lower than 8% for Cd and Pb and the
LOD values were 0.5 ng g-1 for Cd, 6 ng g-1 for Pb and 1 ng g-1 for Tl. The obtained results using
the analyte additions method or by matrix matching calibration were in agreement, conirming the accuracy of the proposed procedure. Organometallic standards were not required and different samples were analyzed.
Keywords: GF AAS, biodiesel, microemulsion, cadmium, lead, thallium, chemical modiier
Introduction
In recent years, biodiesel has been considered an important fuel, not only because of its advantages in relation to environmental pollution, but also because it
is produced from renewable sources, being an adequate
substitute for fossil fuels.1-3 However, some problems
are associated with its performance in engines due to its high viscosity, high molecular weight and low volatility that may cause deposits in the motors and super-heating of the injectors. Another problem is still the high costs of
production.4,5 In spite of these problems, high investments
the production and use of biodiesel from different raw materials.
Biodiesel is mainly obtained by the alcoholic transesteriication of vegetable oil or vegetable or animal fat, generally, in the presence of a catalyst.6-8 It is produced
from renewable biomass with a high potential for reduction of the emissions in the environment, being considered neutral in relation to carbon emission, since all carbon liberated in the combustion is captured by the plantations used in the
production of the fuel.9 Biodiesel is almost free from sulfur
and nitrous polyaromatic hydrocarbons.4,5,10,11 In addition, it
is considered to be an inexhaustible source of energy, having an energetic content similar to diesel from petroleum. In Brazil, the development of the technology for automotive vehicles is a priority. A mixture of 2% (v/v) biodiesel in diesel is already being commercialized and is expected to
reach the 5% (v/v) fraction in 2013.12 According to Agência
Nacional do Petróleo, Gás Natural e Biocombustíveis (ANP), resolution nº 07 from 03/19/2008, biodiesel B100 is deined as the fuel composed of alkyl esters of long chain fatty acids, produced from vegetable oils or animal fat and biodiesel B2 is the commercial fuel mixture containing 98% (v/v) of diesel
oil and 2% (v/v) of biodiesel B 100.13
The quality control of fuels by determination of metals is important as they may change the motor performance and may be a pollution source, with consequences to the
health of the population.14,15 Cadmium, Pb and Tl are some
of the elements whose accumulation in the environment,
due to human activity, has been reported in recent years.16-18
These elements are important for industry (Cd and Pb) and
medicine (Tl), explaining their widespread use.19 They are
among the most harmful to health elements, even at low concentrations, causing damage to several body organs,
such as lung, kidneys, liver and nervous system.20-22
With the introduction of biodiesel as an alternative fuel, the same type of control is required. Metals and other elements can be absorbed by the plants, depending on the characteristics of the soil, and consequently their natural constituents. They also can be introduced during the production, transportation or storage of the fuel or added to
improve the fuel characteristics.15,23-25 Some compounds and
complexes containing metals in the vegetable oil or animal fat may inluence the kinetics of the reactions involved in the biodiesel production, acting as catalysts or catalyst
poisons.26 In the biodiesel, some metal compounds may also
change the biodiesel properties, concerning combustion in
motors, due to oxidation.27 So far, there is no regulation in
the Brazilian legislation concerning the levels of Cd, Pb and Tl in biodiesel, probably because their concentrations are very low and dificult to be measured. There is a lack of studies about their effects on the oil properties.
The determination of elements in biodiesel is a challenge to the analytical chemists. This kind of sample, viscous and complex, frequently needs to be converted to a convenient form, in order to be introduced in an analytical instrument. Also calibration is a problem, because standard solutions prepared in aqueous medium usually do not compensate for
the non-spectral interferences.28,29 The conventional sample
treatment normally involves digestion. Wet digestion of sample with a high organic content may include calcinations at high temperature and the use of an acid mixture. Some of the disadvantages of such a treatment are the long time required to complete the process, risk of loss of the volatile elements, sample contamination during its treatment and the use of toxic and dangerous acids.30,31 The digestion
can be assisted by microwave, which reduces the sample preparation time, but increases the analysis cost. In order to minimize the associated problems with sample treatment, the direct analysis of a sample microemulsion may be an easier alternative. Microemulsion is a transparent three component system, composed of water, oil and amphiphilic compounds, such as alcohols. They are formed instantaneously, are thermodynamically stable and have relatively low viscosity.
32-35 In some cases, it is possible to use calibration against
aqueous standards, when the sample is analyzed as a microemulsion,36 or at least inorganic standards can be
use in a matrix-matched calibration. Microemulsions have been used to determine metallic and semi-metallic elements in different fuels by graphite furnace atomic absorption spectrometry (GF AAS). This technique has excellent sensitivity and allows the determination of trace metals in fuel samples after a simple pre-treatment.37-39 In addition this
technique may produce accurate results, even for complex samples, since the interference is minimized by using a temperature program, optimized in the presence of chemical modiiers. The modiiers usually act stabilizing thermally the analytes, allowing higher pyrolysis temperature and better matrix elimination.40-43
The objective of this work consist in the study of modiiers in solution and also as permanent modiiers and calibration techniques for the development of a method for the determination of Cd, Pb and Tl in biodiesel. The feasibility of using a simple treatment, consisting of the formation of a biodiesel microemulsion, will be investigated. Aqueous and matrix matching calibrations will be tested.
Experimental
Instrumentation
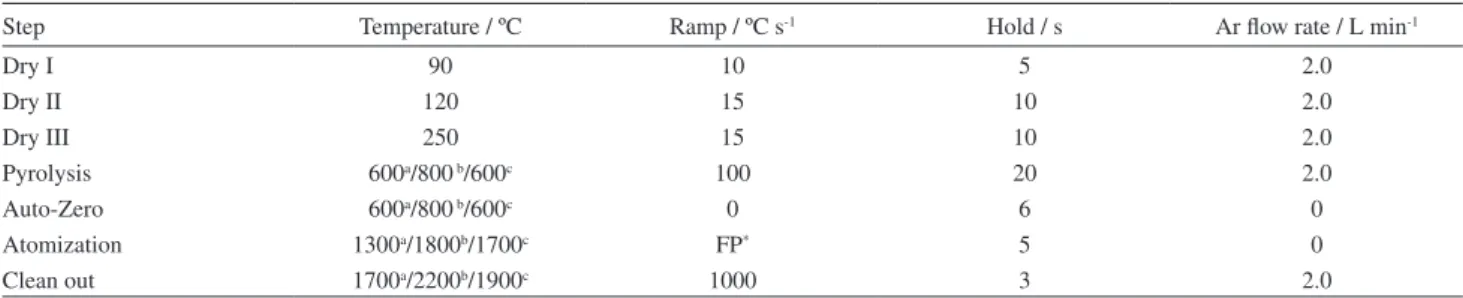
Jena, Germany) with transversely heated graphite furnace atomization system and deuterium lamp background correctior. The instrument, controlled by a compatible PC, was coupled to an auto sampler MPE 5 (Analytik Jena). Cadmium, Pb and Tl hollow cathode lamps (GLE, Berlin, Germany) were used operating at 8.0, 4.0 and 4.0 mA, respectively. The measurements were realized at wavelengths of 228.8 nm for Cd, 283.3 nm for Pb and 276.8 nm for Tl with 0.8, 0.2 and 0.2 nm spectral resolution, respectively. All experiments were carried out using pyrolytically coated graphite tubes with pyrolytical graphite platform (Analytik Jena, part no. 407-A85.025). Argon (99.996%, White Martins, São Paulo, Brazil) was used as purge and protective gas throughout. The optimized graphite furnace temperature program used for the determinations is shown in Table 1.
Reagents and samples
All reagents used were of analytical grade. The water used in all procedures was puriied in a Milli-Q system (Millipore,
Bedford, MA, USA) to a resistivity of 18 MΩ cm. Nitric acid
(Carlo Erba, Milan, Italy, no. 408015), puriied by subboiling distillation in a quartz still (Kürner Analysentechnik, Rosenheim, Germany), and n-propanol (Merck, Darmstadt, Germany No. 1.00997.1000) were used in the samples and calibrations solutions preparation. Monoelemental solutions of Cd, Pb and Tl were prepared by proper dilution with
puriied water of stock solutions containing 1000 µg mL-1 of
each analyte, i.e., Cd (CdO), Pb (Pb(NO3)2) and Tl (TlNO3) (Spex, Edison, NJ, USA). The AccuStandard base oil (New Haven, CT, USA, PN B1035005) was used for the blank and calibration solutions preparation.
Biodiesel samples B100 supplied by Instituto Tecnológico do Paraná (TECPAR) were analyzed. All samples were produced by basic transesteriication of oils from different sources in methanol medium: castor bean (B100-M), soybean (B100-S) soybean lees (B100-B), cotton (B100-A), animal fat (B100-F), fodder turnip (B100-N) and sunlower (B100-G).
Calibration solutions preparation
The analyte additions calibration curves were obtained from monoelemental stock solutions of the analytes by proper dilution in aqueous medium, as microemulsion with base mineral oil. The calibration standards microemulsions were prepared using 2.0 g of base oil, 1.0 mL of a 10% (v/v) acid nitric aqueous solution and n-propanol to a 10 mL inal volume. Results for different calibration curves were evaluated based on sensitivity and accuracy of the obtained concentration values.
Sample preparation
The biodiesel samples were prepared in triplicate using an aliquot of approximately 2 g exactly weighed in a polypropylene lask. After that, were added 1.00 mL of a 10% (v/v) nitric acid aqueous solution and n-propanol to a inal volume of 10 mL. The mixture was then manually stirred to form the homogeneous microemulsion.
Modiiers
Palladium and Ru were employed as permanent modiiers, Pd for determination of Cd and Tl, and Ru for determination of Pb. The deposition of the modiier on the
graphite surface was carried out by injecting 20 µL of a
1.0 g L-1 solution of the modiier, Pd or Ru, onto the graphite
platform inserted in the graphite tube and by submitting the tube to a temperature program shown in Table 2. This
procedure was repeated 25 times resulting in a 500 µg total
mass of Pd or Ru on the platform.
Results and Discussion
Pyrolysis and atomization curves
Palladium and Ru, either in aqueous solution or as permanent modiiers, were tested, for the different analytes, employing pyrolysis and atomization temperature curves, Table 1. Temperature program for determination of Cd, Pb and Tl in microemulsion of biodiesel samples by GF AAS
Step Temperature / ºC Ramp / ºC s-1 Hold / s Ar low rate / L min-1
Dry I 90 10 5 2.0
Dry II 120 15 10 2.0
Dry III 250 15 10 2.0
Pyrolysis 600a/800 b/600c 100 20 2.0
Auto-Zero 600a/800 b/600c 0 6 0
Atomization 1300a/1800b/1700c FP* 5 0
Clean out 1700a/2200b/1900c 1000 3 2.0
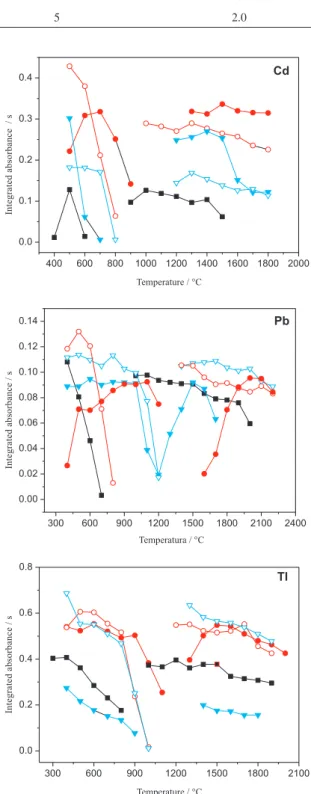
which are shown in Figure 1. Curves without a modiier are also shown. In order to choose the best modifier and the optimum temperatures, peak shape (not shown here), intensity signal and thermal stability were taken into consideration. For Cd, the pyrolysis curves were carried out with the atomization temperatures of 1300 °C without modifier and 1500 °C in the presence of the modiiers. The atomization curves were obtained with the
optimized pyrolysis temperature, i.e., the temperature that
has presented the highest sensitivity and the best signal proile. For Pb, the atomization temperatures for obtaining the pyrolysis curves were 1500 °C without modiier and 1800 °C with modiier. For Tl, the atomization temperatures were 1700 °C without and 1900 °C with modiier. For both, Pb and Tl, the atomization curves were obtained using the same criteria as for Cd. As shown in Figure 1 for Cd, Pd promoted better stabilization in comparison to Ru, either in solution or as permanent modiier. Palladium in solution performed somewhat better than as permanent modiiers, concerning sensitivity and thermal stabilization. However, Pd as permanent modiier produced a better deined peak shape. Considering this and the fact that the permanent modiier is more practical, since the modiier does not need to be pipetted into the tube before each determination, a Pd layer deposited on the graphite tube was selected as the permanent modiier for Cd. The chosen pyrolysis and atomization temperatures were respectively, 600 °C and 1300 °C.
The pyrolysis curves for Pb have shown that Ru as permanent modiier was more adequate for this analyte, concerning thermal stability. Peak shape was also better deined with this modiier. In spite of that permanent Pd produced higher sensitivities for lower pyrolysis temperature, the thermal stabilization was less effective, since analyte loss occurs for pyrolysis temperature higher than 600 ºC. In addition, Pd is more volatile than Ru, and may be partially lost during atomization and tube cleaning. Ruthenium, as a permanent modiier, was chosen for the determination of Pb, allowing high pyrolysis temperature. For this analyte the adopted pyrolysis temperature was 800 ºC and the chosen atomization temperature was 1800 ºC. It is noticeable that
Table 2. Temperature program for Pd and Ru modiiers deposition on the L’vov platform onto graphite furnace for modiiers study for determination of Cd, Pb and Tl in biodiesel microemulsion by GF AAS
Temperature / ºC Ramp / ºC s-1 Hold / s Ar Flow / L min-1
130 30 20 2.0
400 30 20 2.0
400 0 6 0
1000 1000 10 0
2000 100 5 2.0
Figure 1. Pyrolysis and atomization curves for biodiesel microemulsion (B100-F): without modiier (); with Pd solution (); with Pd permanent (); with Ru solution () and with Ru permanent ().
the optimum atomization temperature is higher when Pd in solution is used as modiier.
No signal was obtained for Tl in the biodiesel samples, indicating concentrations below the quantiication limit. The sample microemulsion was formed and enriched in Tl by adding an aqueous standard solution to the aqueous phase, to a 20 µg L-1 inal concentration in the
microemulsion. The curves show that the permanent modiiers and Pd in solution promote similar thermal stabilization. Ruthenium in solution, however, produced lower sensitivities. Palladium in the permanent form was selected as modiier for Tl, using pyrolysis and atomization temperatures of 600 °C and 1700 °C, respectively.
Since Pd is not very thermally stable and considering
the cleaning temperature of 1900 oC (Table 1), it was
necessary to check the modiier action of the Pd layer along the tube lifetime. Using the optimized conditions, a microemulsion formed with the biodiesel produced from
soybean lees enriched with 40 μg L-1 of Tl and a standard
aqueous solution of Tl in the same concentration, were measured in newly treated graphite tubes. No signiicant variation in the intensity signal with the number of cycles was observed up to eighty cycles, either measuring the microemulsion or the aqueous solution.
Calibration
Two simple and rapid calibration strategies were applied: calibration against standard solutions prepared in aqueous medium and matrix-matching calibration using microemulsion prepared with base oil. The analyte additions method was also used for comparison purposes. The microemulsion was enriched with the analyte by adding the aqueous standards to the aqueous phase of the microemulsion. The slopes of the calibration curves obtained for solutions prepared in aqueous medium for all analytes were higher than those obtained by the two other approaches. For Cd, the difference in the slope was more than 50%, while for Pb, it was 39% and for Tl, it was 22%. However, similar slopes and concentration values were obtained, for each analyte, using matrix matching calibration or the analyte
additions method, indicating that non-spectral interferences were corrected using matrix matching calibration. These two calibration approaches could be used, however, for practical reasons, including higher sample throughput, the matrix matching calibration using a microemulsion prepared with base oil is recommended.
Metal stability in the microemulsion
The microemulsion composition is very critical for analytes stability and probably also for the microemulsion itself. In between two readings in the spectrometer, the autosampler cleans the capillary tip with a solution containing 0.2% (v/v) nitric acid and 0.5% (v/v) Triton X-100. A residue of this solution remained on the tip, which sinks in the measuring solution, changing slightly the microemulsion composition. Washing the capillary tip, it was found that the signal intensity for each analyte, decreased by repeating the measurement of the same solution several times. It was decided not to wash the tip between the measurements.
The signal intensity stability was demonstrated by reading the same microemulsion aliquot or an aqueous standard solution, kept in open 2 mL polypropylene autosampler cups, every 15 min. No signiicant difference in the signal intensity, for each analyte, was noticed up to 120 min, with or without mechanical agitation of the microemulsion or standard solution, indicating that the metal in the microemulsion was stable for at least 120 min.
Analytical igures of merit
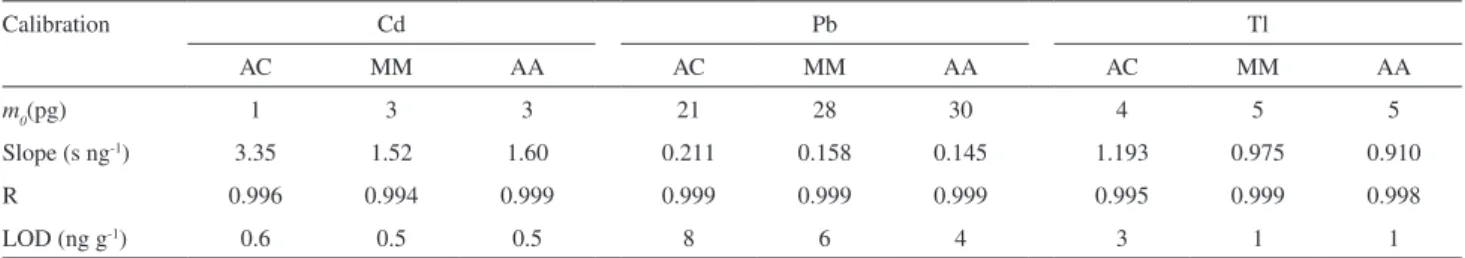
The slopes of the calibration curves, their linear correlation coeficients (R), the limits of detection (LOD) and the characteristic masses are shown in Table 3. The limit of detection was deined as three times the standard deviation of ten measurements of the blank divided by the slope of the calibration curve and calculated for the biodiesel samples. The limit of quantiication (LOQ) was deined as three times the LOD. Good linearity was obtained for all situations with R ≥ 0.994. As already discussed,
Table 3. Analytical igures of merit for determination of Cd, Pb and Tl in biodiesel by GF AAS using different calibration strategies: aqueous calibration (AC), matrix matching (MM) and analyte additions (AA)
Calibration Cd Pb Tl
AC MM AA AC MM AA AC MM AA
m0(pg) 1 3 3 21 28 30 4 5 5
Slope (s ng-1) 3.35 1.52 1.60 0.211 0.158 0.145 1.193 0.975 0.910
R 0.996 0.994 0.999 0.999 0.999 0.999 0.995 0.999 0.998
higher slopes were found for calibration curves found with aqueous standard solutions. The analyte additions method and the matrix matching calibration produced similar slopes for each analyte, indicating compensation of non-spectral interferences. The detections limits were very low, in the ng g-1 level or even below.
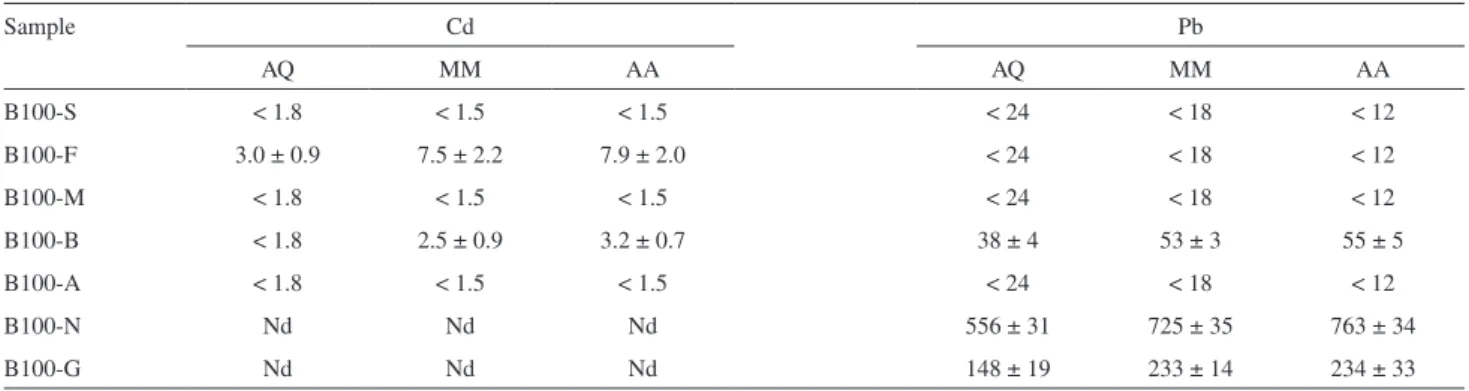
Accuracy of the proposed method was checked by comparing the results obtained for 7 biodiesel samples, using matrix matching calibration or the analyte additions method, when possible. As already mentioned the calibration against standard solutions prepared in aqueous medium led to inaccurate results and were shown only for comparison. All results are in Table 4. The values obtained by matrix matching or analyte additions were in agreement, according to the t-student test at a 95% conidence level, indicating compensation of non-spectral interferences. The found concentrations were quite low for Cd. For Pb, the concentrations were much higher, especially in the one produced from fodder turnip and in the other from sunlower, probably due to contamination problems during production, transportation and storage, or by absorption from contaminated soils. Coutinho and
Barbosa44 had reported that fodder turnip is a plant used
in phytoremediation of contaminated soil.45 Thallium was
not detected in any sample.
In addition, the recovery test was applied to the biodiesel sample B100-B, enriched with aqueous inorganic standards during the microemulsion formation. As shown in Table 5, the recovery values were in the range of 80
to 116%, conirming the good accuracy of the proposed method. The precision, expressed by the relative standard deviation calculate in this situation, was adequate, with RSD values below 8%.
Conclusions
The sample preparation is easy and rapid, requiring only the mixing of three liquid components, in the laboratory ambient conditions, to form a microemulsion, in which the metals are stable during an appropriate time to carry out the measurements. Heating, large amount of concentrated acids and other drastic procedures are not required, reducing the risks of sample contamination or analyte loss that could be critical due to the volatilities of the analytes. However sample dilution is required (2 g in 10 mL) in order to form the microemulsion. Even though, the detection limits of the proposed methods are
quite low at the ng g-1 level or below. Permanent chemical
modiiers were chosen, Pd for Cd and Tl, and Ru for Pb. The modiier made possible the use of relatively high pyrolysis temperature, certainly contributing for the good accuracy. Calibration against standard solutions prepared in aqueous medium could not be applied to the biodiesel sample as microemulsion. Either the analyte additions method on the microemulsion or a matrix matching calibration produced accurate results. However, for practical reasons, the matrix matching calibration is recommended. In this case, a base oil is necessary to form the standard microemulsion. The analyte is added to the microemulsion used for calibration, as a standard aqueous solution, which is very convenient. A simple and accurate method for the determination of Cd, Pb and Tl in biodiesel samples by GF AAS is proposed. The GF AAS, once more, demonstrates enough robustness to analyze viscous and complex sample, such as biodiesel.
Table 4. Concentrations values, in ng g-1, for Cd and Pb, (mean ± conidence interval), in different biodiesel samples by GF AAS, using calibration against
aqueous solutions (AQ), matrix matching (MM) and analyte additions (AA), after microemulsion formation (n = 3)
Sample Cd Pb
AQ MM AA AQ MM AA
B100-S < 1.8 < 1.5 < 1.5 < 24 < 18 < 12
B100-F 3.0 ± 0.9 7.5 ± 2.2 7.9 ± 2.0 < 24 < 18 < 12
B100-M < 1.8 < 1.5 < 1.5 < 24 < 18 < 12
B100-B < 1.8 2.5 ± 0.9 3.2 ± 0.7 38 ± 4 53 ± 3 55 ± 5
B100-A < 1.8 < 1.5 < 1.5 < 24 < 18 < 12
B100-N Nd Nd Nd 556 ± 31 725 ± 35 763 ± 34
B100-G Nd Nd Nd 148 ± 19 233 ± 14 234 ± 33
*Nd: not determined.
Table 5. Recovery test performed on a soy biodiesel sample using matrix matching calibration
Cda Pbb Tlc
Addition (ng g-1)
2.5ª /50b/15c 4.5 ± 0.3 111 ± 4 15.3 ± 3.5
5.0a/100b/25c 7.1 ± 1.2 144 ± 7 23.41 ± 3.7
Acknowledgements
The authors are thankful to Conselho Nacional de Desenvolvimento Cientíico e Tecnológico (CNPq, Brasília, Brazil) and to Fundação de Apoio à Pesquisa Cientíica e Tecnológica do Estado de Santa Catarina (FAPESC, Florianópolis, Brazil), for inancial support. E. S. C. and A. J. C. are thankful to CNPq by providing scholarships.
References
1. Bozbas, K.; Renewable Sustainable Energy Rev.2008, 12, 542. 2. Imahara, H.; Minami, E.; Hari, S.; Saka, S.; Fuel2008, 87, 1. 3. Benjumea, P.; Agudelo, J. B.; Agudelo, A.; Fuel2008, 87, 2069.
4. Kegl, B.; Bioresour. Technol.2008, 99, 863.
5. Lapuerta, M.; Rodríguez-Fernández, J.; Agudelo, J. R.;
Bioresour. Technol. 2008, 99, 731.
6. Ramadhas, A. S.; Jayaraj, S.; Muraleedharan, C.; Renewable
Energy2004, 29, 727.
7. Edlung, M.; Visser, H.; J. Anal. At. Spectrom.2002, 17, 232. 8. Abreu, F. R.; Lima, D. G.; Hamúa, E. H.; Wolf, C.; Suarez, P.
A. Z.; J. Mol. Catal. A: Chem.2004,209, 29.
9. Castro, M. P. P.; Andrade, A. A.; Franco, R. W. A.; Miranda, P. C. M. L.; Sthel, M.; Vargas, H.; Constantino, R.; Baesso, M.
L.; Chem. Phys. Lett.2005,411, 18.
10. Kelkar, A. M.; Gogate, P. R.; Pandit, A. B.; Ultrason. Sonochem.
2008, 15, 188.
11. Demirbas, A.; Bioresour. Technol.2008, 99, 1125.
12. Aliske, M. A.; Zagonel, G. F.; Costa, B. J.; Veiga, W.; Sauil, C. K.; Fuel2007, 86, 1461.
13. Agência Nacional do Petróleo, Gás Natural e Biocombustíveis, Resolução Nº. 07 de 19 de março de 2008, Brasília, 2008. http:// www.anp.gov.br, acessado Out. 2009.
14. Wang, Y.; Huang, K.; Li, C.; Mi, H.; Luo, J.; Tsai, P.; Atmos.
Environ.2003, 37, 4637.
15. Saint’Pierre, T. D.; Dias, L. F.; Maia, S. M.; Curtius, A. J.;
Spectrochim. Acta, Part B2004, 59, 551.
16. Shi, W.; Shao, H.; Li, H.; Shao, M.; Du, S.; J. Hazard. Mater.
2009, 170, 1.
17. Jiang, M.; Wang, Q.; Jin., X.; Chen, Z.; J. Hazard. Mater. 2009,
170, 332.
18. Vaněk, A.; Chrastný, V.; Mihaljevič, M.; Drahota, P.; Grygar, T.; Komárek, M.; J. Geochem. Explor.2009, 102, 7.
19. Snader, C. E.; Marwick, T. H.; Pashkow, F. J.; Harvey, S. A.; Thomas, J. D.; Lauer, M. S.; J. Am. Coll. Cardiol.1997, 30, 641.
20. Tálio, M. C.; Luconi, M. O.; Mais, A. N.; Fernández, L. P.;
J. Hazard. Mater. 2009, 170, 272.
21. Hanzel, C. E.; Verstraeten, S. V.; Toxicol. Appl. Pharmacol.
2009, 236, 59.
22. Li, H.; Chi, W.; Shao, H.; Shao, M.; J. Hazard. Mater. 2009,
169, 1106.
23. Pinto, A. C.; Guarieiro, L. N.; Rezende, M. J. C.; Ribeiro, N. M.; Torres, E. A.; Lopes, W. A.; Pereira, P. A. P.; Andrade, J.
B.; J. Braz. Chem. Soc. 2005, 16, 1313.
24. Clemente, R.; Paredes, C.; Bernal, M. P.; Agric., Ecosyst.
Environ.2007, 118, 319.
25. Wilson, B.; Pyatt, F. B.; Ecotoxicol. Environ. Saf.2007, 66, 224. 26. Soriano Jr., N. U.; Venditti, R.; Argyropoulos, D. S.; Fuel2009,
88, 560.
27. Knothe, G.; Dunn, R. O.; J. Am. Oil Chem. Soc.2003, 80, 1021. 28. Aucélio, R. Q.; Curtius, A. J.; Analyst2000, 125, 1673. 29. Sant’Ana, F. W.; Santelli, R. E.; Cassella, A. R.; Cassella, R.
J.; J. Hazard. Mater.2007, 149, 67.
30. Coedo, A. G.; Dorado, T.; Padilla, I.; Maibusch, R.; Kuss,
H.-M.; Spectrochim. Acta,Part B2000, 55, 185.
31. Lu, H.-H.; Jiang, S.-J.; Anal. Chim. Acta2001, 429, 247. 32. Noguera-Ortí, J. F.; Villanueva-Camañas, R. M.; Ramis-Ramos,
G.; Anal. Chim. Acta1999, 387, 127.
33. Dantas, T. N. C.; Silva, A. C.; Neto, A. A. D.; Fuel2001, 80, 75.
34. Radomska, A.; Dobrucki, R.; Int. J. Pharm.2000, 196, 131. 35. De Jesus, A.; Silva, M. M.; Vale, M. G. R.; Talanta2008, 74,
1378.
36. Aucélio, R. Q.; Doylea, A.; Pizzornoa, B. S.; Tristão, M. L. B.; Campos, R. C.; Microchem. J.2004, 78, 21.
37. Ati-Hellal, M. E.; Hellal, F.; Dachraoui, M.; Hedhili, A.; C. R.
Chim.2007, 10, 839.
38. Reyes, M. N. M.; Campos, R. C.; Spectrochim. Acta, Part B
2005, 60, 615.
39. Santelli, R. E.; Bezerra, M. A.; Freire, A. S.; Oliveira, E. P.; Carvalho, M. F. B. Fuel2008, 87, 1617.
40. Acar, O.; Anal. Chim. Acta2004, 526,103.
41. Uggerud, H. T.; Lund, W.; Spectrochim. Acta, Part B1999, 54, 1625.
42. Maia, S. M.; Welz, B; Ganzarolli, E.; Curtius, A. J.; Spectrochim.
Acta,Part B2002, 57, 473.
43. Fariñas, M. V.; García, J. B.; Martín, S. G.; Crecente, R. P.; Latorre, C. H.; Anal. Chim. Acta2007, 591, 231.
44. Coutinho, H. D.; Barbosa, A. R.; Silva Lusitana2007, 15, 103. 45. Kapourchal, S. A.; Kapourchal, S. A.; Pazira, E.; Homaee, M.;
Plant Soil Environ. 2009, 55, 202.