346 Brazilian Journal of Physics, vol. 38, no. 3A, September, 2008
Neutron Induced Radiography. A Technique to Inspect the Internal Structure of thin Samples
M. A. Stanojev Pereira, F. Pugliesi, and R. Pugliesi ∗ Instituto de Pesquisas Energ´eticas e Nucleares (IPEN-CNEN/SP)
Av. Prof. Lineu Prestes 2242, Cidade Universit´aria, Butant˜a CEP 05508-000, S˜ao Paulo-SP, Brazil
(Received on 3 July, 2008)
The present paper describes a radiography technique to inspect low thickness samples, on the order of micra. The penetrating radiation are charged particles generated by a lithium fluoride screen irradiated by thermal neu-trons. The film used to register the images is a solid state nuclear track detector and the experimental conditions to obtain the best radiography are provided. A digital system for data acquisition and image processing was also used.
Keywords: Track detectors; Track - etch foils; Radiography
1. INTRODUCTION
There is a great scientific interest regarding the inspection of the internal structure of thin samples, on the order of mi-cra, in biology, medicine, forensic technology, metallurgy, etc. Radiography and microscopy techniques are commonly used for such purpose. Among these techniques, the autoradiogra-phy which records the distribution and location of a radioac-tive liquid material within the sample, is one of the most used [1, 2, 3, 4].
The present paper describes a radiography technique to in-spect thin samples in which charged particles, generated by a lithium fluoride screen irradiated by thermal neutrons, are used as penetrating radiation. The film used to record the im-age is a solid state nuclear track detector – SSNTD. In this case the interaction of the charged particles with the detector gives rise to damages in its molecular structure which under an adequate chemical etching became tracks, the basic units that form the image [5].
A digital system developed by the neutron radiography working group of IPEN-CNEN/SP was used for data acqui-sition and image processing [6].
The main objective of this paper is to determine the expo-sure and the etching time for which the set detector – screen must be submitted to obtain the best contrast in the radio-graphic image, evaluate the spatial resolution for these condi-tions and provide some radiography images to show the tech-nique’s capability.
2. EXPERIMENTAL
The irradiations have been performed at the neutron ra-diography facility installed at radial beam hole #8 of the 5MW pool - type IEA-R1 nuclear research reactor of IPEN – CNEN/SP. The thermal neutron flux near the reactor core is about ∼10 13 n. s−1cm−2 and the characteristics of the
neutron beam at the detector irradiation position are given in Table I [7].
∗Corresponding author: e-mail: [email protected]
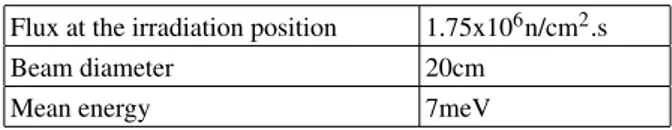
TABLE I: Characteristics of the neutron beam at the detector posi-tion.
Flux at the irradiation position 1.75x10⁶n/cm2.s
Beam diameter 20cm
Mean energy 7meV
The SSNTD used was the CR-39 which is a polymer man-ufactured by Pershore Mouldings England, having 600µm in thickness. The lithium fluoride screen (LiF) is a neutron scin-tillator commercially known as NE-426. In its manufacturing process a mixture of6LiF and ZnS is deposited on a 18cm
x 24cm aluminum base. The interaction “neutron – screen” gives rise to the nuclear reaction 6Li(n,α)T generating the charged particles with energies of 2.05 MeV and 2.74 MeV respectively [8].
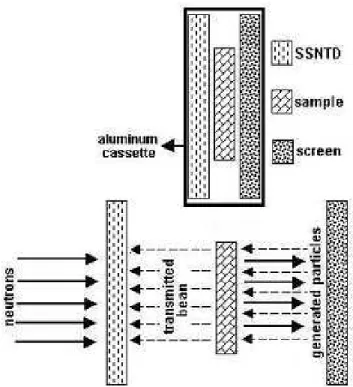
During irradiation, the CR-39, the sample and the LiF screen are kept, in this order with respect to the neutron beam, in a tight contact inside an aluminum cassette as shown in Fig. 1. The neutrons pass through the detector, through the sample and will induce nuclear reactions in the screen. The gener-ated particles reach the sample and the transmitted intensity impinges the SSNTD. The interaction of these particles with the detector leaves a narrow and permanent trail of damages with diameters of about 100 Angstroms and length of about 54µm and 10µm, the range of the tritium and of theα- parti-cles in the SSNTD [9]. Under an adequate chemical etching the damaged regions being more reactive than the surrounding undamaged areas are enlarged forming permanent tracks, the responsible by the darkening of the detector and therefore by the image formation [10].
The etching was performed in a KOH (30%) aqueous so-lution at 70 ˚ C [11]. During the etching, the CR-39 remains inserted in a Pyrex container, containing 400 ml of the solu-tion and this set is immersed in a heated water bath. After etching, the detector is washed in a soft water stream.
M. A. Stanojev Pereira, F. Pugliesi, and R. Pugliesi 347
FIG. 1: Set up of the neutron induced radiography experiment where the neutron beam is converted into alpha and tritons, detected by a SSNTD.
level scale ranging from 0 (darkest pixel) to 255 (brightest pixel) [6].
3. DATA ACQUISITION AND ANALYSIS
3.1. Contrast
Usually the contrast in a SSNTD is studied by means of curves that relate gray level intensity (GL) and exposure (E) as a function of the etching time and is defined by the equation [6]:
G= ∆(GL)
∆log(E) (1)
Hence the best contrast is obtained for the exposure interval corresponding to the steeper region of these curves. Since the charged particles are generated by neutrons, these curves were obtained as functions of the neutron exposure given by:
E=φ·t (2)
whereφis the neutron flux at the detector(n.s−1.cm−2)andt is the irradiation time(s).
For such purpose several slices of the detector (15mm x 35mm) have been irradiated in the exposure interval 1.75x10⁷n.cm−2<E<1.89x10¹⁰n.cm−2 and etched in 15,
35 and 65 minutes. These etching times were selected by tak-ing into account some previous results obtained in [12]. The detectors have been positioned in the scanner and the behavior of the gray level as functions of the exposure for these etch-ing times is shown in Fig. 2. Each experimental data was obtained by averaging the gray level values of about 15,000 individual pixels in an area of 0.4cm2 of the detector. Ac-cording to the obtained results the best contrast was achieved for 35 minutes of etching and for the exposure interval 1x10⁹
<E <1.5x10¹⁰n.cm−2 (indicated by arrows). This means
that the required exposure to reach the best contrast, that is, for which the detector reaches the highest darkening level is 1.5x10¹⁰n.cm−2and according to (2) and to Table I,
corre-sponds to an irradiation of 2.4 hours. For 15 minutes of etch-ing, the value for the contrast and for the dynamic range (the gray level range corresponding to the best contrast region) are very near to the obtained for 35 minutes, however an irradia-tion of about 11 hours is necessary to reach the best contrast region. For 65 minutes the irradiation time is only 1 hour, however the contrast and the dynamic range are worst when compared with the previous values. These results are summa-rized in Table II.
1E8 1E9 1E10
170 180 190 200 210 220 230 240 250 260
15min 35min 65min
g
ra
y
l
e
v
e
l
exposure(n/cm2)
FIG. 2: Behavior of the gray level as functions of the exposure for 15, 35 e 65 minutes of etching.
TABLE II: Contrast characteristics for the CR-39/ LiF. Etching time
(min)
Contrast Irradiation time (h)
Dynamic range
15 62 11 75
35 68 2.4 80
65 55 1 58
3.2. Spatial Resolution
adja-348 Brazilian Journal of Physics, vol. 38, no. 3A, September, 2008
cent. The resolution depends of the thickness of the sample, sample to detector distance, track size, range of the particles in the SSNTD and neutron beam and screen inhomogeneities [13, 14]. Usually the resolution is quoted in terms of the pa-rameter “total unsharpness - (Ut)” which is evaluated by scan-ning the gray level intensity at the radiography image of a sharp edge object, obtained at the same conditions for which the best contrast was determined, that is, 35 minutes of etch-ing and 2.4 hours of irradiation. In the present paper the sharp edge object was a cellulose nitrate foil 100µm in thickness. After irradiation and etching the detector was positioned in the digital system and the scanning performed at 3200 d.p.i (dots per inch). The Fig. 3 shows a typical obtained gray level distribution. The following Edge Spread Function-ESF was fitted to the distribution intensity:
ESF=p1+p2.arctan(p3.(X−p4)) (3) whereXis the scanning coordinate, p1,p2, p3 ep4, are free parameters and the total unsharpness is given byUt=2/(p3)
[15].
8x10⁻¹ 9x10⁻¹ 1x100 160
180 200 220 240 260
g
ra
y
l
e
v
e
l
scanning coordinate (mm)
FIG. 3: Typical gray level intensity distribution and the ESF fitting.
The obtained result wasUt= 47±2µm which has been de-termined by averaging the unsharpness values corresponding to four distinct regions of the edge and its uncertainty is given by the standard deviation of the mean. The results are given in Table III. This result is in accordance to the image formation theory in SSNTD and a detailed analysis can be found in [10, 12, 13].
TABLE III: Total unsharpness: four distinct regions of the edge and its mean value.
Measurement Ut(µm)
1 43±5
2 49±5
3 50±6
4 46±5
Mean value 47±2
4. CONCLUSION
The Table IV summarizes the irradiation and etching con-ditions to obtain the best contrast in the radiography as well as the characteristics of the image for the CR-39 – LiF set.
TABLE IV: Conditions and characteristics of a radiography.
Exposure interval (n.cm−2) 1×10⁹<E<1.5×10¹⁰
Irradiation time (h) 2.4
Etching time (min) 35
Contrast 68
Dynamic range 80
Spatial resolution (µm) 47±2 Maximal sample thickness (µm) ∼54
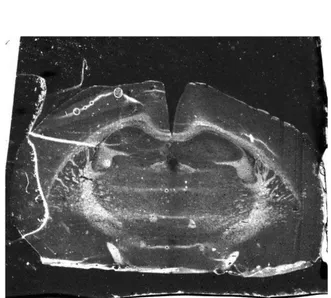
FIG. 4: Mice brain tissue - 10µm in thickness.
1000Pm
M. A. Stanojev Pereira, F. Pugliesi, and R. Pugliesi 349
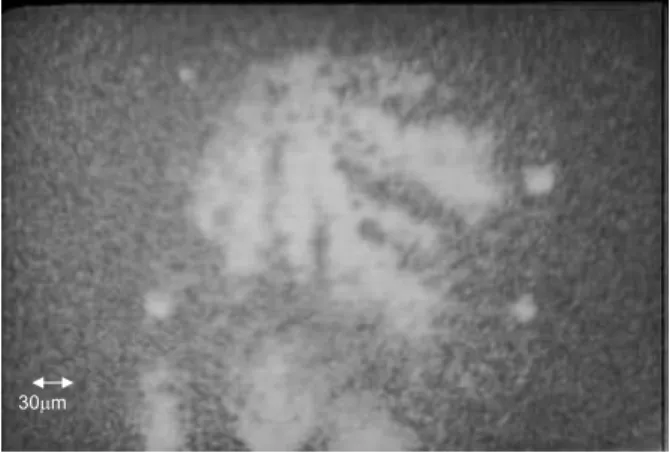
30Pm
FIG. 6: Bacterial colony.
In order to demonstrate the potential of this technique, the figures below are some radiographs, obtained in the condi-tions given in Table IV. In these examples, the radiographs have been digitized at 3200 d.p.i and its visualization has been enhanced by digital processing by using the same digital sys-tem. The Fig. 4 shows the radiography of a mice brain tissue having 10µm in thickness. The sample was cut and deposited at the CR-39 surface and covered by the LiF screen. After
irradiation and etching the CR-39 is positioned in the digital system and the resulting image shows many details of the tis-sue structure. The Fig. 5 shows the radiography of an insect wing obtained as the previous one. It is possible to observe details of its internal structure as the ducts (or viens) for the nutrients with diameter ranging from 60µm to 200µm. In the Fig.6 a radiography of bacterial colony is shown. In this case the radiography was obtained by taking an aliquot of the cul-tured medium in which the colony was growing and deposit-ing it on the CR-39 surface. After its drydeposit-ing, it was covered by the screen and the detector was irradiated and etched. The resulting image shows several details of a selected colony.
In comparison with the autoradiography, in the present technique is not necessary to handle a radioactive liquid mate-rial to perform the radiography, the irradiation time to obtain the radiography is some hours instead of weeks or months and the image quality is better [16].
It is important to mention that other screen can be used to generate other penetrating radiations. For example two com-mercially available screens manufactured by Kodak, based on natural boron or lithium tetraborate, have been already stud-ied and their characteristics are detailed in [17]. In the same way other detectors can be also used to register the radiog-raphy image, and detailed studies regarding the Makrofol-E, Makrofol-DE and Durolon are published in [18].
[] G. Waksman, E. Hamel, M. Fournie-Zaluski, and B. P. Roques, Proc. Natl. Acad. Sci.83, 1523 (1986).
[] M. P. Ginige, P. Hugenholtz, H. Daims, M. Wagner, J. Keller, and L. L. Blackall, Applied and Environmental Microbiology 70,No.1 588 (2004).
[] A. S. Mghir, A. C. Cremieux, R. Bleton, F. Ismael, M. Manteau, S. Dautrey, L. Massias, L. Garry, N. Sales, B. Maziere, and C. Carbon. Antimicrobial Agents and Chemotherapy 42,No. 11 2830 (1998).
[] I. Cloez-Tayarani, A. Cardonia, J. Rouselle, O. Massot, L. Edel-man, and G. Fillion, Proc. Natl. Acad. Sci.94, 9899 (1997). [] M. Lferde, Z. Lferde, M. Monnin et al, Nucl. Tracks Radiat.
Meas.8,497 (1984)
[] F. Pugliesi, V. Sciani, M. A. Stanojev Pereira, and R. Pugliesi, Braz. J. Phys.37,no. 2A, 446 (2007).
[] R. Pugliesi, M. A. Stanojev Pereira, M. A. P. V. de Moraes, and M. O. de Menezes, International Journal of Applied Radiations and Isotopes.50,375 (1997).
[] M. R. Hawkesworth, Atom. Energy Rev.152, 169 (1977).
[] http://physics.nist.gov/PhysRefData/Star/Text/ASTAR.html [] R. Ilic’ and M. Najzer, Nucl. Track Radiat. Meas. 17, 453
(1990a).
[] S. A. Durrani, R. K. Bull, Solid State Nuclear Track Detection. Principles, Methods and Applications. International Series in Natural Philosophy vol-111, Pergamon Press(1987).
[] M. A. Stanojev Pereira, PhD Thesis, IPEN-CNEN/SP (2008). [] R. Ilic’ and M. Najzer, Nucl. Track Radiat. Meas. 17, 461
(1990b).
[] R. Pugliesi, M. A. Stanojev Pereira, Nuc Instruments and Meth-ods in Physics Research(A),484, 613 (2002).
[] A. A. Harms and A. A. Zellinger, Phys. Med. Biol.22, n ˚ 1 70 (1977).
[] L. F. Belanger and C. J. Belanger, Biophysic. and Biochem. Cytol.6, No. 2, 197 (1959).