*e-mail: [email protected]
Received: 19 May 2014 / Accepted: 07 September 2014
Vertical force calibration of smart force platform using artifi cial
neural networks
Marcelo André Toso*, Herbert Martins Gomes
Abstract Introduction: The human body may interact with the structures and these interactions are developed through the application of contact forces, for instance due to walking movement. A structure may undergo changes in the dynamic behaviour when subjected to loads and human bodies. The aim of this paper is to propose a
methodology using Artii cial Neural Networks (ANN) to calibrate a force platform in order to reduce uncertainties
in the vertical Ground Reaction Force measurements and positioning of the applied force for the human gait.
Methods: Force platforms have been used to evaluate the pattern of applied human forces and to i t models
for the interaction between pedestrians and structures. The designed force platform consists in two force plates placed side by side in the direction of walking. The reference voltages applied to the Wheatstone bridge
were used for calibration as the input data to the ANN, while the output data were the estimated values of the
standard weights applied to the force platform. Results: It was presented a framework to enhance traditional
calibration methods for force platforms (vertical component) using an ANN. The use of ANN shows signii cant
improvements for the measured variables, leading to better results with lower uncertain values that are smaller than those using a simple traditional calibration. Conclusion: The results suggest that the calibration with
the ANN method may be useful in obtaining more accurate vertical Ground Reaction Forces and positioning
measurements in a force platform for human gait analysis.
Keywords Biomechanics, Force platform, Artii cial neural networks, Calibration.
Introduction
Several cases of excessive vibration of footbridges in vertical direction due to human-induced loads have
been reported (Kim et al., 2008; Zivanovic et al., 2010). The load due to a pedestrian acting on the
structure has been obtained from investigations in platforms, gait machines or even prototype footbridges, in which the applied force is that produced by a walking pedestrian. Force plates or platforms are devices designed to measure the forces exerted by a body in a contact surface usually called Ground
Reaction Forces (GRF). Accurate measurements
of GRF on force platforms are important in many areas of biomechanics’ research, mainly on those concerned with the magnitude of the applied force and its location. A traditional calibration method cannot completely access systematic errors mainly due to non-linear behaviour of the complete system that can cause, for example, different sensitivity along the service load/positioning ranges. In this case, an expert system that can manage the behaviour of the measurement system in all the service ranges is
desirable. In this context, Braga et al. (2007) state that an ANNs are parallel distributed processors consisting of processing units (neurons) that evaluate
mathematical functions to store knowledge and use
it. It is possible to learn general non-linear behaviour
from experimental data (inputs and output). Yasin and White (1999) presented a real-time procedure based on ANN acting as a i lter to predict the i nal values of weighting systems. Vasquez and Fonseca (2006) applied an ANN to calibrate load cells with strain gages. The ANN was used as an interpolation tool,
having as input, the reference voltage of a Wheatstone bridge. As output it was used directly the standard weight that generated the load cell deformation. The aim of this paper is to propose a methodology for calibrating a force platform in order to reduce the uncertainties in the values of measured vertical GRF and positioning of the applied force for the human gait. Different force levels are applied in a grid of points equally distributed along the plates
and then ANNs are used to perform the complete
system calibration.
Methods
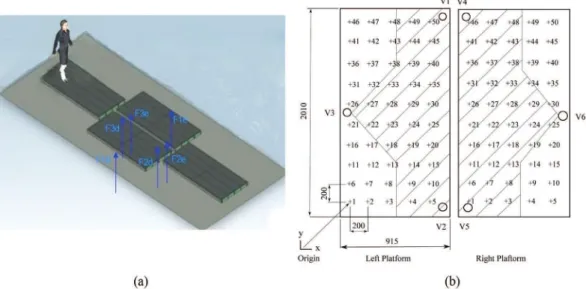
In the design of the used force platforms it was considered only vertical forces. Figure 1a shows two instrumented force plates and acceleration and
deceleration plates (these are not instrumented) used
Vertical force calibration of smart force platform using ANN
a schematic with the 50 points for load application during the calibration.
It was used six ring type load cells instrumented with strain gauges in a full Wheatstone bridge arrangement. Further details regarding the design and development of the force platform can be found
in (Toso et al., 2012). Using simple static equilibrium
equations it is possible to obtain the values of the resulting vertical force and positioning based on the
three load cells values (to each force platform) and
their x/y position.
Calibration of the force platform
It is well known that in order to obtain a better calibration result, an overall calibration of the whole system is preferable. This can be explained by the fact that at the time of assembling the components, structural as well electric changes may occur that may affect the overall behaviour. There will still be differences caused by random uncertainty that cannot be accessed by a usual
calibration method (to apply forces and measure
the corresponding voltages in each load cell and
positions and then use a linear least squares fit).
So, only systematic errors can be assessed by a calibration process. A simple linear calibration may not be able to assess the previous systematic errors in presence of non-linear behaviour. A more robust calibration is required. In this context,
ANNs are used to perform the calibration of the
complete system.
Results
Description of calibration procedure
It was draw 50 equally spaced grid point on each
platform (Figure 1b). These points served to apply the loads in a well-deined position that was used as
a parameter to calibrate the load positioning estimate.
Standard weights were used for calibration (gym
bell-hammer steel plates with accuracy of ± 0.1%, measured using a digital weight balance with accuracy
of ±0.1%). It was applied 24.8 kg and 44.7 kg standard
weights at all 50 points along the plate. Other four
weights 64.6/91.0/111.0/131.4 kg were applied in the region of interest (hatched region in Figure 1b).
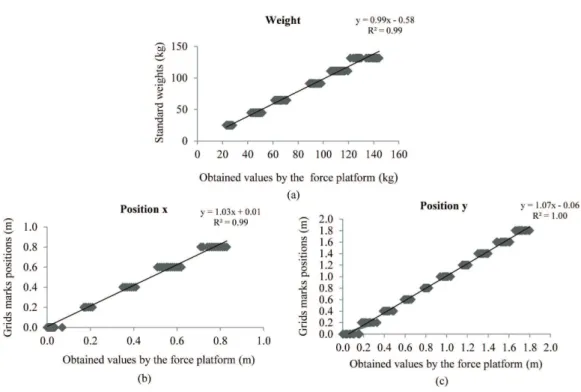
So, most of the data will be concentrated in the grid points in the hatched region, where the vertical load force likely will be applied. The data acquisition for the right platform follows the same procedure. In the following, the regression graphs corresponding to the calibration procedure are presented. Figure 2a considers the standard weights and the weight values
obtained with the force platform (using individual calibrations from the load cells), Figures 2b and 2c
consider the x and y position values respectively. These graphs correlate the position of grid points and the measured values obtained by the force platform.
The calibration of the right platform follows the
previously described procedure. Figure 3a considers
the standard weights and the obtained weight values
using the force platform. Figure 3b refers to the x
position of the right platform. It starts at 0.915 m due
Figure 1. a)Model of force platform for gait analysis, blue arrows means force reaction from load cells, b) Load application points for
calibration (plan view of the instrumented platforms, units in millimetres).
Rev. Bras. Eng. Bioméd., v. 30, n. 4, p. 406-411, dez. 2014
Figure 2. Calibration for the left platform: (a) standard weight vs weight-values by the platform, (b) x coordinate: grid marks vs obtained values by the platform, (c) y coordinate: grid marks vs obtained values by the platform.
Vertical force calibration of smart force platform using ANN
to the origin of the coordinate system (Figure 1b). Figure 3c considers y position values.
An important feature of the traditional calibration results is the calibration linearity, which can be
evaluated by the correlation coeficient (R). Both force platforms presented a correlation coeficient
greater than 0.99 for the traditional calibration. This shows a quite good linearity of the system, for both
weight measurements and (x, y) position values.
However random errors are present as indicated by the dispersion of values along load levels. The key idea is to improve the linearity even more and minimize the random error.
General steps for creation, analysis and validation of an ANN model
The ANN toolbox analysis software in MATLAB (2011) was used in this work. The following steps are needed to design, analyse and validate the ANN: (i) Data collection and separation in subsets: for the
training phase, 70% of the data were selected randomly
and the remaining 30% were divided between the
testing and validation. Input data values are the voltages
of each load cell. Target data (standard weights) are also used as expected outputs and the (x, y) coordinates as well; (ii) Coniguration of the ANN: number of
layers, neurons, etc. The best architecture found for weight estimates was composed of 4 layers with
10 neurons. Whereas for the (x, y) weight position estimates, the best architecture was that of 8 layers with 15 neurons. According to Haykin (2001) there are no clear rules to deine the number of layers, neurons,
training functions etc. These choices are made based on the engineering judgment about the problem and
later reined with the trial-and-error process. (iii)
Training: it was used the backpropagation training
algorithm with the standard algorithm
Levenberg-Marquardt to perform the training. This algorithm is used when the number of weights is not very high and it can achieve a lower error than the other
training algorithms (MATLAB, 2011). For both force
platforms, the set of training parameters were: epochs
(6 epochs), goal (0.001), learning rate mu (initial mu; 0.001). The performance function was the RMSE (Root Mean Squared Error). The transfer function
used was the tangent sigmoid in all layers, except for the last layer that used a linear transfer functions in order to get all range of real values of the weights and coordinate estimates. The processing time of the
ANN shows that its use is highly feasible, mainly in
real-time analysis, since once trained, it takes 10–5s to
predict force values and position. The training phase is performed off-line and in this case took about 10 s.
It was used an Intel Core i5-450M, 2.4 GHz personal
computer; (iv) Testing: during this step a set of test
data are used to measure network performance with
data that have not been previously seen by the ANN.
Estimated results for force and (x, y) coordinate positions obtained with ANN
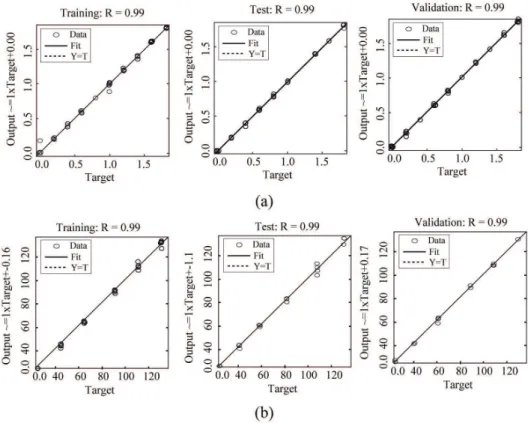
Figure 4 shows the results for the left platform considering training, testing and validation respectively:
a) x, y coordinate estimates, b) weight estimation.
The value of R is an indication of the correlation between predicted outputs data and measured outputs data. The same criteria to analyse the results were applied to the right platform. Figure 5 shows the results for the right platform considering training,
testing and validation respectively, a) x, y coordinate estimates, b) weight estimation.
The analyses presented correlation coeficients (R) greater than 0.99. Thus, it is concluded that the parameters (type of algorithm, number of neurons, training functions etc.) used in the architecture of ANN were consistent. Once obtained the previous presented parameters, the Root Mean Square Error (RMSE) was evaluated. The obtained results for the
left platform shows that for the weight estimation
the usual calibration method (previously described) generates a RMSE of 3.74 kg, whereas the RMSE decreased to 1.47 kg using the trained ANN. For the x position it is obtained a RMSE of 3.3 cm using
the traditional calibration method, whereas using
the calibrated ANN this value decreased to 1.9 cm. For the y coordinate the ANN decreases the RMSE from 4.9 cm to 1.6 cm. For the right platform the RMSE value related to weight estimation decreased from 3.10 kg to 1.12 kg using the trained ANN. For the x position it is obtained a RMSE of 2.2 cm using the traditional calibration method and a RMSE of 1.4 cm using the trained ANN. For the y coordinate estimate the RSME decrease from 2.6 cm to 1.4 cm using the trained ANN.According to Haykin (2001)
the forward evaluation of a sample by the trained multilayer perceptron can be easily stated in a recurrent
formulation as indicated by the Equation 1:
1
, , , 1, ,
1
( i )
n n j
i j i j k i k j i k
y f −W y− b
=
=+ ∑ (1)
Where i is the i-th layer, j is the j-th neuron, f j is
the activation function of the j-th layer, Wi,j,kis the weighting matrix for the input k, of the neuron j from layer i, bj,i is the bias of neuron j from layer i, yi-1,k is the output for neuron k from previous layer i-1 and
nni-1 is the number of neurons on the previous layer. The bias and weighting matrices are obtained using
the MATLAB software. These values are used to
obtain the calibration results.
Rev. Bras. Eng. Bioméd., v. 30, n. 4, p. 406-411, dez. 2014
Figure 4. Data correlation (R) of the artiicial neural network during training, testing and validation stages for the left platform: (a) x, y
coordinate estimates, (b) weight estimates.
Figure 5. Data correlation (R) of the artiicial neural network during training, testing and validation stages for the right platform: (a) x, y
Vertical force calibration of smart force platform using ANN
Discussion
In this paper, it was presented a framework to enhance traditional calibration methods for force platforms
using Artiicial Neural Networks (ANNs), considering
only vertical forces. It was presented the main steps
that should be considered to design such ANN to
predict the applied forces and coordinate positions in a system that aims to analyse the vertical human gait. The most of the points in the graphs away from the trend line were detected as being those not belonging to the hatched region in Figure 1b. These errors assume a random pattern related to the load level occurrence and affected regions. These differences were constant values, considering the same point of load application and they represent a systematic error
that can be treated. The application of an ANN to model gait variable relationships is often justiied by
the assumption that they can outperform conventional methods of analysis. From an engineering point of view, measurement errors should be avoided so, systematic errors are the most simple to be treated, but when it happens at different ranges of use of a measurement system, it cannot be assessed by simple calibration of the parts of the system, as in traditional methods.
Nonlinearities may occur in different regions of load
levels of the force platform that compromises the use of a simple calibration method, so it is necessary a
more robust system. That is the reason an ANN is
investigated in this paper. The full calibration of the force platform using several standard weights indicated a strong correlation between the measured variables and those predicted by traditional calibration
as expected but the use of ANN presented signiicant improvements for the measured variables (forces magnitude and x, y positioning) leading to better results with lower uncertain values (smaller than the results of a simple calibration method). The
presence of random uncertainty, systematic errors
and nonlinearities could be decreased by the ANN (used as a surrogate). This calibration methodology
was applied to force platforms, considering only vertical forces. However it is possible to use this
method to calibrate other load components (lateral and horizontal) as well as other measurement devices. New studies related to the use of the ANN also as an active ilter to minimize random errors is a topic
for future research. Other state of art techniques like
Kriging, and Response Surfaces are to be considered
in future research papers.
References
Braga AP, Carvalho AP, Bernarda LT. Artiicial neural
networks: theory and applications. 2nd ed. Rio de Janeiro:
LCT; 2007.
Haykin S. Neural networks. 2nd ed. Porto Alegre: Bookman;
2001.
Kim SH, Cho KI, Choi MS, Lim JY. Development of
human body model for the dynamic analysis of footbridges
under pedestrian induced excitation. Steel Structures. 2008; 8:333-45.
MATLAB version 7.11.0. Natick, Massachusetts: The
MathWorks Inc., 2011.
Toso MA, Gomes HM, Silva FT, Pimentel RL. A biodynamic model it for vibration serviceability in footbridges using
experimental measurements in a designed force platform for
vertical load gait analysis. In: 15th International Conference on Experimental Mechanics: Proceedings of the International Conference on Experimental Mechanics; 2012 July 22-27; Porto, Portugal. 2012. p. 1-13.
Vasquez H, Fonseca DJ. Calibration using artiicial neural networks. Journal of Engineering and Applied Sciences. 2006; 1(1):1-6.
Yasin SMTA, White NM. Application of artiicial neural
network to intelligent weighting systems. Science
Measurement and Technology. 1999; 146(6):265-9. http:// dx.doi.org/10.1049/ip-smt:19990679
Zivanovic S, Pavic A, Ingólfsson ET. Modelling spatially unrestricted pedestrian trafic on footbridges. Journal of Structural Engineering. 2010; 136(10):1296-1308. http:// dx.doi.org/10.1061/(ASCE)ST.1943-541X.0000226
Authors
Marcelo André Toso*, Herbert Martins Gomes
Mechanical Engineering Department, Federal University of Rio Grande do Sul, R. Sarmento Leite, 425, CEP 90050-170,
Porto Alegre, RS, Brazil
Rev. Bras. Eng. Bioméd., v. 30, n. 4, p. 406-411, dez. 2014