*e-mail: cffci [email protected]
Received: 18 March 2014 / Accepted: 20 July 2014
Proposing the novelty classii er for face recognition
Cicero Ferreira Fernandes Costa Filho*, Thiago de Azevedo Falcão, Marly Guimarães Fernandes Costa, José Raimundo Gomes Pereira
Abstract Introduction: Face recognition, one of the most explored themes in biometry, is used in a wide range of
applications: access control, forensic detection, surveillance and monitoring systems, and robotic and human machine interactions. In this paper, a new classii er is proposed for face recognition: the novelty classii er. Methods: The performance of a novelty classii er is compared with the performance of the nearest neighbor classii er. The ORL face image database was used. Three methods were employed for characteristic extraction: principal component analysis, bi-dimensional principal component analysis with dimension reduction in one dimension and bi-dimensional principal component analysis with dimension reduction in two directions. Results: In identii cation mode, the best recognition rate with the leave-one-out strategy is equal to 100%. In the verii cation mode, the best recognition rate was also 100%. For the half-half strategy, the best recognition rate in the identii cation mode is equal to 98.5%, and in the verii cation mode, 88%. Conclusion: For face recognition, the novelty classii er performs comparable to the best results already published in the literature, which further coni rms the novelty classii er as an important pattern recognition method in biometry.
Keywords Face recognition, Novelty classii er, K Nearest Neighbor, Principal Component Analysis.
Introduction
Face recognition, one of the most explored themes in biometry, is used in a wide range of applications: access control, forensic detection, surveillance and monitoring systems, and robotic and human machine interactions; therefore, it is a technology with high commercial value. Table 1 presents a literature review in the area of face recognition, showing the following details: publication year, authors, title, pre-processing, characteristic extraction, classii er and results.
A face recognition system generally comprises the following phases: image acquisition, pre-processing, characteristic extraction and classii cation.
The pre-processing phase aims at making a comparison possible between images of either different individuals or of the same individual taken at different moments. The following operations are commonly used in this phase: image size adjustment, eye centralization or gray-level scale adjustment. Sahoolizadeh et al. (2008) removed background information by reducing the image size to 40×40 pixels. In the study of Shermina (2011), aiming to correct luminance non-uniformity, a luminance normalization was employed.
Some authors (Le and Bui, 2011; Noushath et al., 2006; Oliveira et al., 2011; Yang et al., 2004, 2005; Zhang and Zhou, 2005), nevertheless, do not apply any pre-processing to the face image.
The majority of algorithms for characteristic extraction used in face recognition are based on
statistical methods: Principal Component Analysis (PCA) (Chan et al., 2010; Kirby and Sirovich, 1990; Perlibakas, 2004; Turk and Pentland, 1991); bi-dimensional PCA with dimension reduction in one direction (2DPCA) (Rouabhia and Tebbikh, 2011; Yang et al., 2004); bi-dimensional PCA with dimension reduction in two directions ((2D)2PCA) (Zhang
and Zhou, 2005); Linear Discriminant Analysis (LDA) (Belhumeur et al., 1997; Chan et al., 2010); bi-dimensional LDA with dimension reduction in one direction (2DLDA) (Yang et al., 2005) and bi-dimensional LDA with dimension reduction in two directions ((2D)2LDA) (Noushath et al., 2006).
In the classii cation step, the following methods have been published: K Nearest Neighbor (KNN) associated with Euclidian distance (Noushath et al., 2006; Yang et al., 2004, 2005; Zhang and Zhou, 2005), Neural Networks (NN) (MageshKumar et al., 2011) and Support Vector Machines (SVM) (Le and Bui, 2011; Oliveira et al., 2011).
This paper proposes using the novelty classii er for face recognition. The performance of the novelty classii er was compared with the performance of the KNN classii er. The ORL face image database was used. The following methods were used for characteristic extractions: PCA, 2DPCA and (2D)2PCA.
Costa F
ilho CFF
, F
alc
ão
TA, C
osta MGF
, P
er
eir
a JRG
Table 1. Brief literature review of face recognition.
Author(s) Title Database Pre-Processing Feature
extraction Classiier Accuracy
Yang et al. (2004)
Two-dimensional PCA: a new approach
to appearance-based face representation and
recognition
ORL, AR and Yale No Pixel + 2DPCA kNN ORL - 98.3% AR - 96.1% Yale - 84.24%
Zhang and Zhou (2005)
(2D)2PCA - Two-directional two-dimensional PCA
for eficient face representation and
recognition
ORL and FERET Image resize 60×60 Pixel + (2D)2PCA kNN FERET- 85%.ORL - 90.5%
Yang et al. (2005) discriminant transformfor Two-dimensional
face recognition ORL No Pixel + 2DLDA kNN ORL - 96.4%
Noushath et al. (2006) (2D)2LDA: An eficient approach for face
recognition ORL No Pixel + (2D)2LDA kNN ORL - 99.75%
MageshKumar et al. (2011)
Gabor features and LDA based Face Recognition
with ANN classiier ORL
Image resize to 128×128 with Gabor ilter
Coeficients of Gabor wavelet
transform + PCA+ LDA kNN and neural network
kNN - 99.75% neural network: 98.6%
Shermina (2011)
Illumination invariant face recognition using Discrete Cosine Transform and Principal
Component Analysis
Yale B normalization and Illumination
correction using DCT Pixel + PCA Not mentioned Yale B: 94.2%
Oliveira et al. (2011)
2D Principal Component Analysis for face and facial-expression
recognition
ORL, AR, Feret, Yale
and Jafe No Pixel + 2DPCA + Genetic algorithm kNN and SVM
ORL - 91.5% (KNN), 93.1% (SVM); FERET - 90% (SVM); YALE - 89.2%(SVM); AR - 92.1% (SVM) Jaffe - 94% (SVM).
Le and Bui (2011) Face recognition based on SVM and 2DPCA FERET and ORL Image resizing to 50×50 (FERET) Pixel + PCA + 2DPCA kNN and SVM
ORL - 97.3% (SVM), 96.2% (KNN); FERET - 95.1% (SVM),
90.1% (KNN).
Rev
. B
ras
. E
ng
. B
ioméd
., v
. 30, n. 4, p
. 301-311,
dez
. 2014
Br
az. J. Biom. E
ng
., 30(4), 301-311,
D
ec
. 2014
The methods section is devoted to presenting the database used, the novelty classiier, the methods used for characteristic extraction and details of how the experiments were conducted. The results section presents curves of recognition rate behavior with the number of principal components of the extraction characteristic methods. Tables with the best values of recognition rate are also shown. In the discussion section, the obtained results are compared with other results previously published in the literature and a brief discussion about novelty ilter behavior is included.
Methods
ORL Database
A performance comparison between different methods of face recognition is only possible because certain institutions and research groups provide face image databases on the Internet, which allow for standardization of indings. The most used databases are Yale, Yale B, ORL, AR, FERET and JAFFE.
In this paper, the ORL database was used (AT&T…, 2014). This database, released by Olivetti Research Laboratory, is comprised of 400 face images, each with a size of 92×112 pixels. The face images are of 40 individuals (36 men and 4 women) with 10 images for each individual. The ORL database was chosen because it offers a great variety of image types; the facial images of an individual were captured at different times with different conditions of illumination (originating on the right, left and center) and facial expression (normal, happy, sad, sleepy and closed eyes). All images were captured with a uniform background.
The original images of the ORL database were employed. No photometric or geometric pre-processing was performed.
Nearest Neighbor Classiier (KNN)
KNN is a method that classiies a sample based on k votes of the nearest objects in the characteristic space. If k = 1, the sample is classiied as belonging to the class of the nearest neighbor and the classiier method is called the nearest neighbor classiier (Theodoridis and Koutroumbas, 2009).
In this study, the distance used was the Euclidian distance, as shown in Equation 1:
( )
(
)
21 ,
=
= ∑m i− i i
d a b a b (1)
Where: a is the test image (ai is a pixel of image a) and b is an image of the training set (bi is a pixel of image b). Both images are projected in the subspace
generated by the method of characteristic extraction: m < n, n = number of pixels in the image.
Novelty classiier
The concept of a novelty ilter is used in the deinition of a novelty classiier. We describe the novelty ilter and next, the novelty classiier.
Novelty ilter concept
A novelty ilter is a type of auto-associative memory, proposed by Kohonen (1989). Its workings can be understood through the following steps: i) store familiar patterns in memory; ii) apply a given input to the memory input and retrieve the pattern that best matches the input from the memory; iii) deine the novelty as the difference between the given input and the retrieved pattern.
The approach used in this paper to calculate the novelty uses the concept of auto-associative memory as an orthogonal projection. In this case, the novelty ilter is submitted to a supervised training that uses the Gram-Schmidt orthogonalization method to produce a set of orthogonal vectors.
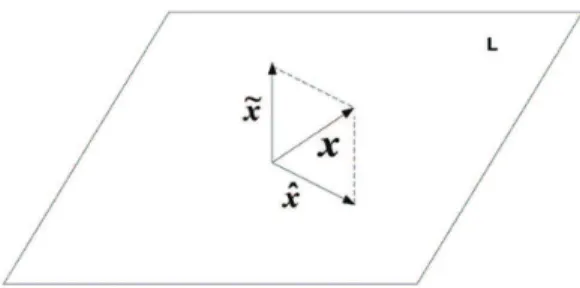
Consider a group of vectors {x1, x2,…, xm} ⊂ R n
forming a base that generates a subspace L ⊂ Rn, with
m < n. An arbitrary vector x ∈ Rn can be decomposed
in two components, ^x and ~x, where x is a linear ^
combination of vectors xk; in other words, ^x is the
orthogonal projection of x on subspace L and ~x is
the orthogonal projection of x on a subspace L ⊥
(orthogonal complement of L). Figure 1 illustrates the orthogonal projections of x in a tridimensional space. It can be shown through the projection theorem, that
~
x is unique and has a minimum norm. So, ^x is the
best representation of x in subspace L.
The ~x component of the vector can be thought of
as the result of an operation of information processing, with very interesting properties. It can be assumed that ~x is the residue remaining when the best linear
combination of the old patterns (vector base xk) is adjusted to express vector x. Thus, it is possible to say
Figure 1. Illustration of a novelty ilter concept using the
Costa Filho CFF, Falcão TA, Costa MGF, Pereira JRG
that ~x is the new part of x that is not explained by the
old patterns. This component is named novelty and the system that extracts this component from x can be named the novelty ilter. The vector base xk can be understood as the memory of the system, while x is a key through which information is associatively searched in the memory.
It can be shown that the decomposition of an arbitrary vector x ∈ Rn in its orthogonal projections ^
x ∈L⊂ Rn and ~x ∈ L ⊥ can be obtained from a
linear transformation, using a symmetric matrix P, so x = P.x and ^ ~x = (I – P).x. The matrix P is named
the orthogonal projector operator in L (P is named the novelty ilter), and (I – P) is the orthogonal projector in subspace L ⊥.
Consider a matrix X with x1,x2,...,xk, with k < n
as its columns. Suppose that the vectors xi∈ R n,
i = 1,2,...,k span the subspace L. As cited above, the decomposition of x = ^x + ~x is unique and ~x can be
determined through the condition that it is orthogonal to all columns of X. In other words:
0 T
x ⋅X = (2)
The Penrose (1955) solution to Equation 2 is given by:
(
)
T T
x =y I− ⋅X X+ (3)
Where:
y is a vector with the same dimension of ~x and X+ is
the pseudo-inverse matrix of X.
Using the properties of symmetry and idempotence of the pseudo-inverse matrix, it follows that:
(
)
T T
x ⋅ = ⋅ − ⋅x x I X X+ (4)
(
)
2T T T
x ⋅ =x x ⋅ =x y ⋅ − ⋅I X X+ (5)
Comparing Equations 4 and 5, it follows that y = x. So ~x can be written as:
(
)
x= − ⋅I X X+ ⋅x (6)
Because ~x is unique, it follows that: I – P = I – X⋅X+
and P = X⋅X+.
When working with images, the calculation of projection matrix P becomes an immense and time-consuming computational task because of the dimensions involved. Each column of matrix X is a reference pattern or, in neural network terminology, a training vector. A vector such as this is constructed by stacking the image columns. For example, with images of 128×128 pixels, the dimension of the column vector is n = 16,384 and
the dimension of the X matrix is n × N, where N is the number of training vectors (images). Thus, in this case, P results in a square matrix with dimensions of 16,384. Thus, it is preferable to obtain the novelty ~x through an iterative
technique based on the classical Gram-Schmidt orthogonalization method. This method results in the creation of a base of vectors that are mutually orthogonal, {h1, h2,..., hn} ∈ Rn, from the training
vectors, {x1, x2,…, xn} ∈ Rn.
To build a base of mutually orthogonal vectors, a direction is irst chosen; for example, the direction x1, so:
h1 = x1 (7)
In the sequence, this expression is used:
1
1 2
,
, 2, 3,
k j
k j
k k j
j
x h
h x h for k m
h − =
=
− ∑ ⋅ = … (8)
Where:
〈xk,hj〉 is the inner product of xk and hj.
The way that vectors hj are constructed, it follows that the set {h1, h2,..., hn} spans the same subspace as the set {x1, x2,…, xn}.
Given a sample x, to obtain the novelty ~x, it
is necessary to continue the process described by Equation 7 one step more: ~x = h
n+1.
Binary and multiclass classiiers using novelty ilters
Differing from neural networks, the training set of a novelty ilter consists only of sample vectors that belong to a given class.
Suppose that the training set consists of the vectors set, {x1,x2,x3,...,xn}, belonging to a given
class. The training step consists in obtaining the set, {h1,h2,h3,...,hn}, according to Equation 8. It should be noted that, before submitting the input vectors to the Gram-Schmidt orthogonalization method, they should be normalized. Figure 2a shows the block diagram of a unary classiier training using the novelty ilter.
Figure 2b shows a block diagram of a unary classiier using a novelty ilter. For classifying a sample, the Gram-Schmidt orthogonalization process is run as shown according to Equation 8, generating a novelty vector ~x
1. In the sequence, the novelty
vector norm is extracted and compared to a decision threshold value.
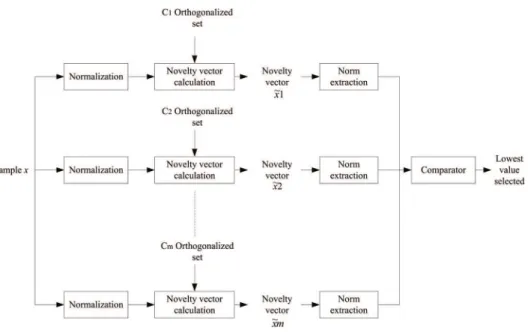
Figure 2c shows a block diagram of a multiclass classifier using novelty filters. For classifying a sample, the Gram-Schmidt orthogonalization process is run as shown for each one of the classifiers Ci, according to Equation 8, thus generating a set of Rev. Bras. Eng. Bioméd., v. 30, n. 4, p. 301-311, dez. 2014
novelty vectors {~x 1,
~x
2,…,~xn}, one for each
classifier Ci. In the sequence, the novelty vectors norms are extracted and their magnitudes are compared. The one with the lowest value defines the class to which the sample belongs. This multiclass classifier requires training m classifiers and uses all of them in the classification task.
The authors used the novelty classiier concept in some previous works (Costa and Moura, 1995; Costa Filho et al., 2013; Melo et al., 2014). In the irst, the novelty classiier is applied to natural gas leak detection. In the second, the novelty classiier is applied to iris recognition and in the last one, the novelty classiier is applied to cancer diagnostics in scintmammographic images.
Characteristic extraction
As stated earlier, three methods were used for characteristic extraction of face images from the ORL database: PCA, 2DPCA and (2D)2PCA.
PCA is deined as the task of inding a sub-space in such a way that the variance of the orthogonal data projections in it is maximized (Hotelling, 1993). This sub-space is called the principal sub-space. Consider X = {x1,x2,…,xN} a set of original data and S the covariance matrix given by Equation 9:
(
) (
)
1
1 N T
n n n
S x x x x
N =
= ∑ − ⋅ − (9)
To maximize the criteria given in the preceding paragraph, the projection of a vector xi in the principal subspace is given by Equation 10:
T
pi i
x =U ⋅x (10)
Matrix U if given by Equation 11:
[
1, 2,..., m]
U= u u u (11)
Where: u1,u2,...,um are auto-vectors that correspond to the highest auto-values of covariance matrix S. If the original vector xi is dx1, the dimension of the
projected vector is mx1. Each one of the m vectors is called a principal component. The dimensional reduction occurs because m < d. The lower the
number of auto-vectors in matrix U, the higher the dimensional reduction.
To apply the PCA method with images, it is necessary that a 2D image be converted into a 1D vector. Therefore, the vector dimension is very high, which generates a high dimensional covariance matrix S, rendering it dificult to ind its auto-vectors.
The 2DPCA method, proposed by Yang et al. (2004) solves this problem. In this technique, the covariance matrix is given by Equation 12:
Costa Filho CFF, Falcão TA, Costa MGF, Pereira JRG
(
) (
)
1
1 N T
i
H i i
G A A A A
N =
= ∑ − ⋅ − (12)
Where:
Ai → ith image of a set with N mxn images A → average image
GH → (nxm)(mxn) → nxn
Matrix U projects the original image aiming to maximize the projected covariance image, according to Equation 13:
Api = Ai⋅U (13)
Matrix U if given by Equation 14:
U = [u1,u2,...,uq] (14)
Where: u1,u2,...,uq are auto-vectors that correspond to the highest auto-values of covariance matrix GH. If the original matrix A is mxn, the dimension of the projected matrix Api is mxq. The dimensional reduction occurs because q < n. The lower the number of auto-vectors
in matrix U, the higher the dimensional reduction. The 2D2PCA method, proposed by Zhang e Zhou
(2005), reduces the original image dimension in both horizontal and vertical directions. This method consists of inding two projection matrices, as shown in Equation 15:
U = [u1,u2,...,uq] e V = [v1,v2,...,vd] (15)
Matrix U is used to reduce dimensions in the horizontal direction and is the same one determined in the 2DPCA method. Matrix V is used to reduce dimensions in the vertical direction and is given in Equation 16:
(
)(
)
1
1 N T
i
V i i
G A A A A
N =
= ∑ − − (16)
Matrix V projects the original image and aims to maximize the projected covariance image, according to Equation 17:
Api = VTAi (17)
Matrix V if given by Equation 18:
V = [v1,v2,...,vr] (18) Where: v, v2,...,vr are auto-vectors that correspond to the highest auto-values of covariance matrix GV. If the original matrix A is mxn, the dimension of the projected matrix Api is rxm. The dimensional reduction occurs because r < m. The lower the number of auto-vectors in matrix U, the higher the dimensional reduction. The inal projected image is given by Equation 19:
Afpi = VTAiU (19)
The dimension of Afpi is rxq.
In this work, for testing the novelty classiier and the KNN classiier, the number of principal components of each one of these methods was varied. For the PCA method, the number of components varied between 0 and 360, in steps of 1. For the 2DPCA method, the matrix components varied between 112×2 and 112×20, in steps of ×1. For the (2D)2PCA method, the
matrix components varied between 5×5 and 30×30, in steps of 5×5.
Because the novelty classiier uses vectors as inputs, the matrices resulting from the 2DPCA and (2D)2PCA methods were converted into vectors.
Experiments
To compare the performance of the multiclass novelty classiier with the performance of the KNN classiier, two training-test strategies were used: half-half and leave-one-out (Sonka and Fitzpatrick, 2000).
The experiments were performed both in identiication and veriication modes. In identiication mode, a biometric sample is compared with the models of individuals previously registered in the biometric database. The system can provide two answers: a list of k individuals with the most similarities to the sample or an indication that the sample is not registered in the biometric database. If the list contains only one individual, then the recognition is said to be rank-1. If the list contains k individuals, the recognition is said to be rank-k.
In veriication mode, an individual communicates a particular identity to the biometric system. Veriication consists of comparing this identity with the same one previously registered in the biometric database. If, according to a given criteria, the comparison results are positive, the individual identity is accepted as true and the individual is considered genuine. Otherwise, the individual identity is not accepted as true and the individual is considered an impostor.
The following recognition rate was used to evaluate classiiers (Jain et al., 2011):
Number of recognized faces Recognition Rate
Number of testing faces
= (9)
For identiication mode, curves were obtained showing the behavior of the rank-1 recognition rate versus the number of principal components of the characteristic extraction methods.
For veriication mode, curves were obtained showing the behavior of the recognition rate versus the number of principal components of the characteristic extraction methods, using a false acceptance rate (FAR) of 0.1%. FAR is deined as the probability of classifying an impostor as genuine. The False Rejection Rev. Bras. Eng. Bioméd., v. 30, n. 4, p. 301-311, dez. 2014
Rate (FRR) is deined as the probability of classifying a genuine as an impostor. A smaller FAR indicates a lower probability of an impostor being accepted as genuine. Biometric systems prefer a lower FAR. In veriication mode, the equivalent error rate was also calculated and was deined as the intersection point of the two probability distributions of FAR and FRR.
For both modes, we presented the best results for the recognition rate of half-half and leave-one-out training-test strategies (Sonka and Fitzpatrick, 2000).
In the half-half strategy, the novelty ilter training set of each individual was comprised of half of the images (5 images). The other half was used for testing. The testing set for each individual was comprised of genuine and impostor images, 5 and 195 images, respectively. There was no superposition between training and test sets. The experiment was repeated 10 times with different training and testing sets.
In the leave-one-out strategy, the novelty ilter training set of each individual was comprised of 9 images. The tenth image was used for testing. The testing set was comprised of genuine and impostor images, 1 and 39 images, respectively. As there were ten images per individual, the training and testing were repeated 10 times.
These strategies are the most commonly used in the literature. Their choice allows a comparison of the results obtained in this work with results of other previously published work.
Results
Figure 3 shows, for both classiiers, curves of rank-1 recognition rates versus number of principal components for identiication mode using the three methods of characteristic extraction: PCA, 2DPCA and (2D)2PCA.
In the curves showing PCA results, the horizontal axis dimension, corresponds to the m dimension (number of principal components) of the matrix components given in Equation 11. In the curves showing 2DPCA results, the horizontal axis corresponds to the q dimension (number of principal components) of the matrix components given in Equation 14. In the curves showing 2D2PCA results, the horizontal
axis corresponds to the q or r dimension because q = r (number of principal components) of the matrix components given in Equation 19.
Table 2 shows the best performance of both classiiers in identiication mode. As noted, both classiiers present a higher rank-1 recognition rate with the leave-one-out training-test strategy.
Figure 4 shows, for both classiiers, recognition rate versus number of principal components for veriication
mode using the three methods of characteristic extraction: PCA, 2DPCA and (2D)2PCA.
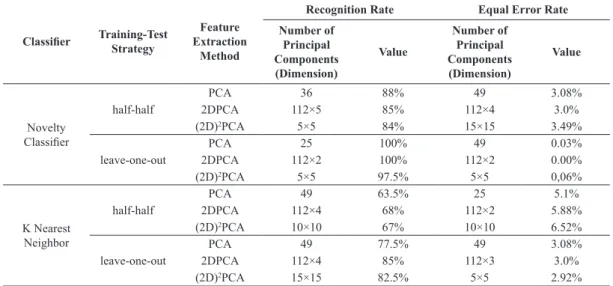
Table 3 shows the best performance of both classiiers in veriication mode, with FAR = 0.1%.
Concerning the time each classiier takes to classify a sample, we observed that the KNN classiier is faster than the novelty classiier. For classifying 200 samples, using the 2DPCA method, the KNN classiier with a 112x5-matrix feature, takes approximately 1648 milliseconds, while a novelty classiier takes approximately 1765 milliseconds. This test was made using a computer with an i5-2540M 2.6GHz Processor, running Matlab 2012.
Discussion
The results of Figure 3 showed that, for PCA and (2D)2PCA, the recognition rate for identiication mode stabilizes with a lower number of principal components, 10 and 25 (5×5), respectively. For 2DPCA, however, the recognition rate has unstable behavior with increasing principal components. As shown in Figure 4, similar behavior is observed for veriication mode. In both modes, using the same number of principal components, the performance of the novelty classiier is better than the performance of the KNN classiier.
The results in Tables 2 and 3 show that, for both identiication and veriication modes, the best recognition rate of the novelty classiier occurs with the leave-one-out strategy and, similar to what was observed in the last paragraph, the performance of the novelty classiier is better than the performance of the KNN classiier. In identiication mode, the recognition rate with the leave-one-out strategy is equal to 100% with PCA, 2DPCA and (2D)2PCA.
These results were obtained with the corresponding principal components matrices: PCA - 25×1, 2DPCA - 112×2 and 2D2PCA - 5×5. In veriication
mode, the recognition rate is 100% with PCA and 2DPCA and 97.5% with (2D)2PCA. These results
were obtained with the corresponding principal components matrices: PCA - 144×1, 2DPCA - 112×8 and 2D2PCA - 10×10. For the half-half strategy,
the best recognition rate in the identiication mode was obtained with (2D)2PCA (98.5%), and, in the
veriication mode, with PCA (88%).
Costa Filho CFF, Falcão TA, Costa MGF, Pereira JRG
Figure 3. Rank-1 recognition rate versus number of principal components. (a) PCA; (b) 2DPCA; (c) 2D2PCA. NC – Novelty Classiier; 5-5 – half-half training-test strategy; 9-1 – leave-one-out training-test strategy.
Table 2.Rank-1 best recognition rate of both classiiers in identiication mode.
Classiier Training-Test Strategy Extraction MethodFeature Number of Principal Components
(Dimension)
Value
Novelty Classiier
half-half
PCA 144 97.5%
2DPCA 112×8 97.5%
(2D)2PCA 10×10 98.5%
leave-one-out
PCA 25 100%
2DPCA 112×2 100%
(2D)2PCA 5×5 100%
K Nearest Neighbor
half-half
PCA 112 80%
2DPCA 112×4 84.5%
(2D)2PCA 20×20 78%
leave-one-out
PCA 121 87.5%
2DPCA 112×2 87.5%
(2D)2PCA 15×15 85%
component matrix of 27×26. The dimensions of this last matrix are very different from the dimensions 5×5 and 10×10, which were determined in this work using the 2D2PCA method for identiication and veriication
modes, respectively.
Comparing the results of this work with previously published results using the ORL database and shown previously (Table 1), we observed that the novelty classiier shows results comparable with the best results published in the literature Rev. Bras. Eng. Bioméd., v. 30, n. 4, p. 301-311, dez. 2014
Figure 4. Recognition rate versus number of principal components for veriication mode. (a) PCA; (b) 2DPCA; (c) (2D)2PCA. NC – Novelty
Classiier; 5-5 – half-half training-test strategy; 9-1 – leave-one-out training-test strategy.
Table 3. Best recognition rate of both classiiers in veriication mode with FAR = 0.1%.
Classiier Training-Test Strategy Extraction Feature
Method
Recognition Rate Equal Error Rate
Number of
Principal Components (Dimension)
Value
Number of
Principal Components (Dimension)
Value
Novelty Classiier
half-half
PCA 36 88% 49 3.08%
2DPCA 112×5 85% 112×4 3.0%
(2D)2PCA 5×5 84% 15×15 3.49%
leave-one-out
PCA 25 100% 49 0.03%
2DPCA 112×2 100% 112×2 0.00%
(2D)2PCA 5×5 97.5% 5×5 0,06%
K Nearest Neighbor
half-half
PCA 49 63.5% 25 5.1%
2DPCA 112×4 68% 112×2 5.88%
(2D)2PCA 10×10 67% 10×10 6.52%
leave-one-out
PCA 49 77.5% 49 3.08%
2DPCA 112×4 85% 112×3 3.0%
(2D)2PCA 15×15 82.5% 5×5 2.92%
with both the leave-one-out strategy and the half-half strategy. The results obtained with the KNN classiier in this work, however, were worse than those obtained with the novelty classiier and worse
than others previously obtained in the literature, as shown in Table 1.
Costa Filho CFF, Falcão TA, Costa MGF, Pereira JRG
excellent generalization capability, even with a low number of samples in the training set. In a previous work (Costa Filho et al., 2013), when the novelty classiier was used for iris recognition, the training sets consisted of 3 or 4 iris images. In this work, with the half-half strategy, the training set consists of 5 images. In both, excellent classiication rates were obtained, showing a robust generalization capability.
Although the recognition rates obtained with the novelty classiier in this work are higher, some errors occur. Figure 5 shows an error that occurs in identiication mode. Figure 5a shows ive images of the novelty ilter base of individual A. Figure 5b shows ive images of the novelty ilter base of individual B. Figure 5c shows an image sample of individual A presented to the novelty classiier. This sample image was recognized by the novelty classiier as belonging to individual B and not to individual A. The novelty value of this sample related to the novelty ilters of individual A and B was 2111.82 and 2024.23, respectively. Observing the images of both bases and the sample image, there is no reason for this erroneous recognition. A more detailed study must be conducted for a deeper understanding of the novelty ilter classiier behavior.
Future work will address the use of other extraction characteristic techniques as we apply the novelty classiier to face recognition in other face databases cited in this work.
References
AT&T Laboratories Cambridge. The ORL Database of Faces [internet]. Cambridge: AT&T Laboratories Cambridge; 2014. [cited 2014 Feb 18]. Available from: http://www.cl.cam. ac.uk/research/dtg/attarchive/facedatabase.html.
Belhumeur P, Hespanha J, Kriengman D. Eigenfaces vs. isherfaces: recognition using class speciic linear projection. IEEE Transaction on Pattern Analysis and Machine Intelligence. 1997; 19(7):711-20. http://dx.doi. org/10.1109/34.598228
Chan L, Salleh SH, Ting CM. Face biometrics based on principal component analysis and linear discriminant analysis. Journal of Computer Science. 2010; 6(7):693-9. http://dx.doi.org/10.3844/jcssp.2010.693.699
Costa MGF, Moura L. Automatic assessment of scintmammographic images using a novelty filter. Proceedings of the 19th Annual Symposium on Computer Applications in Medical Care. 1995:537–41. PMid:8563342 PMCid:PMC2579151
Costa Filho CFF, Pinheiro CFM, Costa MGF, Pereira WCA. Applying a novelty ilter as a matching criterion to iris recognition for binary and real-valued feature vectors. Signal, Image and Video Processing. 2013; 7(2):287-96. http://dx.doi.org/10.1007/s11760-011-0237-5
Hotelling, H. Analysis of complex statistical variables into principal components. Journal of Educational Psychology, 1993; 24 (6): 417-41.
Jain AK, Ross AA, Nandakumar K. Introduction to biometrics. New York: Springer-Verlag; 2011. http://dx.doi. org/10.1007/978-0-387-77326-1
Kirby M, Sirovich L. Application of the KL procedure for the characterization of human faces. IEEE Transactions on Pattern Analysis and Machine Intelligence. 1990; 12(1):103-8. http://dx.doi.org/10.1109/34.41390
Kohonen T. Self-organization and associative memory. New York: Springer-Verlag; 1989. PMid:2562047. http:// dx.doi.org/10.1007/978-3-642-88163-3
Le TH, Bui L. Face recognition based on SVM and 2DPCA. International Journal of Signal Processing, Image Processing and Pattern Recognition. 2011; 4(3):85-94.
MageshKumar C, Thiyagarajan R, Natarajan SP, Arulselvi S, Sainarayanan G. Gabor features and LDA based face recognition with ANN classiier. International Conference on Emerging Trends in Electrical and Computer Technology (ICETECT). 2011:831-6.
Melo RO, Costa MGF, Costa Filho CFF. Using digital image processing and a novelty classiier for detecting natural gas leaks. In: Chen L, Kapoor S, Bhatia R, editors. Intelligent systems for science and information: extended and selected results from the Science and Information Conference 2013. New York: Springer International Publishing; 2014. p. 409-22. (Studies in computational intelligence, 542).
Noushath S, Kumat, GH, Shivakumara P. (2D)²LDA: An efficient approach for face recognition. Pattern Recognition. 2006; 39:1396-400. http://dx.doi.org/10.1016/j. patcog.2006.01.018
Figure 5. (a) Five images of novelty ilter base of individual A;
(b) Five images of novelty ilter base of individual B; (c) Sample image of individual A, which was recognized by the novelty classiier as belonging to individual B.
Oliveira L, Mansano M, Koerich A, Britto, AS Jr. 2D principal component analysis for face and facial-expression recognition. Computing in Science and Engineering. 2011; 13(3):9-13. http://dx.doi.org/10.1109/MCSE.2010.149
Penrose R. A generalized inverse for matrices. Proceedings of the Cambridge Philosophy Society. 1955; 51:406-13. Perlibakas V. Distance measures for PCA-based face recognition. Pattern Recognition Letters. 2004; 25(6):711-24. http://dx.doi.org/10.1016/j.patrec.2004.01.011 Rouabhia C, Tebbikh H. Eficient face recognition based on weighted matrix distance metrics and 2DPCA algorithm. Archives of Control Sciences. 2011; 21(2):207-21. http:// dx.doi.org/10.2478/v10170-010-0040-5
Sahoolizadeh AH, Heidari BZ, Dehghani CH. A new face recognition method using PCA, LDA and neural network. World Academy of Science, Engineering and Technology. 2008; 17:7-12.
Shermina J. Illumination invariant face recognition using discrete cosine transform and principal component analysis. International Conference on Emerging Trends in Electrical and Computer Technology (ICETECT). 2011:826-30.
Sonka M, Fitzpratick JM. Handbook of medical imaging. Volume 2: Medical Imaging Processing and Analysis. Washington: Spie Press; 2000.
Theodoridis S, Koutroumbas K. Pattern recognition. 4th ed. Oxford: Elsevier Academic Press; 2009.
Turk M, Pentland A. Eigenfaces for recognition. Journal of Cognitive Neuroscience. 1991; 3(1):71-86. PMid:23964806. http://dx.doi.org/10.1162/jocn.1991.3.1.71
Yang J, Zhang D, Frangi AF, Yang J-Y. Two-dimensional PCA: a new approach to appearance-based face representation and recognition. IEEE Transactions on Pattern Analysis and Machine Intelligence. 2004; 26(1):131-7. PMid:15382693. http://dx.doi.org/10.1109/TPAMI.2004.1261097
Yang J, Zhang D, Yong X, Yang J-Y. Two-dimensional discriminant transform for face recognition. Pattern Recognition. 2005; 38(7):1125-9. http://dx.doi.org/10.1016/j. patcog.2004.11.019
Zhang D, Zhou Z-H. (2D)²PCA: Two-directional two-dimensional PCA for eficient face representation and recognition. Neurocomputing. 2005; 69:224-31. http:// dx.doi.org/10.1016/j.neucom.2005.06.004
Authors
Cicero Ferreira Fernandes Costa Filho*, Marly Guimarães Fernandes Costa
Centro de Tecnologia Eletrônica e da Informação – CETELI, Universidade Federal do Amazonas – UFAM, Av. General Rodrigo Otávio Jordão Ramos, 3000, Aleixo, Campus Universitário, Setor Norte, Pavilhão Ceteli, CEP 69077-000, Manaus, AM, Brasil.
Thiago de Azevedo Falcão
Instituto Nokia de Tecnologia, Manaus, AM, Brasil.
José Raimundo Gomes Pereira