Length–weight regressions of the microcrustacean
species from a tropical floodplain
Regressões peso-comprimento das espécies de microcrustáceos em
uma planície de inundação tropical
Fábio de Azevedo1, Juliana Déo Dias2,
Louizi de Souza Magalhães Braghin2 and Cláudia Costa Bonecker2
1Colegiado de Ciências, Universidade Estadual do Paraná – UNESPAR, Campus Fafipa,
Av. Gabriel Esperidião, s/n, CEP 87703–000, Paranavaí, PR, Brazil e-mail: [email protected]
2Programa de Pós-graduação em Ecologia de Ambientes Aquáticos Continentais,
Núcleo de Pesquisas em Limnologia, Ictiologia e Aquicultura – NUPELIA, Universidade Estadual de Maringá – UEM,
Av. Colombo, 5790, CEP 87020–900, Maringá, PR, Brazil
e-mail: [email protected]; [email protected]; [email protected]
Abstract: Aim: This study presents length–weight regressions adjusted for the most representative microcrustacean species and young stages of copepods from tropical lakes, together with a comparison of these results with estimates from the literature for tropical and temperate regions; Methods: Samples were taken from six isolated lakes, in summer and winter, using a motorized pump and plankton net. The dry weight of each size class (for cladocerans) or developmental stage (for copepods) was measured using an electronic microbalance; Results: Adjusted regressions were significant. We observed a trend of under-estimating the weights of smaller species and overestimating those of larger species, when using regressions obtained from temperate regions; Conclusion: We must be cautious about using pooled regressions from the literature, preferring models of similar species, or weighing the organisms and building new models.
Keywords: dry weight, cladocerans, copepods, biomass, secondary productivity.
Resumo: Objetivo: Este estudo apresenta as regressões peso-comprimento elaboradas para as espécies mais representativas de microcrustáceos e formas jovens de copépodes em lagos tropicais, bem como a comparação desses resultados com as estimativas da literatura para as regiões tropical e temperada; Métodos: As amostragens foram realizadas em seis lagoas isoladas, no verão e no inverno, usando moto-bomba e rede de plâncton. O peso seco de cada classe de tamanho (para cladóceros) e estágio de desenvolvimento (copépodes) foi medido em microbalança eletrônica; Resultados: As regressões ajustadas foram significativas. Observamos uma tendência em subestimar o peso das espécies de menor porte e superestimar as espécies de maior porte, quando se utiliza regressões peso-comprimento obtidas para a região de clima temperado; Conclusão: Devemos ter cautela no uso de regressões peso-comprimento existentes na literatura, preferindo modelos para as mesmas espécies, ou pesar os organismos e construir os próprios modelos.
floodplain, and to evaluate whether there are significant differences between the results of this work and those presented in the literature for the same species in tropical and temperate regions.
2. Methods
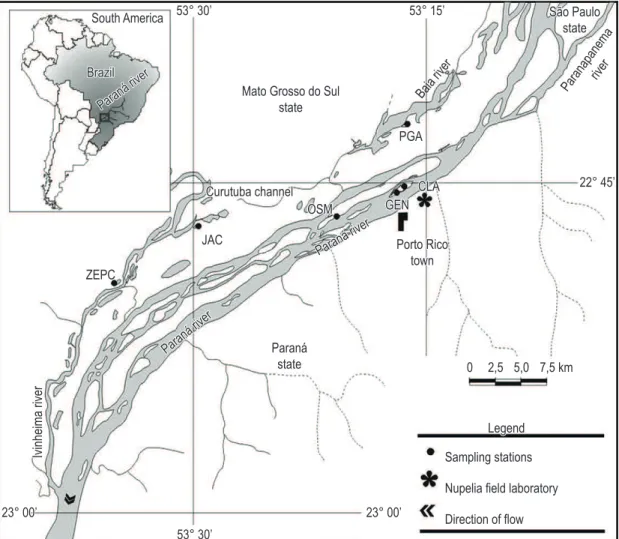
The study was undertaken on six lakes (Clara, Genipapo, Osmar, Jacaré, Zé do Paco and Pousada das Garças) located on the Upper Paraná River floodplain, in the states of Paraná and Mato Grosso do Sul, Brazil (Figure 1). The main environmental features of these lakes are presented in Table 1.
Microcrustacean samples were collected in the subsurface pelagic region of each lake, using a motorised pump to filter 600 L of water per sample through a plankton net of 68 µm mesh size, in winter (August 2000) and summer (February 2001). However, regressions were only calculated for a particular species for the periods and lakes in which they occurred. All the organisms used in the regressions were fixed in formaldehyde (4%) and buffered with calcium carbonate. We did not perform corrections for organism preservation, in agreement with Omori (1978). The samples were preserved for at least six months before analysis.
Individuals were separated into size classes (mm), which varied according to the cladoceran and copepod species, but obeyed the maximum intervals suggested by Bird and Praire (1985). Length measurements were obtained using a micrometer reticule and objective lens (×10 magnitude) in an optical microscope, with an accuracy of 10 µm. For the cladocerans, the body length was considered to be the distance between the superior extremity of the head, without the helmet, and the end of the carapace, without the spine (Hardy, 1989), except for Daphnia gessneri, whose superior limit was considered as the superior portion of the eye. For the copepods, the body length was considered to be the distance between the head and the last abdominal segment.
Following measurement, the zooplankton organisms were washed in running tap water, rinsed at least three times in distilled water and placed on pre-weighed and pre-dried aluminium boats. In a laboratory, the organisms were dried at 60 °C for 24 hours (Wetzel and Likens, 1991) and then cooled in desiccators for at least 2 hours. Eggs and embryos were removed from the individuals before the weighing. A variable number of individuals of each species (minimum of 5 µg per size class; Dumont et al., 1975) were weighed using a Sartorius Supermicro-54 (0.1 µg accuracy) microanalytical
1. Introduction
The establishment of length–weight regressions are fundamental when determining the biomass of aquatic communities and also in most studies of food web interactions and secondary productivity (Edmondson and Winberg, 1971; McCauley, 1984; Castilho-Noll and Arcifa, 2007; Ghidini and Santos-Silva, 2009), which contribute to our knowledge of how aquatic ecosystems function. For microcrustaceans (cladocerans and copepods), weight estimates from length–weight regressions have been the most frequently used technique employed to approximate the biomass of these organisms. Furthermore, an accurate measurement of biomass is necessary to understand the structure and dynamics of biological communities (Bird and Praire, 1985).
Studies carried out by Dumont et al. (1975) and Bottrell et al. (1976) presented an extensive list of length–weight relationships for freshwater zooplanktonic species in temperate regions and illustrated significant differences that may occur in the regression parameters of a single species. These differences may be due to geographical distribution, different habitat types, temperature, and food availability and composition (Michaloudi, 2005). There may also be differences between planktonic and non-planktonic species.
In tropical regions, mainly Brazil, there are few studies that discuss length–weight regressions for microcrustaceans (Maia-Barbosa and Bozelli, 2005; Santos et al., 2006; Castilho-Noll and Arcifa, 2007) and biomass (Rocha and Tundisi, 1984; Matsumura-Tundisi et al., 1989; Blettler and Bonecker, 2006; Melão and Rocha, 2006; Sendacz et al., 2006; Bonecker et al., 2007; González et al., 2008). Length–weight regressions based on the population parameters of species from temperate regions differ from those obtained in tropical regions, primarily in relation to zooplankton body size, which tends to be smaller in tropical regions (Saint-Jean and Bonou, 1994).
Blettler and Bonecker (2006) argued that the lack of studies with data on planktonic microcrustaceans is related to difficulties in determining the organisms’ dry weight. This fact may be associated with a lack of suitable equipment, due to the high costs and time required to obtain the data and to the absence of specific regressions for tropical species.
Daphnia gessneri Herbst, 1967, Macrothrix squamosa Sars, 1901, Diaphanosoma spinulosum Herbst, 1 9 6 7 , Mo i n a m i n u t a ( Ha n s e n , 1 8 9 9 ) ,
Arg yrodiaptomus azevedoi (Wright, 1935),
Notodiaptomus amazonicus (Wright, 1935),
balance (10–7 gscale). For more detailed methods, see Blettler and Bonecker (2006).
The most representative microcrustacean species in the lakes were Bosmina hagmanni Stingelin, 1904, Ceriodaphnia cornuta Sars 1886,
Figure 1. Location of the lakes sampled on the Upper Paraná River floodplain, in the states of Paraná and Mato Grosso do Sul, Brazil (CLA = Clara Lake, GEN = Genipapo Lake, PGA = Pousada das Garças Lake, JAC = Jacaré Lake, OSM = Osmar Lake and ZEP = Zé do Paco Lake).
Table 1. Principal environmental features of sampled lakes.
Lakes Position Banks Area Dept Temp Cond pH Chlor-α DO Turb
CLA 22°45’ S; 53°15’ W gras/cip 0.91 1.20 27.20 57.70 6.28 8.53 3.89 8.15 GEN 22°45’ S; 53°16’ W gras/cip* 0.06 0.96 30.60 61.70 6.30 16.04 3.60 23.50 OSM 22° 46’ S; 53° 19’ W rem. sucess 0.01 1.10 21.00 35.50 6.25 5.46 5.64 46.50 JAC 22° 47’ S; 53° 29’ W bush 2.14 6.96 29.40 47.10 6.41 30.03 2.94 11.33 ZEP 22° 50’ S; 53° 34’ W gras/cip 3.90 2.70 30.50 33.70 6.35 4.78 3.31 5.88 PGA 22° 42’ S; 53° 15’ W gras/cip** 2.30 3.80 31.60 33.90 6.59 22.82 3.70 4.38
[gras/cip = predominance of grass and cyperaceans; rem. sucess= successional riparian forest remnants;*occurrence of Croton and Inga uruguensis; **occurrence of Polygonum; Area (ha); Dept = depth (m); Temp = temperature (°C); Cond = conductivity (µS cm–1); Chlor-α = chlorophyll-α (µg L –1); DO = dissolved oxygen
(mg L–1) and Turb = turbidity (NTU); OSM = Osmar Lake; JAC = Jacaré Lake; PGA = Pousada das Garças Lake;
regressions for Bosmina hagmanni obtained in the present study and those regression parameters obtained by Maia-Barbosa and Bozelli (2005) (Table 4). This enabled a single regression line to be established for this species in tropical regions (W = 11.011 L2.638, r2 = 0.97) (Figure 4). Ceriodaphnia cornuta and Moina minuta presented regressions with similar slopes, but significantly different intercepts (Table 4 and Figure 2).
The ANOVA results, performed between the actual dry weight values obtained by weighing each size class (W) and those values generated by calculating regressions from the present study (PS) and the literature for cladocerans (MB, H, GH, B and D) and copepods (B and D), indicated significant differences for Bosmina hagmanni, Daphnia gessneri, Moina minuta, Thermocyclops decipiens and T. minutus. The LSD tests indicated that the dry weight values (W and PS) from this study were significantly different from those presented in published regressions for B. hagmanni and D. gessneri (Dumont et al., 1975; Bottrell et al., 1976) and M. minuta (Bottrell et al., 1976; Ghidini and Santos-Silva, 2009). Considering tropical and temperate regions, the results of Maia-Barbosa and Bozelli (2005) for B. hagmanni were also statistically different from those of Dumont et al. (1975) and Bottrell et al.(1976). A similar pattern is apparent between their results for M. minuta and those of Bottrell et al. (1976) (Table 5).
The LSD tests showed no significant differences between our D. gessneri results and other tropical data (Table 5). There were, however, greater differences between our results and those of Hardy (1989), which varied by about 108%, and also between Hardy (1989) and both Dumont et al. (1975) and Bottrell et al. (1976), which varied by about 44% and 21%, respectively (Table 6). Ceriodaphnia cornuta, Diaphanosoma spinulosum and Macrothrix squamosa did not exhibit significant differences between the dry weight values in this study (W and PS) and the values estimated in the literature (MB, H, B and D) (Tables 5 and 6).
For copepods, the LSD tests also indicated that our dry weight values (W and PS) for Thermocyclops decipiens and T. minutus were significantly different from those presented in the regressions performed by Bottrell et al. (1976) (Table 5). The species length and dry weight values (W) from our study were lower than those estimated by the regressions of Dumont et al. (1975) and Bottrell et al. (1976) (Table 6). There were no significant results when comparing the dry weight Thermocyclops decipiens Kiefer, 1929, T. minutus
(Lowndes, 1934) and developmental stage (Calanoida copepodids).
The length–weight regression used was Y = a xb, where Y = ln W (µg), x = ln L (mm), a = estimate of intercept, b = estimate of slope. These were calculated from the dry weights corresponding to each class of body size; both values were transformed into natural logarithms.
We compared our length–weight regressions for three cladoceran species (Bosmina hagmanni, Ceriodaphnia cornuta and Moina minuta) with those from other Brazilian floodplain (Maia-Barbosa and Bozelli, 2005), through analysis of covariance (ANCOVA) for the same species (Zar, 1999). For copepods, length–weight regressions were not compared, due to an absence of data in the literature for adult and young stages of same species from other floodplain lakes in Brazil.
We also assessed whether there were difference between our observed (W) and estimated results (PS) of microcrustacean dry weights and those estimated by regressions from the literature in tropical and temperate regions (Dumont et al., 1975; Bottrell et al., 1976; Hardy, 1989; Maia-Barbosa and Bozelli, 2005; Ghidini and Santos-Silva, 2009), through analysis of variance (ANOVA) followed by LSD post-hoc tests. These analyses were based on the size values of the studied species and Calanoida copepodids. The regression of Hardy (1989) used carbon content, which was considered to be 40% of the individuals’ dry weight (Baranyi et al., 2002).
3. Results
In general, the range of variations in length was higher for Daphnia gessneri, Diaphanosoma spinulosum, Thermocyclops decipiens and T. minutus than for Bosmina hagmanni,
Ceriodaphnia cornuta, Macrothrix squamosa,
Moina minuta and Argyrodiaptomus azevedoi. Dry weight variations followed the same pattern. The variation ranges of mean length and dry weight are shown in Table 2.
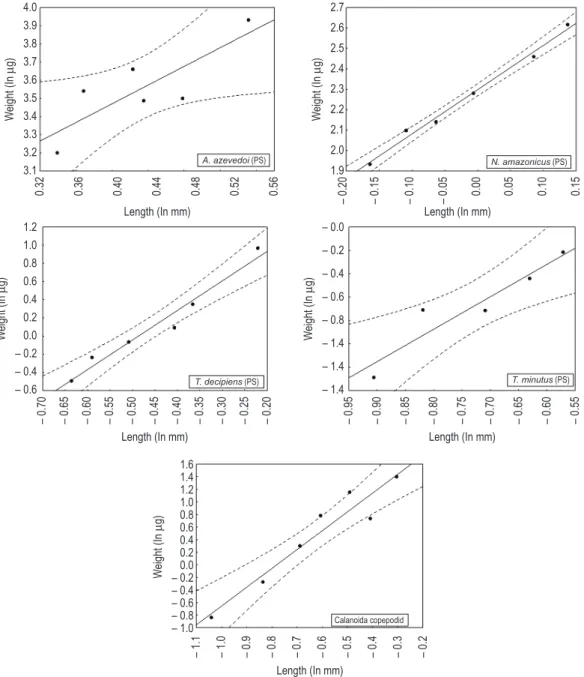
The length–weight regressions may be considered suitable for the estimation of dry weights for the cladoceran and copepod species studied, given the statistical significance of the coefficients of determination (r2), p-values (Table 3) and confidence limits (95%) from the lines for most of the species (Figures 2 and 3).
4. Discussion
Understanding length–weight relationships for zooplankton species is important for the development of studies of this community in aquatic ecosystems. Furthermore, this information is fundamental to the study of the biomass of these organisms and associated secondary production, and ultimately for understanding ecosystem processes.
Our results showed that the dry weight and length values of the cladoceran species were values (W and PS) of Argyrodiaptomus azevedoi,
Notodiaptomus amazonicus and Calanoida
copepodids observed in our study with those from the literature (Dumont et al., 1975; Bottrell et al., 1976) (Table 5). However, when we used length values of individuals to estimate dry weight, our results were higher than those in the literature (Table 6). Comparison of A. azevedoi with the literature was not possible, since no previous studies exist for this species.
The same pattern was observed in a comparison with Bottrell et al. (1976): among 11 cladoceran species, only two of the smaller species, and one of the larger species, displayed similar sizes to those determined in the present study. Most species recorded by these authors were characterised by greater maximum lengths (some reaching 3.25 mm) than those obtained for the species studied in the present study (1.06 mm).
As was the case with the cladocerans, the dry weight and length values of the copepod species Thermocyclops minutus and T. decipiens were similar to those presented in other studies similar to those presented in other studies from
tropical region (Maia-Barbosa and Bozelli, 2005), but differed from those from temperate regions (Dumont et al., 1975; Bottrell et al., 1976). These differences are due to the greater length of the cladoceran species in temperate regions. For example, Dumont et al. (1975) estimated the length–weight relationship for Cladocera using individuals of 20 different species. Compared to the present study, only four of the smaller species exhibited a similar size (Bosmina hagmanni, Ceriodaphnia cornuta, Macrothrix squamosa), and only one of the larger species (Daphnia gessneri).
The smaller lengths of the cladoceran and copepod species in our study can be explained by the higher temperatures experienced in tropical regions. Temperature is an important factor, which regulates zooplanktonic organisms, since it influences their metabolism. At higher temperatures, zooplankton experience a decrease in egg development time, combined with increases in population growth rate and food rate (Melão, 1999), which results in decreased body length.
from tropical regions (Castilho-Noll and Arcifa, 2007; González et al., 2008; Brito, 2010) but significantly different to those from temperate regions (Dumont et al., 1975; Bottrell et al., 1976). This fact also is attributed to the greater lengths of copepod species in temperate regions. All the Copepoda species listed by Bottrell et al. (1976) illustrated greater lengths (maximum 2.45 mm) than the species recorded in our study (maximum 1.9 mm).
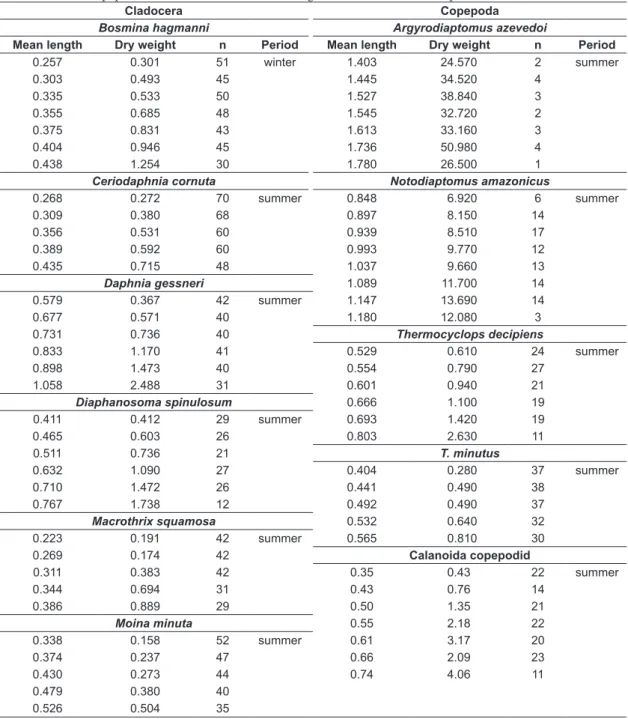
Table 2. Mean lengths of the different size classes (mm), and their respective dry weights (µg), for the studied cladocerans and copepods obtained from the lakes during the summer and winter periods.
Cladocera Copepoda
Bosmina hagmanni Argyrodiaptomus azevedoi
Mean length Dry weight n Period Mean length Dry weight n Period
0.257 0.301 51 winter 1.403 24.570 2 summer
0.303 0.493 45 1.445 34.520 4
0.335 0.533 50 1.527 38.840 3
0.355 0.685 48 1.545 32.720 2
0.375 0.831 43 1.613 33.160 3
0.404 0.946 45 1.736 50.980 4
0.438 1.254 30 1.780 26.500 1
Ceriodaphnia cornuta Notodiaptomus amazonicus
0.268 0.272 70 summer 0.848 6.920 6 summer
0.309 0.380 68 0.897 8.150 14
0.356 0.531 60 0.939 8.510 17
0.389 0.592 60 0.993 9.770 12
0.435 0.715 48 1.037 9.660 13
Daphnia gessneri 1.089 11.700 14
0.579 0.367 42 summer 1.147 13.690 14
0.677 0.571 40 1.180 12.080 3
0.731 0.736 40 Thermocyclops decipiens
0.833 1.170 41 0.529 0.610 24 summer
0.898 1.473 40 0.554 0.790 27
1.058 2.488 31 0.601 0.940 21
Diaphanosoma spinulosum 0.666 1.100 19
0.411 0.412 29 summer 0.693 1.420 19
0.465 0.603 26 0.803 2.630 11
0.511 0.736 21 T. minutus
0.632 1.090 27 0.404 0.280 37 summer
0.710 1.472 26 0.441 0.490 38
0.767 1.738 12 0.492 0.490 37
Macrothrix squamosa 0.532 0.640 32
0.223 0.191 42 summer 0.565 0.810 30
0.269 0.174 42 Calanoida copepodid
0.311 0.383 42 0.35 0.43 22 summer
0.344 0.694 31 0.43 0.76 14
0.386 0.889 29 0.50 1.35 21
Moina minuta 0.55 2.18 22
0.338 0.158 52 summer 0.61 3.17 20
0.374 0.237 47 0.66 2.09 23
0.430 0.273 44 0.74 4.06 11
0.479 0.380 40
Table 3. Weight–length regressions for the cladocerans and copepods studied and comparisons with the literature.
Species Equations Authors
Cladocera W = 1.5 10–8 L2.84 Dumont et al. (1975)
Cladocera W = 5.762 L2.653 Bottrell et al. (1976)
Bosmina hagmanni W = 10.381 L2.610 (r2 = 0.98; P < 0.001) Present study
B. hagmanni W = 11.930 L2.680 (r2 = 0.94) Maia-Barbosa and Bozelli (2005)
Ceriodaphnia cornuta W = 3.935 L2.000 (r2 = 0.98; P < 0.001) Present study
C. cornuta W = 4.227 L1.888 (r2 = 0.97) Maia-Barbosa and Bozelli (2005)
C. cornuta W= –0.911 +0.00426 L (r2 = 0.98) Ghidini and Santos-Silva (2009)
Daphnia gessneri W = 2.054 L3.220 (r2 = 0.99; P < 0.001) Present study
Diaphanosoma spinulosum W = 3.127 L2.220 (r2 = 0.99; P < 0.001) Present study
Macrothrix squamosa W = 17.288 L3.177 (r2 = 0.86; P = 0.020) Present study
Moina minuta W = 2.340 L2.450 (r2 = 0.97; P = 0.002) Present study
M. minuta W = 1.161 L1.549 (r2 = 0.76) Maia-Barbosa and Bozelli (2005)
M. minuta W = 0.0910 +0.00108 L (r2 = 1.00) Ghidini and Santos-Silva (2009)
Copepoda W = 7.047 L2.399 Bottrell et al. (1976)
Calanoida W = 7.9 10–7 L2.330 Dumont et al. (1975)
Cyclopoida W = 2.2 10–8 L2.82 Dumont et al. (1975)
Copepodids W = 1.10 10–5 L1.89 Dumont et al. (1975)
Argyrodiaptomus azevedoi W = 11.473 L2.560 (r2 = 0.68; P = 0.044) Present study
Notodiaptomus amazonicus W = 9.875 L2.160 (r2 = 0.99; P <0.001) Present study
Thermocyclops decipiens W = 4.807 L3.244 (r2 = 0.96; P < 0.001) Present study
T. minutus W = 3.819 L2.770 (r2 = 0.89; P = 0.016) Present study
Calanoida copepodid W = 11.822 L3.150 (r2 = 0.97; P = 0.020) Present study
(W = weight in µg; L = length in mm).
Table 4. Analysis of covariance (ANCOVA) of weight–length regressions between cladoceran species common to Maia-Barbosa and Bozelli (2005; MB) and the present study (PS).
Species Slope Intercept
F P X/SD F P
Bosmina hagmanni (PS)
0.100 0.756 –0.418 ± 0.473 1.000 0.355
B. hagmanni (MB) –0.777 ± 0.540
Ceriodaphnia cornuta (PS)*
0.000 0.781 –0.752 ± –0.383 392.7 0.000
C. cornuta (MB)* –1.233 ± –0.439
Moina minuta (PS)*
0.200 0.686 –1.247 ± 0.445 131.8 0.000
M. minuta (MB)* –1.406 ± 0.321
(X = mean; SD = standard deviation; * = significant differences, p < 0.05).
Table 5. Analysis of variance (ANOVA) and LSD tests for dry weight values (µg), obtained through different linear regressions, for microcrustaceans species.
Species Anova LSD
Df F P Classes
B. hagmanni* 4 5.130 0.002 W ≠ B and ≠ D; PS ≠ B and ≠ D; MB ≠ B and ≠ D
C. cornuta 5 1.996 0.115
-D. gessneri* 4 3.550 0.020 W ≠ B and ≠ D; PS ≠ B and ≠ D
D. spinulosum 3 0.717 0.553
-M. minuta* 5 2.947 0.033 W ≠ GH and B; PS ≠ GH and B; MB ≠ B
M. squamosa 3 1.841 0.183
-A. azevedoi 1 0.001 0.974
-N. amazonicus 3 2.756 0.069
-T. decipiens* 3 4.010 0.022 W ≠ B; PS ≠ B
T. minutus* 3 6.480 0.004 W ≠ B; PS ≠ B
Calanoida copepodid 2 0.007 0.993
(4 classes in our study compared to 7 classes in the Amazon study) and to the different methods employed to estimate biomass (Duncan et al., 1985). Hardy (1989) used carbon content (Salonen, 1979) to estimate dry weight (which was then interpreted), while the present study actually measured dry weight.
Our dry weight results for Moina minuta (W and PS) were different from those estimated by the regressions of the Ghidini and Santos-Silva (2009) at Tupé Lake (Amazon). This can be explained by seasonality. Several authors have concluded that large variations in weight–length regressions in temperate regions are the result of seasonality (Persson and Ekbohm, 1980; Geller and Müller, 1985; Akbulut, 1998; Kawabata and Urabe, 1998). This relationship has also been observed for M. minuta in tropical regions. Our results were obtained during the summer, while those described by Ghidini and Santos-Silva (2009) were acquired in the winter. In summer, species tend to have lower biomass, since some of it is consumed as the creatures spend more energy, which implies a reduced dry weight (Blettler and Bonecker, 2006).
The statistical differences (ANOVA results) between dry weights from studies in tropical (W, PS and MB) and temperate regions (B and D) for three cladoceran species (B. hagmanni, D. gessneri and M. minuta) may be the result of higher temperatures, combined with increased quantity and quality of food resources, in tropical region (Rocha, 1983; Kankaala and Johansson, 1986; Hardy, 1989), and also specimen morphology (Dumont et al., 1975; Blettler and Bonecker, 2006). In addition, the cladoceran species used to The higher intercept values of the regressions for
Ceriodaphnia cornuta and Moina minuta indicates that their weights are always proportionately higher than those observed by Maia-Barbosa and Bozelli (2005) for a same class of body size (ANCOVA results). However, this difference in intercept values was not sufficient to demonstrate a statistical difference between the dry weights estimated by the regressions of Maia-Barbosa and Bozelli (2005) and the values observed in this study (W and PS).
The variation between the dry weights of Daphnia gessneri in our study and those estimated by the regressions of Hardy (1989) in tropical regions (Amazon) is about 108%, which is large but not significant. This is probably related to the small number of size classes considered in our analysis
Table 6. Means and standard deviations of dry weights (µg) from studied species, obtained using regressions from the present study (PS), Maia-Barbosa and Bozelli (2005; MB), Hardy (1989; H), Ghidini and Santos-Silva (2009; GH), Bottrell et al. (1976; B) and Dumont et al. (1975; D), considering the measured length classes, and from direct weighing of individuals (W).
Study/ Species
CLADOCERA
B. hagmanni C. cornuta D. gessneri D. spinulosum M. minuta M. squamosa
W 0.720 ± 0.319 0.498 ± 0.175 1.134 ± 0.776 1.008 ± 0.519 0.310 ± 0.134 0.466 ± 0.316 PS 0.720 ± 0.308 0.499 ± 0.181 1.122 ± 0.764 1.003 ± 0.520 0.308 ± 0.130 0.452 ± 0.273 MB 0.772 ± 0.338 0.601 ± 0.207 - - 0.317 ± 0.086
-H - - 2.364 ± 1.035 - -
-GH - 0.587 ± 0.279 - - 0.555 ± 0.082
-B 0.383 ± 0.166 0.382 ± 0.180 3.414 ± 1.926 1.524 ± 0.925 0.645 ± 0.292 0.269 ± 0.139 D 0.274 ± 0.127 0.274 ± 0.137 2.864 ± 1.727 1.210 ± 0.779 0.479 ± 0.232 0.188 ± 0.103
COPEPODA
A. azevedoi N. amazonicus T. decipiens T. minutus Calanoida copepodid
W 35.796 ± 8.762 9.789 ± 2.506 1.249 ± 0.731 0.542 ± 0.197 2.007 ± 1.293 PS 35.370 ± 7.150 9.700 ± 2.447 1.224 ± 0.643 0.538 ± 0.193 1.981 ± 1.401
B - 6.934 ± 1.944 1.908 ± 0.869 1.283 ± 0.402 -D - 7.593 ± 2.067 2.510 ± 0.968 0.864 ± 0.315 1.731 ± 0.759
References
AKBULUT, NE. 1998. Biomass analysis of dominant zooplanktonic organisms living in Lake Morgan (Turkey). Turkish Journal of Zoology, vol. 22, p. 333-339.
BARANYI, C., HEIN, T., HOLAREK, C., KECKEIS, S. and SCHIEMER, F. 2002. Zooplankton biomass and community structure in a Danube floodplain system: effects of hydrology. Freshwater Biology, vol. 47, p. 473-48. http://dx.doi.org/10.1046/j.1365-2427.2002.00822.x
BIRD, DF. and PRAIRE, YT. 1985. Practical guidelines for the use of zooplankton length-weight regression equations. Journal of Plankton Research, vol. 7, p. 955-960. http://dx.doi.org/10.1093/ plankt/7.6.955
BLETTLER, MCM. and BONECKER, CC. 2006. Avaliação da biomassa de microcrustáceos em ambientes aquáticos continentais. Interciencia, vol. 31, p. 591-597.
BONECKER, CC., NAGAE, MY., BLETTER, MCM., VELHO, LFM. and LANSAC-TÔHA, FA. 2007. Zooplankton biomass in tropical reservoirs in Southern Brazil. Hydrobiologia, vol. 579, p. 115-123. http://dx.doi.org/10.1007/s10750-006-0391-x BOTTRELL, HH., DUNCAN, A., GLIWICZ, ZM.,
GRYGIEREK, E., HERZIG, A., HILLBRICHT-ILKOWSKA, A., KURASAWA, H., LARSSON, P. and WEGLENSKA, T. 1976. A review of some problems in zooplankton production studies.
Norwegian Journal of Zoology, vol. 24, p. 419-456. BRITO, SL. 2010. Caracterização limnológica e
produtividade secundária das principais espécies de microcrustáceos em dois braços dos reservatórios de Três Marias e Furnas, Minas Gerais, Brasil. Belo Horizonte: Universidade Federal de Minas Gerais. [Tese de Doutorado em Ecologia].
CASTILHO-NOLL, MSM. and ARCIFA, MS. 2007. Length-weight relationships for zooplanktonic species of a tropical Brazilian lake: Lake Monte Alegre. Acta Limnologica Brasiliensia, vol. 9, p. 93-100.
DUMONT, HJ., VAN DE VELDE, I. and DUMONT, S. 1975. The dry weight estimate of biomass in a selection of Cladocera, Copepoda, and Rotifera from the plankton, periphyton and benthos of continental waters. Oecologia, vol. 19, p. 75-97. http://dx.doi. org/10.1007/BF00377592
DUNCAN, A., LAMPERT, W. and ROCHA, O. 1985. Carbon weight’ on length regressions of Daphnia spp. Grown at threshold food concentrations.
Verhandlungen der Internationalen Vereinigung für Theoretische und Angewandte Limnologie, vol. 22, p. 3109-3115.
EDMONDSON, WT. and WINBERG, GH. 1971.
A manual on methods for the assessment of secondary productivity in freshwaters. Oxford: Blackwell. 358 p. GELLER, W. and MULLER, H. 1985. Seasonal
variability in the relationship between body length generate length–weight regressions for temperate
regions had larger body sizes than those from the tropical regions. This fact indicated a strong trend that emerges in regressions from temperate regions, to overestimate dry weight values for larger species, such as D. gessneri, and to underestimate values for smaller species, such as B. hagmanni, M. squamosa and M. minuta.
The differences in observed and estimated dry weights for Thermocyclops species between our study and Bottrell et al. (1976) were attributed to variations in copepod species composition in temperate and tropical regions. This is the principal factor explaining statistical differences in dry weights between these regions. Only one of the 11 species recorded in the temperate region by Bottrell et al. (1976) was co-generic to our study (Thermocyclops hyalinus). In general, temperate regions are characterised by larger species of copepod and tropical regions by smaller species. Thus, weight–length regressions from temperate regions should have higher intercept and slope values than our results, leading to dry weights being overestimated for larger species and underestimated for smaller species in tropical regions. This explains the absence of significance differences in the dry weights of Calanoida species between our study (W and PS) and Dumont et al. (1975) and Bottrell et al. (1976).
5. Conclusions
The results of our length–weight regressions for cladocerans and copepods indicated the suitability of these equations for estimating the dry weight of some tropical species and Calanoida copepodids. In addition, our results showed that when regressions from temperate regions were used to estimate dry weights of tropical microcrustacean species there was a striking tendency to overestimate the weight of larger species (as illustrated in our study) and underestimate these values for smaller species, even though the sizes of the species involved were within the limits of the regression. Thus, we must be cautious when using pooled regressions from the literature, selecting models from similar species, or weighing the organisms and building new models.
Acknowledgements
production of Bosminopsis deitersi (Cladocera) in a shallow tropical reservoir. Acta Limnologica Brasiliensia, vol. 18, no.4, p. 433-450.
MICHALOUDI, E. 2005. Dry Weights of the Zooplankton of Lake Mikri Prespa (Macedonia, Greece). Belgian Journal of Zoology, vol. 135, no. 2, p. 223-227.
OMORI, M. 1978. Some factors affecting dry weight, organic weight, and concentrations of carbon and nitrogen in freshly prepared and in preserved zooplankton. Internationale Revue der Gesamten Hydrobiologie, vol. 63, p. 261-269. http://dx.doi. org/10.1002/iroh.19780630211
PERSSON, G. and EKBOHM, G. 1980. Estimation of dry weight in zooplankton populations: methods applied to crustacean population from lakes in the Kuokkel Area, Northern Sweden. Archiv für Hydrobiologie, vol. 59, p. 225-246.
ROCHA, O. 1983. The influence of food-temperature combination on the duration of development, body size, growth and fecundity of Daphnia species. London: University of London. [Doctor Thesis in Zoology]. ROCHA, O. and MATSUMURA-TUNDISI, T. 1984.
Biomass and production of Argyrodiaptomus furcatus, a tropical Calanoida Copepod in Broa Reservoir, Southern Brazil. Hydrobiologia, vol. 113, p. 307-311. http://dx.doi.org/10.1007/BF00026617
SAINT-JEAN, L. and BONOU, CA. 1994. Growth, production, and demography of Moina micrura in brackish tropical fishponds (Layo, Ivory Coast).
Hydrobiologia, vol. 272, p. 125-146. http://dx.doi. org/10.1007/BF00006517
SALONEN, K. 1979. A versatile method for the rapid and accurate determination of carbon by high temperature combustion. Limnology and Oceanography, vol. 24, p. 177-187. http://dx.doi. org/10.4319/lo.1979.24.1.0177
SANTOS, MAPF., MELÃO, MGG. and LOMBARDI, AT. 2006. Life history characteristics and production of Ceriodaphnia silvestrii Daday (Crustacea, Cladocera) under different experimental conditions.
Acta Limnologica Brasiliensia, vol. 18, no. 3, p. 199-212.
SENDACZ, S., CALEFFI, S. and SANTOS-SOARES, J. 2006. Zooplankton biomass of reservoirs in different trophic conditions in the State of São Paulo, Brazil. Brazilian Journal of Biology, vol. 66, no. 1b, p. 337-350. http://dx.doi.org/10.1590/S1519-69842006000200016
WETZEL, RG. and LIKENS, GE. 1991, Limnological analysis. New York: Springer-Verlag. 391 p.
ZAR, JH. 1999. Biostatistical Analysis. New Jersey: Prentice Hall. 662 p.
Received: 25 September 2011 Accepted: 31 May 2012 and individual dry weight as related to food
abundance and clutch size in two coexisting Daphnia
species. Journal of Plankton Research, vol. 7, p. 1-18. http://dx.doi.org/10.1093/plankt/7.1.1
GHIDINI, AR. and SANTOS-SILVA, EN. 2009. Biomassa de quatro espécies de Cladocera (Crustacea: Branchiopoda) e sua variação nictemeral no Lago Tupé, Amazonas, Brasil. In SANTOS-SILVA, EM. and SCUDELLER, VV., orgs. Diversidade Biológica e Sociocultural do Baixo Rio Negro, Amazônia Central. Manaus: UEA Edições. p. 53-62.
GONZÁLEZ, EJ., MATSUMURA-TUNDISI, T. and TUNDISI, JG. 2008. Size and dry weight of main zooplankton species in Bariri reservoir (SP, Brazil).
Brazilian Journal of Biology, vol. 68, p. 69-75. http:// dx.doi.org/10.1590/S1519-69842008000100010 HARDY, ER. 1989. Effect of temperature, food concentration
and turbidity on the life cycle characteristics of planktonic cladocerans in a tropical lake, Central Amazon: Field and Experimental work. London: University of London. [Doctor Thesis in Zoology].
KANKAALA, P. and JOHANSSON, S. 1986. The influence of individual variation on length-biomass regressions in three crustacean zooplankton species.
Journal of Plankton Research, vol. 6, p. 1027-1038. http://dx.doi.org/10.1093/plankt/8.6.1027 KAWABATA, K. and URABE, J. 1998. Length-weight
relationships of eight freshwater planktonic crustacean species in Japan. Freshwater Biology, vol. 39, p. 199-206. http://dx.doi.org/10.1046/j.1365-2427.1998.00267.x
MAIA-BARBOSA, PM. and BOZELLI, RL. 2005. Length-weight relationships for five Cladoceran species in an Amazonian lake. Brazilian Archives of Biology and Technology, vol. 2, p. 303-308.
MATSUMURA-TUNDISI, T., RIETZLER, A. and TUNDISI, JG. 1989. Biomass (dry weight and carbon content) of plankton crustacean from Broa reservoir (São Carlos, SP. – Brazil) and its fluctuation across one year. Hydrobiologia, vol. 179, no. 3, p. 229 236. http://dx.doi.org/10.1007/BF00006636 McCAULEY, E. 1984. The estimation of the abundance and biomass of zooplankton in samples. In DOWNING, JA. and RIGLER, FH., orgs. A manual on methods for the assessment of secondary productivity in fresh waters. Oxford: Blackwell Scientific. p. 228-265.
MELÃO, MGG. 1999. Desenvolvimento e aspectos reprodutivos de cladóceros e copépodos de águas continentais brasileiras. In POMPÊO, MLM., org.
Perspectivas da Limnologia no Brasil. São Luís: Gráfica e Editora União. p. 45-57.