LEAF AREA INDEX RETRIEVED FROM THERMAL HYPERSPECTRAL DATA
Commission VII, WG VII/3
Elnaz Neinavaz a,*, Andrew K. Skidmore a, Roshanak Darvishzadeh a, Thomas A. Groen a
a Department of Natural Resources Science, Faculty of Geo-Information Science and Earth Observation (ITC), University of Twente, 7500 AE Enschede, The Netherlands-(e.neinavaz, a.k.skidmore, r.darvish, t.a.groen)@utwente.nl
KEY WORDS: Thermal, Emissivity spectra, Leaf area index (LAI), Canopy, Remote sensing, Spectrometer.
ABSTRACT:
Leaf area index (LAI) is an important essential biodiversity variable due to its role in many terrestrial ecosystem processes such as evapotranspiration, energy balance, and gas exchanges as well as plant growth potential. A novel approach presented here is the retrieval of LAI using thermal infrared (8–14 μm, TIR) measurements. Here, we evaluate LAI retrieval using TIR hyperspectral data. Canopy emissivity spectral measurements were recorded under controlled laboratory conditions using a MIDAC (M4401-F) illuminator Fourier Transform Infrared spectrometer for two plant species during which LAI was destructively measured. The accuracy of retrieval for LAI was then assessed using partial least square regression (PLSR) and narrow band index calculated in the form of normalized difference index from all possible combinations of wavebands. The obtained accuracy from the PLSR for LAI retrieval was relatively higher than narrow-band vegetation index (0.54<R2<0.74). The results demonstrated that LAI may successfully be estimated from hyperspectral thermal data. The study highlights the potential of hyperspectral thermal data for retrieval of vegetation biophysical variables at the canopy level for the first time.
1. INTRODUCTION
Leaf area index (LAI) is a principal component of biogeochemical cycles in ecosystems (Bréda 2003). Among vegetation biophysical properties, LAI is of particular interest, as it exhibits significant control on the transpiration, respiration, and gas exchanges (e.g., uptake of CO2 and H2O by the canopy) between terrestrial ecosystems and atmosphere. Previous studies have shown the importance of LAI in ecological and remote sensing studies. LAI is a key input for climate and large-scale ecosystem models and also is a key structural characteristic of forest ecosystems (Chen et al. 1997; Myneni et al. 1997; Wang et al. 2004; Zheng and Moskal 2009). In the last decades, LAI has been successfully retrieved using hyperspectral data in the visible/near–infrared (0.35-1.0 µm, VNIR) and short-wave infrared (1.0-2.5 µm, SWIR) regions (Zheng and Moskal 2009). Despite the broadly recognized importance of LAI across ecological research, to our knowledge, LAI has not estimated from thermal infrared (8-14 µm, TIR) hyperspectral data. TIR hyperspectral data deserves the same exploration and development of methods, as hyperspectral data in the VNIR and SWIR regions.
Recently, Ullah (2013) showed that TIR hyperspectral data is supplementary to other remote sensing data and has the potential to explain the biochemical characteristics of vegetation (e.g. water content) at leaf level. The primary absorption features associated with water and cellulose, as important vegetation components, are only observable in the mid-wave infrared (3-5 µm, MIR) and TIR regions (Fabre et al. 2011; Gerber et al. 2011; Ribeiro da Luz 2006). In addition, previously, it has been presumed that plants are opaque and featureless in the TIR region. However, recent studies have uncovered that various plant species display distinct emissivity spectra and have recognizable spectral features in the TIR
region (Ribeiro da Luz and Crowley 2010; Ullah et al. 2012). There are a number of reasons why to date limited attention was directed at using TIR hyperspectral remote sensing data for vegetation studies. In the TIR region, spectra result from the emissivity of surfaces, rather than from reflectance. Only a few instruments measure TIR emissivity spectra at high spectral resolution, and only very few are able to do this for complex surfaces such as canopies. Therefore, few studies have been conducted on TIR hyperspectral data for vegetation studies at canopy level (Ribeiro da Luz and Crowley 2010; Sepulcre-Cantó et al. 2006). More studies are required to assess and understand TIR remotely measured spectra from vegetation particularly at canopy level.
LAI has been predicted in many studies using hyperspectral data from the VNIR and SWIR regions using univariate (e.g. vegetation indices) and multivariate (e.g. partial least squares regression (PLSR)) models. This has led to the development of new vegetation indices which have further improved LAI prediction (Asner and Martin 2008; Baret and Guyot 1991; Darvishzadeh et al. 2009; Eriksson et al. 2006; Gao et al. 2000; Haboudane et al. 2004; Koetz et al. 2005). To our knowledge, neither the relation between LAI and univariate methods nor the relation between LAI and multivariate methods in the TIR region has yet been demonstrated. Therefore, the main objective of this study was to investigate the retrieval of LAI in the TIR region, using narrow band indices and PLSR.
2. MATERIALS AND METHODS
2.1. LAI measurements
In the present study, two plant species were selected: Azalea japonica (n=10) and Ficus benjamina (n=6). The leaves from
This contribution has been peer-reviewed.
the plants were harvested in several steps and LAI (m2m−2) was calculated using the measured surface area of the leaves and the corresponding ground area of the canopy. The dataset included 16 plant specimens, which yielded 60 LAI estimates from the destructive sampling.
2.2. Canopy thermal infrared radiance measurement
The radiance spectral measurements were made using a portable MIDAC illuminator Fourier Transform Infrared (FTIR) spectrometer (Model M4401-F; MIDAC Corporation, CA, USA). Measurements were made at nadir position above the samples. To create optimal measurement conditions and reduce any possible source of errors due to the changes in atmospheric conditions or temperature, the measurements were made under controlled laboratory conditions in which the walls, ceiling, and floor were coated with a black material (Avis Aqua Blackboard Black) and black plastic of known emissivity. We reduced the laboratory temperature to 10˚C in order to generate a suitable thermal contrast with the plants, which were at a higher room temperature. In addition, plants were kept outside the laboratory at an ambient room temperature of 20°C and each one was briefly introduced to the laboratory in order to make the thermal measurements. Measurements were made with a fixed vertical distance between sensor and sample (60 cm). In this experiment, the background soil was covered with black plastic of known emissivity to minimize possible effects of soil. The radiance spectra of the plant canopies were measured between wavelengths of 2.5–20 μm at a resolution of two cm−1. The emissivity spectra of plant canopies at each LAI value were obtained using a series of FTIR measurements performed in the following order: radiance measurements of the hot blackbody, radiance measurement of the cold blackbody, radiance measurement of the sample (i.e., the plant canopy with specific LAI value), and finally, radiance measurements of a highly diffuse reflecting gold plate (Infragold®). For instrument radiance calibration, two blackbodies (one hot, one cold) were used. The cold blackbody temperature was set just below the ambient temperature, at 5°C (Korb et al. 1996). The hot blackbody temperature was set above the sample temperature (Hori et al. 2006; Salvaggio and Miller 2001), at 30°C. Details of the radiometric calibration applied with the measurements of these blackbodies’ radiances can be found in (Hook and Kahle 1996). A diffuse reflecting gold plate with an emissivity of ~ 0.04 was used to collect downwelling radiance (DWR) in order to determine the quantitative influence of the laboratory background self-emission (Eisele et al. 2015). The measurement series were taken within five minutes to minimize the possible drift of the instrument, physiological changes in the plants, and fluctuations in laboratory temperature. After each set of measurements, the canopy was rotated 90 degrees clockwise. The final corresponding canopy emissivity spectra of each sample (for a specific LAI value), was then calculated from the average of four sets of measurements (covering 360 degrees). In total, 240 (4*60) canopy radiance measurements were obtained for two plant species. Spectral emissivity of the plants was calculated from their absolute radiance using the following equation (Korb et al. 1996),
εsam (λ) =BL(samλ,Tsam (λ))−L−LDWRDWR((λλ)) (1)
Where
εsam(λ) = Directional emissivity of the sample at the
wavelength λ
Lsam (λ) = Spectral radiance from the sample
Tsam = The true physical temperature of the sample
B(λ, Tsam) = Planck function at the wavelength λ and sample temperature
LDWR(λ) = Total spectral DWR from the hemisphere above the sample.
Tsam must accurately represent the emission temperature. Therefore, after measuring canopy temperature before and after each measurement, the blackbody fit method was used to calculate the sample emissivity value. Details about the blackbody fit method can be found in Kahle and Alley (1992) and Salvaggio and Miller (2001). The emissivity of 279 wavebands between 8 μm and 14 μm was selected for analysis; measurements outside this range had a very low signal strength. A Savitzky–Golay filter with a frame size of 15 data points and second-degree polynomial was used to reduce the noise of the canopy emissivity spectra (Savitzky and Golay 1964).
2.3. Estimation of leaf area index
2.3.1. Narrow band Index
Generally, vegetation indices which are calculated from different combinations of bands are divided into two main categories: orthogonal and ratio indices (Baret and Guyot 1991). Of these vegetation indices, the normalized difference index used frequently to derive LAI from optical remote sensing data (Huete et al. 2002). Therefore, in this study, this widely used index was calculated from all the possible paired waveband combinations, using canopy emissivity spectra of pooled data and each species between 8 μm and 14 μm. To evaluate the strength of the relation between proposed index and LAI, the coefficients of determination (R2) of all possible two-waveband combinations of vegetation index and LAI were used. From all these combinations, we selected the narrow band indices that performed best at estimating LAI, as having the maximum R2 with LAI (Mutanga and Skidmore 2004). The naming conventions, acronyms, and calculations for the considered index is listed in Table 1. In this study, the concept of calculating normalized difference index is based upon the contrast in the emissivity between two different spectra wavebands (Rλ1and Rλ2).
Table 1. The spectral index used in this paper.
Name Acronym TIR Equation
Normalized Difference ND Rλ1−Rλ2
Rλ1+ Rλ2
cross-validation procedure also known as the “leave one out method” (Duda and Hart 1973), was used to validate the regression models. The estimated LAI was assessed using the cross-validated coefficient of determination (R2
CV), and cross-validated root mean squared error (RMSECV) for the best performing narrow band index.
2.3.2. Partial least squares regression
Hyperspectral data has a high dimensionality and high collinearity between adjacent wavebands. PLSR is a popular multivariate statistical technique for transforming the wavebands to new orthogonal factors, i.e. components, which eliminates this collinearity. Multivariate methods include models such as PLSR which as so-called “full spectrum methods” employ all available spectral data simultaneously (Atzberger et al. 2010) and reduce the effects of multicollinearity as a common problem inherent to the hyperspectral dataset (Mirzaie et al. 2014).
PLSR has been broadly applied in remote sensing vegetation analysis (Cho et al. 2007; Kooistra et al. 2004). Here, PLSR analysis was used to determine the relative contribution of LAI to the 279-waveband canopy emissivity spectra for all the sampled species. The canopy emissivity spectra as independent variables were mean-centered before performing the PLSR analysis. To avoid over-fitting and prevent collinearity, an optimum number of factors was determined, using a cross-validation procedure. The criterion for adding an extra factor to the model was that it decreased RMSEcv by > 2% (Geladi and Kowalski 1986). The accuracy of the models was evaluated using RMSECV. All PLSR analyses were carried out using the TOMCAT toolbox 1.01 within MATLAB (Daszykowski et al. 2007).
3.RESULTS
3.1. Narrow band indices and leaf area index
The descriptive statistics of our experimental setup showed LAI ranges between 0.60 (m2m−2) and 8.36 (m2m−2). Together with the variation in LAI values, the measured canopy emissivity exhibited a large variability (Table 2).
Table 2. Summary statistics of the leaf area index (LAI) measurements for four plant species (n=60).
Species name LAI (m
2m-2)
Mean Max Min Sample size
Azalea japonica 1.57 3.35 0.60 30
Ficus benjamina 3.60 8.36 1.04 30
Pooled data 2.58 8.36 0.60 60
Desired narrow band index (i.e. ND) was calculated from the measured canopy emissivity spectra, using all possible two-waveband combinations. The coefficients of determination (R2) between ND and LAI was computed and tabulated in Table 3. Table 3 demonstrates the maximum R2 between the ND and the LAI, for each species and pooled data, as well as the band position of the best performing narrow band index. The maximum R2 value obtained between LAI and ND for Azalea japonica and Ficus benjamina were 0.65 and 0.48 respectively.
The results showed that the maximum R2 with LAI across species was yielded by wavebands in the 9.9-10.6 µm range in combination with the bands in the 10.2-11.9 µm range. In general, LAI was estimated with appropriate accuracy.
Table 3. Band position and thecoefficients of determination (R2) values between the best performing narrow band index and LAI. R2
CV is the cross-validated coefficient of determination between estimated and measured LAI; RMSECV is the relative root mean square error.
Species name R2 Most Sensitive bands Validation
λ1(μm) λ2(μm) R2
CV RMSECV
Ficus benjamina 0.65 10.6 11.9 0.60 1.14
Azalea japonica 0.48 9.9 10.2 0.38 0.43
Pooled data 0.63 10.1 11.8 0.60 1.06
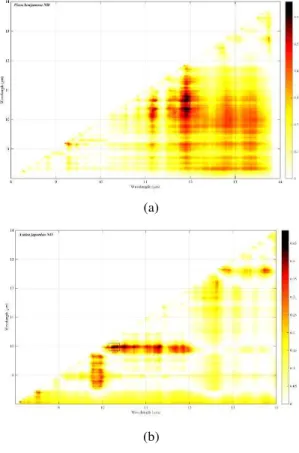
An illustration of these results is depicted in the 2-D correlation plot (Figure 4). The meeting point of each pair of wavebands in the 2-D plots corresponded to the R2 value of LAI and the ND calculated from the emissivity values in those two-wavebands.
(a)
(b)
This contribution has been peer-reviewed.
(c)
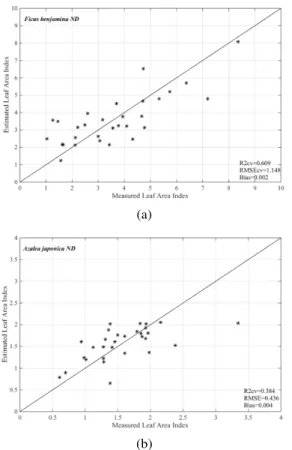
Figure 4. 2-D correlation plots representing the coefficient of determination (R2) between leaf area index and normalized difference index (ND) for Ficus benjamina (a), Azalea japonica (b), and pooled data (c) calculated from all possible two-waveband combinations between 8 µm and 14 µm. The relationship between measured and estimated LAI in two species and pooled data using normalized difference index is illustrated in Figure 5. The scatter plots demonstrate that linear relationship existed between estimated and measured LAI when the best waveband combinations were used for the considered index.
(a)
(b)
(c)
Figure 5. Scatterplot of measured versus predicted leaf area index for the best narrow band index calculated from normalized difference index (ND) for Ficus benjamina (a), Azalea japonica (b), and pooled data (c). The optimum wavebands are those reported in Table 3.
3.2. Partial least squares regression and leaf area index
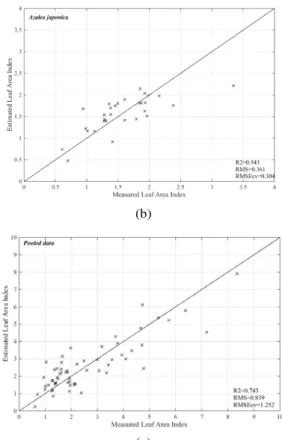
The PLSR regression using TIR spectra yielded the maximum R2 0.68 and 0.54, in Azalea japonica and Ficus benjamina, respectively. The optimal number of factors modelled using PLSR ranged from three to five. (Table 6). For both species, the PLSR models in the TIR region yielded better predictions of LAI in comparison with the narrow band index (i.e. resulted in a higher R2 and lower relative RMSE
CV). For instance, the improvement was noticed for Azalea japonica where R2 enhanced from 0.48 to 0.54 and RMSECV reduced from 0.43 to 0.30. Cross-validation estimation of LAI using the entire emissivity spectra in PLSR models is depicted in Figure 7.
Table 6. The performance of partial least squares regression for estimating leaf area index.
Species No. of Factors R2 RMS RMSECV
Ficus benjamina 3 0.68 0.98 1.12
Azalea japonica 3 0.54 0.36 0.30
Pooled data 5 0.74 0.83 1.25
(b)
(c)
Figure 7. Scatterplot of measured versus estimated leaf area index using entire emissivity spectra in the partial least squares regression model from TIR region: Ficus benjamina (a), Azalea japonica (b), and pooled data (c).
4. CONCLUSIONS
It has long been thought that biophysical or biochemical properties of plants cannot be retrieved using emissivity spectra in the TIR region. This may partly be contributed to the complexity of measuring vegetation biophysical and biochemical variables, as well as the lack of suitable instruments to measure emissivity in the TIR region. Our results demonstrate that biophysical properties of vegetation at the canopy level, such as LAI, can be retrieved using canopy emissivity spectra in the TIR region. Univariate and multivariate techniques can be applied to retrieve LAI values using emissivity spectra. These results are comparable to the results of previous studies in the optical domain for LAI estimation (Darvishzadeh et al. 2008a; Schlerf et al. 2005).
The results of our experiments demonstrate that vegetation indices enable to accurately predict LAI for single species in the TIR domain rather than pooled data including two plant species. It can be attributed to differences in canopy structure (i.e., leaf size and orientation), and probably by the biochemical concentrations (i.e., cellulose and cutin) (Buitrago et al. 2016) of the leaves of these species. As can be seen from the Table 3, comparing the best performing narrow band index location among species showed that they were located in the slightly different spectral region. This can again be explained by differences in the biochemical concentration of leaves and
canopy structural properties of the species studied which could effect on emissivity spectra and radiance scattering in the TIR region (Ribeiro da Luz and Crowley 2007; Salisbury 1986). When the PLSR was applied, the retrieved LAI had a relatively high accuracy compared with results obtained using narrow band index (Table 3). The results highlight that vegetation narrow band index utilize a limited number of spectral data bands (i.e. here only information from two-waveband combinations) from the massive spectral content of the total emissivity information available, whereas the PLSR technique employed all available spectral data. Our results are in a line with the Darvishzadeh et al. (2008b) finding which showed the PLSR technique improved the prediction of LAI compared with narrow band indices in the optimal domain. In all the models considered, the relationship between estimated and measured LAI was found to be linear. This study revealed that LAI could be estimated reasonably accurately in the TIR region. Therefore, we can conclude that LAI can be successfully be retrieved from TIR hyperspectral data, even at relatively high values of LAI. This study demonstrates TIR hyperspectral data can be expected to complement other remote sensing data and also it proof of concept for measuring LAI using the TIR, and brings a following interesting challenge: how to upscale the results from the laboratory (plant canopy) to field conditions.
ACKNOWLEDGEMENTS
This research received financial support from the EU Erasmus Mundus External Cooperation Window (EM8) Action 2, and was co-funded by Natural Resources Department, Faculty of Geo-Information Science and Earth Observation (ITC), University of Twente. The authors extend their appreciation for the great support during the laboratory measurements from Boudewijn de Smeth, Christoph Hecker, and Watse Siderius of the GeoScience Laboratory at ITC faculty, University of Twente. We would like to thank Michal Daszykowski for helpful advice about TOMCAT toolbox and Joy Burrough for her editorial and linguistic advice on a near-final draft.
REFERENCES
Asner, G.P., & Martin, R.E. (2008). Spectral and chemical analysis of tropical forests: Scaling from leaf to canopy levels. Remote Sensing of Environment, 112, 3958-3970
Atzberger, C., Guérif, M., Baret, F., & Werner, W. (2010). Comparative analysis of three chemometric techniques for the spectroradiometric assessment of canopy chlorophyll content in winter wheat. Computers and Electronics in Agriculture, 73, 165-173
Baret, F., & Guyot, G. (1991). Potentials and limits of vegetation indices for LAI and APAR assessment. Remote Sensing of Environment, 35, 161-173
Bréda, N.J. (2003). Ground‐based measurements of leaf area index: a review of methods, instruments and current
controversies. Journal of Experimental Botany, 54, 2403-2417 Broge, N.H., & Mortensen, J.V. (2002). Deriving green crop area index and canopy chlorophyll density of winter wheat from spectral reflectance data. Remote Sensing of Environment, 81, 45-57
This contribution has been peer-reviewed.
Buitrago, M.F., Groen, T.A., Hecker, C.A., & Skidmore, A.K. (2016). Changes in thermal infrared spectra of plants caused by temperature and water stress. ISPRS Journal of
Photogrammetry and Remote Sensing, 111, 22-31
Chen, J.M., & Cihlar, J. (1996). Retrieving leaf area index of boreal conifer forests using Landsat TM images. Remote Sensing of Environment, 55, 153-162
Chen, J.M., Plummer, P.S., Rich, M., Gower, S.T., & Norman, J.M. (1997). Leaf area index measurements. Journal of geophysical research, 102, 29-429
Cho, M.A., Skidmore, A., Corsi, F., Van Wieren, S.E., & Sobhan, I. (2007). Estimation of green grass/herb biomass from airborne hyperspectral imagery using spectral indices and partial least squares regression. International journal of applied Earth observation and geoinformation, 9, 414-424
Darvishzadeh, R., Atzberger, C., Skidmore, A., & Abkar, A. (2009). Leaf Area Index derivation from hyperspectral vegetation indicesand the red edge position. International Journal of Remote Sensing, 30, 6199-6218
Darvishzadeh, R., Skidmore, A., Atzberger, C., & van Wieren, S. (2008a). Estimation of vegetation LAI from hyperspectral reflectance data: Effects of soil type and plant architecture. International journal of applied Earth observation and geoinformation, 10, 358-373
Darvishzadeh, R., Skidmore, A., Schlerf, M., Atzberger, C., Corsi, F., & Cho, M. (2008b). LAI and chlorophyll estimation for a heterogeneous grassland using hyperspectral
measurements. ISPRS Journal of Photogrammetry and Remote Sensing, 63, 409-426
Daszykowski, M., Serneels, S., Kaczmarek, K., Van Espen, P., Croux, C., & Walczak, B. (2007). TOMCAT: A MATLAB toolbox for multivariate calibration techniques. Chemometrics and intelligent laboratory systems, 85, 269-277
Duda, R.O., & Hart, P.E. (1973). Pattern classification and scene analysis. Wiley New York
Eisele, A., Chabrillat, S., Hecker, C., Hewson, R., Lau, I.C., Rogass, C., Segl, K., Cudahy, T.J., Udelhoven, T., & Hostert, P. (2015). Advantages using the thermal infrared (TIR) to detect and quantify semi-arid soil properties. Remote Sensing of Environment, 163, 296-311
Eriksson, H.M., Eklundh, L., Kuusk, A., & Nilson, T. (2006). Impact of understory vegetation on forest canopy reflectance and remotely sensed LAI estimates. Remote Sensing of Environment, 103, 408-418
Fabre, S., Lesaignoux, A., Olioso, A., & Briottet, X. (2011). Influence of Wwater content on spectral reflectance of leaves in the 3–15-domain. Geoscience and Remote Sensing Letters, IEEE, 8, 143-147
Gao, X., Huete, A.R., Ni, W., & Miura, T. (2000). Optical– biophysical relationships of vegetation spectra without background contamination. Remote Sensing of Environment, 74, 609-620
Geladi, P., & Kowalski, B.R. (1986). Partial least-squares regression: a tutorial. Analytica chimica acta, 185, 1-17 Gerber, F., Marion, R., Olioso, A., Jacquemoud, S., da Luz, B.R., & Fabre, S. (2011). Modeling directional–hemispherical reflectance and transmittance of fresh and dry leaves from 0.4 μm to 5.7 μm with the PROSPECT-VISIR model. Remote Sensing of Environment, 115, 404-414
Haboudane, D., Miller, J.R., Pattey, E., Zarco-Tejada, P.J., & Strachan, I.B. (2004). Hyperspectral vegetation indices and novel algorithms for predicting green LAI of crop canopies:
Modeling and validation in the context of precision agriculture. Remote Sensing of Environment, 90, 337-352
Hook, S.J., & Kahle, A.B. (1996). The micro Fourier transform interferometer (μFTIR)—a new field spectrometer for
acquisition of infrared data of natural surfaces. Remote Sensing of Environment, 56, 172-181
Hori, M., Aoki, T., Tanikawa, T., Motoyoshi, H., Hachikubo, A., Sugiura, K., Yasunari, T.J., Eide, H., Storvold, R., & Nakajima, Y. (2006). In-situ measured spectral directional emissivity of snow and ice in the 8–14 μm atmospheric window. Remote Sensing of Environment, 100, 486-502 Huete, A., Didan, K., Miura, T., Rodriguez, E.P., Gao, X., & Ferreira, L.G. (2002). Overview of the radiometric and biophysical performance of the MODIS vegetation indices. Remote Sensing of Environment, 83, 195-213
Kahle, A.B., & Alley, R.E. (1992). Separation of temperature and emittance in remotely sensed radiance measurements. Remote Sensing of Environment, 42, 107-111
Koetz, B., Baret, F., Poilvé, H., & Hill, J. (2005). Use of coupled canopy structure dynamic and radiative transfer models to estimate biophysical canopy characteristics. Remote Sensing of Environment, 95, 115-124
Kooistra, L., Salas, E., Clevers, J., Wehrens, R., Leuven, R., Nienhuis, P., & Buydens, L. (2004). Exploring field vegetation reflectance as an indicator of soil contamination in river floodplains. Environmental Pollution, 127, 281-290 Korb, A.R., Dybwad, P., Wadsworth, W., & Salisbury, J.W. (1996). Portable Fourier transform infrared spectroradiometer for field measurements of radiance and emissivity. Applied Optics, 35, 1679-1692
Mirzaie, M., Darvishzadeh, R., Shakiba, A., Matkan, A., Atzberger, C., & Skidmore, A. (2014). Comparative analysis of different uni-and multi-variate methods for estimation of vegetation water content using hyper-spectral measurements. International journal of applied Earth observation and geoinformation, 26, 1-11
Mutanga, O., & Skidmore, A.K. (2004). Narrow band vegetation indices overcome the saturation problem in biomass estimation. International Journal of Remote Sensing, 25, 3999-4014
Myneni, R.B., Ramakrishna, R., Nemani, R., & Running, S.W. (1997). Estimation of global leaf area index and absorbed PAR using radiative transfer models. Geoscience and Remote Sensing, IEEE Transactions on, 35, 1380-1393 Ribeiro da Luz, B. (2006). Attenuated total reflectance spectroscopy of plant leaves: a tool for ecological and botanical studies. New Phytologist, 172, 305-318
Ribeiro da Luz, B., & Crowley, J.K. (2007). Spectral reflectance and emissivity features of broad leaf plants: Prospects for remote sensing in the thermal infrared (8.0–14.0 μm). Remote Sensing of Environment, 109, 393-405
Ribeiro da Luz, B., & Crowley, J.K. (2010). Identification of plant species by using high spatial and spectral resolution thermal infrared (8.0–13.5 μm) imagery. Remote Sensing of Environment, 114, 404-413
Salisbury, J.W. (1986). Preliminary measurements of leaf spectral reflectance in the 8-14 μm region. International Journal of Remote Sensing, 7, 1879-1886
Aerospace/Defense Sensing, Simulation, and Controls (pp. 539-548): International Society for Optics and Photonics
Savitzky, A., & Golay, M.J. (1964). Smoothing and
differentiation of data by simplified least squares procedures. Analytical chemistry, 36, 1627-1639
Schlerf, M., Atzberger, C., & Hill, J. (2005). Remote sensing of forest biophysical variables using HyMap imaging spectrometer data. Remote Sensing of Environment, 95, 177-194
Sepulcre-Cantó, G., Zarco-Tejada, P.J., Jiménez-Muñoz, J., Sobrino, J., De Miguel, E., & Villalobos, F. (2006). Detection of water stress in an olive orchard with thermal remote sensing imagery. Agricultural and Forest Meteorology, 136, 31-44 Turner, D.P., Cohen, W.B., Kennedy, R.E., Fassnacht, K.S., & Briggs, J.M. (1999). Relationships between leaf area index and Landsat TM spectral vegetation indices across three temperate zone sites. Remote Sensing of Environment, 70, 52-68 Ullah (2013). Thermal plants: characterizing vegetation parameters using mid to thermal infrared hyperspectral remote sensing. In: Universiteit Twente
Ullah, S., Schlerf, M., Skidmore, A.K., & Hecker, C. (2012). Identifying plant species using mid-wave infrared (2.5–6μm) and thermal infrared (8–14μm) emissivity spectra. Remote Sensing of Environment, 118, 95-102
Wang, Y., Woodcock, C.E., Buermann, W., Stenberg, P., Voipio, P., Smolander, H., Häme, T., Tian, Y., Hu, J., & Knyazikhin, Y. (2004). Evaluation of the MODIS LAI algorithm at a coniferous forest site in Finland. Remote Sensing of Environment, 91, 114-127
Zheng, G., & Moskal, L.M. (2009). Retrieving leaf area index (LAI) using remote sensing: theories, methods and sensors. Sensors, 9, 2719-2745
This contribution has been peer-reviewed.