1085
EFFECT OF ACTIVATION TIME ON THE PINANG FROND BASED ACTIVATED CARBON FOR REMAZOL BRILLIANT BLUE R REMOVAL
M.A. Ahmad*, S.G. Herawan, and A.A. Yusof
Center of Advanced Research on Energy (CARE) Faculty of Mechanical Engineering
UniversitiTeknikal Malaysia Melaka, Hang Tuah Jaya, 76100 Durian Tunggal, Melaka, MALAYSIA.
*
E-mail: [email protected]
ABSTRACT
Activated carbons are regularly used for dye wastewater treatment. They can be produced from various organic materials which have a high level of carbon content. In this study, Pinang frond based activated carbon (PFAC) was produced by using a physical activation process to study the effect of different activation times in the range of 1–7 hours. The optimum PFAC sample was found with an activation time of 3 hours, which gives the highest BET surface area and pore volume of 958.23 m2/g and 0.5469 mL/g, respectively. This sample shows well-developed pore structure with a high fixed carbon content of 79.74%. The removal of 87.6% of Remazol Brilliant Blue R (RBBR) was achieved for a sample with initial RBBR concentration of 50 mg/L, and 40.8% was achieved with 500 mg/L. The results indicated that the PFAC is very effective for RBBR adsorption from aqueous solution.
Keywords: Activated carbon; Pinang frond; activation time; Remazol brilliant blue R
INTRODUCTION
Activated carbon has been proven to be an effective and widely used adsorbent for the removal of a variety of organic and inorganic pollutants dissolved in aqueous solution [1], or from a gaseous environment [2] Activated carbons used as adsorbent have a comparatively high surface area and total pore volume. The commercially available activated carbons made from petroleum coke, bituminous coal, and lignite are expensive, which limits their use and application [3]. Therefore, other alternative precursors which are inexpensive and abundantly available for activated carbon production have been investigated. From the literature, oil palm stone [4], pinang frond [5], banana stalk [6], bamboo species [7], coffee husk [8], date pits [9], oil palm shell [10] and Parkinsoniaaculeatea wood [11] have all been used to prepare activated carbon.
1086
adsorption of dyes [13]. Nonetheless, too long an activation time will cause the pores to collapse and contribute to an increase in ash content [14].
Around 10,000 different dyes are produced annually from various industrial processes, and together weigh approximately 0.7 million tons [15]. In the textile industry, several varieties of dyes are used, such as reactive dyes, direct dyes, dispersed dyes, acid dyes, and basic dyes.Almost 45% of textiles produced worldwide make use of reactive dyes [16]. Remazol Brilliant Blue R (RBBR) is categorized as a reactive dye. This dye has the favourable characteristics of bright colour, a low energy consumption dyeing process and high solubility in water. The discharge of these reactive dyes in waste waters into receiving streams is highly carcinogenic and toxic to organisms [17]. Many studies have been conducted on the toxicity of dyes and their impact on the ecosystem [18]. Therefore, removal of such dyes from wastewater is very important for the environment.
Pinang (Areca catechu) is a tropical tree which belongs to the Arecaceae family. It mainly grows in a region from East Africa across tropical Asia to the central Pacific [19]. In this paper, utilization of Pinang frond to produce an activated carbon is investigated and is expected to offer a potentially cheap alternative precursor. This Pinang frond based activated carbon (PFAC) is produced via CO2 physical activation.
The effects of activation time on the PFAC’s characteristics and its performance in removing RBBR dye from aqueous solution are presented.
MATERIALS AND METHODS
PFAC Preparation
Pinang frond was obtained from Sungai Petani, Kedah, Malaysia. It was cleaned and subsequently dried at 110 ºC for 24 hours to remove the moisture content. The dried Pinang frond was ground and loaded into a stainless steel vertical tubular reactor placed in a tube furnace. The ramp temperature was set to 20 oC/min to achieve an activation temperature of 800oC under purified nitrogen (99.99%) at a flow rate of 150 ml/min. Once the activation temperature was reached, the activation agent of CO2 was
introduced at flow rates of 300 ml/min for 1–7 hours. The reactor was then cooled down to room temperature under nitrogen flow. The samples produced were stored in an air-tight container for further characterization and adsorption studies.
Characterization of PFAC
1087
analysis was carried out using a simultaneous thermal analyzer (STA) (Perkin Elmer STA 6000, USA). The STA system was interfaced to a microcomputer for data acquisition and control tasks. From the STA results, the moisture, volatile matter, fixed carbon and ash contents can be obtained, where each parameter is represented as a weight loss percentage from the total weight of the sample. The samples were heated from room temperature to 110°C in nitrogen N2 gas until dehydration was completed to
obtain the moisture content. Decomposition was applied to the sample at 900°C to determine the amount of volatile matter. Fixed carbon was obtained by switching the N2
flow to O2 flow. The remaining weight is represented as ash content.
Remazol Brilliant Blue R
Remazol Brilliant Blue R (RBBR) dye supplied by Sigma-Aldrich (M) Malaysia was used as an adsorbate. RBBR has a chemical formula of C22H16N2Na2O11S3 with a
molecular weight of 626.54 g/mol. Deionized water was used to prepare all the reagents and solutions.
Batch Adsorption and Analysis System
Batch adsorption studies were carried out in a set of Erlenmeyer flasks of 250 mL with 200 mL adsorbate solution of known initial concentration. The weight of the adsorbent was fixed at 0.2 g per flask. An isothermal water bath shaker was used at fixed 120 rpm at a constant temperature. The water bath shaker was equipped with a temperature controller which can be set from 25 to 100 ± 0.1 oC and a rotation speed controller which can be fixed up to 250 ±1 rpm. A double-beam Shimadzu UV-Visible spectrophotometer was used to measure the concentration of the adsorbates. According
to Beer’s law, the linear relationship between absorbance and absorbing species
concentration can be written as:
bc A
C i
(1)
where� is the solute concentration (mg/L), Ai is the measured absorbance for
component i, ��is the molar absorptivity coefficient of solute at wavelength λ (nm), and is the path length of the cell (1 cm). The absorbance �� was obtained by the spectrophotometer through 1 cm path length of quartz cell.
The maximum wavelength of the RBBR was 590 nm. The calibration curve for RBBR dye concentration was measured to assure the homogeneity of the absorbance reading. The calibration curve for dye was obtained from the spectrophotometer as the plot of absorbance ��against the solute concentration C. The percentage of dye removal can be calculated by:
1000
%
t t e
C C C
C (2)
1088
Preparation of Stock and Dye Solutions
Dye powder of 1.0 g was dissolved in 1000 mL of deionized water to prepare the concentration of 1 g/L dye solution. Solutions of different initial concentrations, i.e. 50, 100, 200, 300, 400 and 500 mg/L, were prepared by a dilution process of the initial stock solution into 200 mL of deionized water.
RESULTSAND DISCUSSION
Characterization of PFAC
Characterization of PFAC is important in order to determine the properties which affect its adsorption capacity. Characterizations of activated carbon comprising the surface area characteristics, pore size distribution and surface morphology and proximate analysis need to be carried out to verify the efficiencies of an activated carbon in order to study the parameters.
Surface area and pore volume
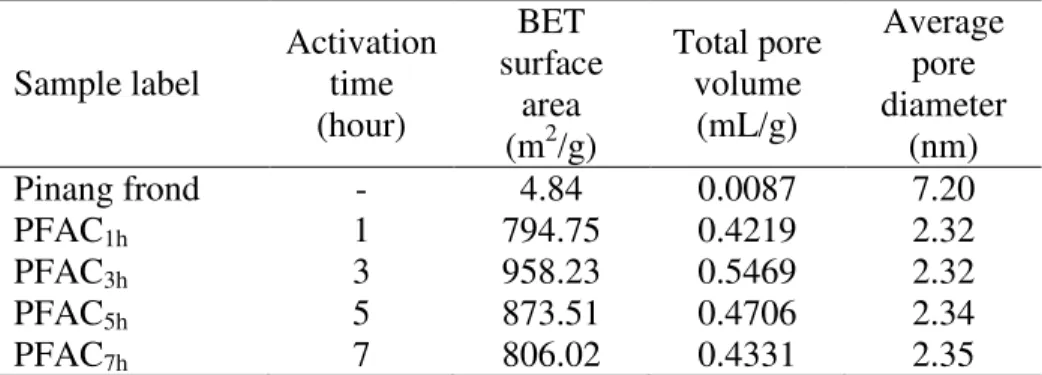
In terms of surface area, pore volume and average pore diameter of the PFAC, the effect on it activation time were studied using the surface area analyzer. Table 1 shows that the PFAC1h is found to have the lowest BET surface area and total pore volume due to the
lower activation time, which prevents optimum development of porosity.
Table 1.Surface area and pore characteristics of the PFAC.
Sample label
Activation time (hour)
BET surface
area (m2/g)
Total pore volume (mL/g)
Average pore diameter
(nm) Pinang frond - 4.84 0.0087 7.20
PFAC1h 1 794.75 0.4219 2.32
PFAC3h 3 958.23 0.5469 2.32
PFAC5h 5 873.51 0.4706 2.34
PFAC7h 7 806.02 0.4331 2.35
Meanwhile, PFAC3h is found to have the highest BET surface area and total pore
volume, at 958.23 m2/g and 0.5469 mL/g, respectively. This result shows that this was sufficient activation time for creating a large specific surface area and high pore volume. But for PFAC5h and PFAC7h the surface area and total pore volume were
slightly reduced compared to PFAC3h, caused by the excessive activation time, which
1089 Pore size distribution
Pore size distribution is a very important property of adsorbents which determines the fraction of the total pore volume accessible to molecules of a given size and shape. According to the classification of the International Union of Pure and Applied Chemistry (IUPAC) classification [20], the pores of absorbers can be grouped into micropores (d < 2 nm), mesopores (d = 2–50 nm) and macropores (d > 50 nm) [21]. Figure 1 illustrates the pore size distribution of the PFAC using the BJH method. From the plot, a singular sharp peak is detected in the range of 2–3 nm, which is in the mesopore region. The mesopore surface area and the mesopore volume of an activated carbon are the most important characteristics required for liquid adsorption, especially for removing dye [22].
Figure 1. Pore size distribution of PFAC using BJH method.
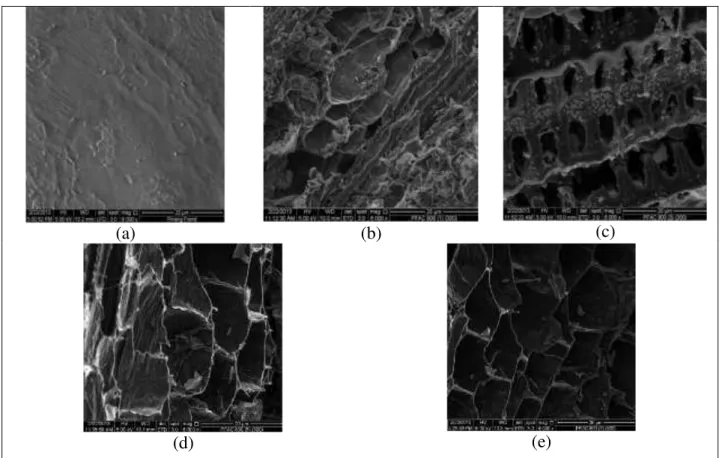
Surface morphology
From the SEM micrographs obtained, the surface structure and pore development on the samples can be clearly seen. Figure 2 represents the surface morphological change of the carbon material during the activation process with different pore shapes. In Figure 2(a), the surface texture of the Pinang frond precursor was rough, uneven, undulating and very few pores were produced on the surface. After the activation process, the PFAC generates more pores, as can be observed in Figure 2(b-e). Figure 2(b) for PFAC1h shows that the porosities have begun to develop, but the porosity
development does not look complete, as there are few pores opening and thick walls. The sample of PFAC3h in Figure 2(c) shows the well-organized development of a pore
structure with larger opening pores, because the activation time is sufficient for porosity to develop. In samples PFAC5h and PFAC7h in Figure 2(d) and Figure 2(e), the pore
1090
(a) (b) (c)
(d) (e)
Figure 2. Scanning electron micrographs: (a) Pinang frond, (b) PFAC1h, (c) PFAC3h, (d)
PFAC5h and (e) PFAC7h.
Proximate analysis
The results for proximate analysis of the samples are tabulated in Table 2. The Pinang frond precursor was found to be high in volatile matter and moisture content. After the activation process, the volatile matter and moisture content decreased significantly, whereas the fixed carbon content increased in the sample. This condition occurs due to the influence of the pyrolytic effect at high temperature, where most of the organic substances have been degraded and discharged both as gas and liquid tars, resulting in a material with high carbon purity [23]. The higher fixed carbon content means a large carbon surface for the adsorbate to be adsorbed. However, the existence of ash may sinter and block the pores, which contributes significantly to decreasing the pores’ surface area [24].
Table 2. Result from proximate analysis.
Sample Moisture (%)
Volatile (%)
Fixed carbon (%)
Ash (%) Pinang frond 14.42 61.30 21.20 3.08
PFAC1h 6.18 20.92 75.25 2.94
PFAC3h 4.54 13.28 79.74 2.44
PFAC5h 4.49 13.25 79.66 2.60
1091
Based on the three previous analyses for the characterization of PFAC, PFAC3h
gives the best result. From the surface area analyzer, PFAC3h has the highest values for
the BET surface area and total pore volume. In the surface morphology study, PFAC3h is
found to have wider opening pores as well as a more organized and stable structure. Again from the proximate analysis, high fixed carbon with low ash content is also found in the PFAC3hsample. Therefore, the PFAC3h sample is chosen for the batch adsorption
studies.
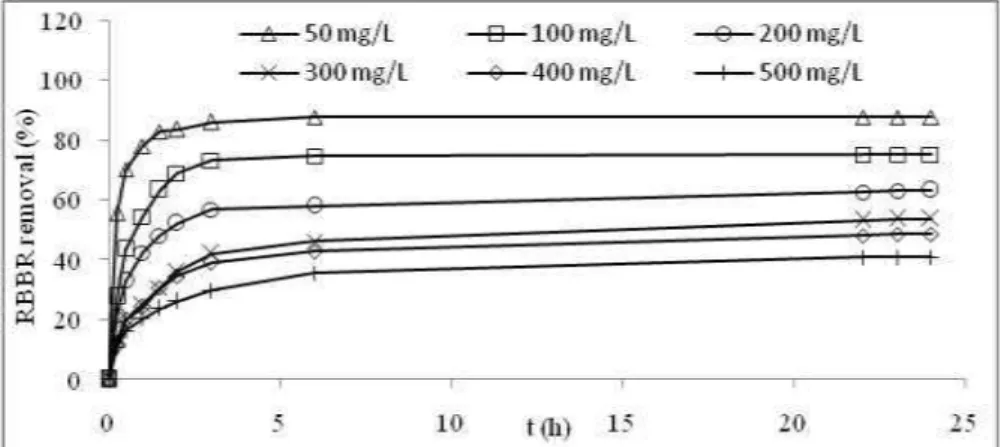
Batch Adsorption Studies of Dye on PFAC
Figure 3 shows the RBBR removal percentage versus the time interval obtained from Eq. (2). It can be seen that the RBBR removal percentage increases with time and reaches a constant value above 20 hours. For the first 5 hours of batch adsorption, a rapid increase in RBBR removal can be observed for all RBBR concentrations. In the time interval of 5–20 hours, the RBBR removal slowly increases and reaches saturation above 20 hours. This condition is due to the fact that a large number of surface sites are available for adsorption at the initial stages, and after the passage of time, the remaining surface sites are difficult to occupy because of the repulsion between the solute molecules of the solid and bulk phases [25]. At the end (24 hours), between 40.8% and 87.6% of the RBBR has been successfully removed at all initial dye concentrations, where the latter is achieved using an initial dye concentration of 50 mg/L. Therefore, the removal percentage of dye is dependent upon the initial concentration.
Figure 3. RBBR percentage removal versus adsorption time at various initial concentrations at 30oC on PFAC3h.
CONCLUSIONS
In the present study, the preparation of activated carbon using Pinang frond from waste precursor has successfully been utilized via a physical activation method. The optimum pyrolysis and activation time of PFAC is found at 3 hours, when the BET surface area, the total pore volume and the fixed carbon content are the highest compared to other activation times. From the surface morphology, the PFAC3h creates well-developed pore
1092
solution. At the equilibrium condition, PFAC3h is capable of adsorbing dye and
removing 87.6% of the RBBR dye at an initial concentration of 50 mg/L. Therefore, the preparation of activated carbon by applying a suitable activation time has been presented to be significant in developing the porosities and adsorption capability of the activated carbon.
ACKNOWLEDGEMENTS
The authors gratefully acknowledge the financial support received from MyBrain, provided by the Ministry of Higher Education Malaysia and Centre of Research and Innovation Management (CRIM),Universiti Teknikal Malaysia Melaka.
REFERENCES
[1] Dias JM, Alvim-Ferraz M, Almeida MF, Rivera-Utrilla J, Sánchez-Polo M. Waste materials for activated carbon preparation and its use in aqueous-phase treatment: a review. Journal of Environmental Management. 2007;85:833-46. [2] Sumathi S, Bhatia S, Lee K, Mohamed A. Selection of best impregnated palm
shell activated carbon (PSAC) for simultaneous removal of SO2 and NOx.
Journal of Hazardous Materials. 2010;176:1093-6.
[3] Gupta V. Application of low-cost adsorbents for dye removal–A review. Journal of environmental management. 2009;90:2313-42.
[4] Lua AC, Guo J. Activated carbon prepared from oil palm stone by one-step CO2
activation for gaseous pollutant removal. Carbon. 2000;38:1089-97.
[5] Herawan SG, Ahmad M, Putra A, Yusof A. Effect of Flow Rate on the Pinang Frond-Based Activated Carbon for Methylene Blue Removal. The Scientific World Journal. 2013;2013.
[6] Bello OS, Ahmad MA, Ahmad N. Adsorptive features of banana (Musa paradisiaca) stalk-based activated carbon for malachite green dye removal. Chemistry and Ecology. 2012;28:153-67.
[7] González P, Pliego-Cuervo Y. Physicochemical and microtextural characterization of activated carbons produced from water steam activation of three bamboo species. Journal of Analytical and Applied Pyrolysis. 2013;99:32-9.
[8] Ahmad MA, Rahman NK. Equilibrium, kinetics and thermodynamic of Remazol Brilliant Orange 3R dye adsorption on coffee husk-based activated carbon. Chemical Engineering Journal. 2011;170:154-61.
[9] Bouchelta C, Medjram MS, Zoubida M, Chekkat FA, Ramdane N, Bellat JP. Effects of pyrolysis conditions on the porous structure development of date pits activated carbon. Journal of Analytical and Applied Pyrolysis. 2012;94:215-22. [10] Herawan S, Hadi M, Ayob MR, Putra A. Characterization of activated carbons
from oil-palm shell by CO2 activation with no holding carbonization
temperature. The Scientific World Journal. 2013;2013.
[11] Nunell G, Fernández M, Bonelli P, Cukierman A. Conversion of biomass from an invasive species into activated carbons for removal of nitrate from wastewater. Biomass and Bioenergy. 2012;44:87-95.
1093
[13] Lua AC, Yang T. Effect of activation temperature on the textural and chemical properties of potassium hydroxide activated carbon prepared from pistachio-nut shell. Journal of Colloid and Interface Science. 2004;274:594-601.
[14] Guo S, Peng J, Li W, Yang K, Zhang L, Zhang S, et al. Effects of CO2 activation
on porous structures of coconut shell-based activated carbons. Applied Surface Science. 2009;255:8443-9.
[15] Senthilkumaar S, Kalaamani P, Porkodi K, Varadarajan P, Subburaam C. Adsorption of dissolved reactive red dye from aqueous phase onto activated carbon prepared from agricultural waste. Bioresource Technology. 2006;97:1618-25.
[16] Tunc Ö, Tanacı H, Aksu Z. Potential use of cotton plant wastes for the removal of Remazol Black B reactive dye. Journal of Hazardous Materials. 2009;163:187-98.
[17] Baskaralingam P, Pulikesi M, Ramamurthi V, Sivanesan S. Modified hectorites and adsorption studies of a reactive dye. Applied clay science. 2007;37:207-14. [18] Vadivelan V, Kumar KV. Equilibrium, kinetics, mechanism, and process design
for the sorption of methylene blue onto rice husk. Journal of Colloid and Interface Science. 2005;286:90-100.
[19] Staples GW, Bevacqua RF. Areca catechu (betel nut palm): Species Profiles for Pacific Island Agroforestry. 2006.
[20] Sing KS. Reporting physisorption data for gas/solid systems with special reference to the determination of surface area and porosity (Recommendations 1984). Pure and Applied Chemistry. 1985;57:603-19.
[21] Deng H, Yang L, Tao G, Dai J. Preparation and characterization of activated carbon from cotton stalk by microwave assisted chemical activation— application in methylene blue adsorption from aqueous solution. Journal of Hazardous Materials. 2009;166:1514-21.
[22] Wei ITA. Preparation, characterization and evaluation of mesoporous activated carbons derived from agricultural by-products for adsorption of methylene blue and 2,4,6- trichlorophenol. Malaysia: Universiti Sains Malaysia; 2008.
[23] Ahmad M, Wan Daud W, Aroua M. CO2/CH4 and O2/N2 kinetic selectivities of oil palm shell-based carbon molecular sieves. Journal of Oil Palm Research. 2008;20:453-60.
[24] Huang Y, JIN B, Zhong Z, Zhong W, Xiao R. Characteristic and mercury adsorption of activated carbon produced by CO2 of chicken waste. Journal of
Environmental Sciences. 2008;20:291-6.