Activation and Lipid Accumulation in Macrophages
Independently of Intracellular ROS Production
Yi Cao, Martin Roursgaard*, Pernille Høgh Danielsen, Peter Møller, Steffen Loft
Section of Environmental Health, Department of Public Health, University of Copenhagen, Copenhagen, Denmark
Abstract
Exposure to nanoparticles (NPs) may cause vascular effects including endothelial dysfunction and foam cell formation, with oxidative stress and inflammation as supposed central mechanisms. We investigated oxidative stress, endothelial dysfunction and lipid accumulation caused by nano-sized carbon black (CB) exposure in cultured human umbilical vein endothelial cells (HUVECs), THP-1 (monocytes) and THP-1 derived macrophages (THP-1a). The proliferation of HUVECs or co-cultures of HUVECs and THP-1 cells were unaffected by CB exposure, whereas there was increased cytotoxicity, assessed by the LDH and WST-1 assays, especially in THP-1 and THP-1a cells. The CB exposure decreased the glutathione (GSH) content in THP-1 and THP-1a cells, whereas GSH was increased in HUVECs. The reactive oxygen species (ROS) production was increased in all cell types after CB exposure. A reduction of the intracellular GSH concentration by buthionine sulfoximine (BSO) pre-treatment further increased the CB-induced ROS production in THP-1 cells and HUVECs. The expression of adhesion molecules ICAM-1 and VCAM-1, but not adhesion of THP-1 to HUVECs or culture dishes, was elevated by CB exposure, whereas these effects were unaffected by BSO pre-treatment. qRT-PCR showed increasedVCAM1expression, but no change inGCLMandHMOX1expression in CB-exposed HUVECs. Pre-exposure to CB induced lipid accumulation in THP-1a cells, which was not affected by the presence of the antioxidant N-acetylcysteine. In addition, the concentrations of CB to induce lipid accumulation were lower than the concentrations to promote intracellular ROS production in THP-1a cells. In conclusion, exposure to nano-sized CB induced endothelial dysfunction and foam cell formation, which was not dependent on intracellular ROS production.
Citation:Cao Y, Roursgaard M, Danielsen PH, Møller P, Loft S (2014) Carbon Black Nanoparticles Promote Endothelial Activation and Lipid Accumulation in Macrophages Independently of Intracellular ROS Production. PLoS ONE 9(9): e106711. doi:10.1371/journal.pone.0106711
Editor:Clarissa Menezes Maya-Monteiro, Fundac¸a˜o Oswaldo Cruz, Brazil
ReceivedAugust 23, 2013;AcceptedAugust 8, 2014;PublishedSeptember 3, 2014
Copyright:ß2014 Cao et al. This is an open-access article distributed under the terms of the Creative Commons Attribution License, which permits unrestricted use, distribution, and reproduction in any medium, provided the original author and source are credited.
Funding:This work was supported by the Centre for Pharmaceutical Nanoscience and Nanotoxicology financed by the Danish Strategic Research Council and by the Lundbeck Foundation Center for Biomembranes in Nanomedicine (CBN). The funders had no role in study design, data collection and analysis, decision to publish, or preparation of the manuscript.
Competing Interests:The authors have declared that no competing interests exist.
* Email: [email protected]
Introduction
Exposure to nanoparticles (NPs) has been suggested to cause vascular health effects with oxidative stress and inflammation as central mechanisms [1]. The NP-mediated vascular effects include expression of endothelial cell adhesion molecules such as intercellular adhesion molecule 1 (ICAM-1) and vascular cell adhesion molecule 1 (VCAM-1), vasomotor dysfunction and accelerated progression of atherosclerosis [1]. The expression of ICAM-1 and VCAM-1 promotes the firm adhesion of monocytes onto the endothelium and the monocytes can subsequently differentiate into macrophages, migrate to the intima and transform to foam cells [2]. It has been shown that exposure of endothelial cells to NPs promotes the expression of ICAM-1 and VCAM-1 as well as adhesion of monocytes onto the endothelial cells [3,4]. Furthermore, it has also been shown that NP exposure induces intracellular lipid accumulation [5–7]. The process of endothelial activation might not require oxidative stress, as suggested by increased adhesion molecule expression by NP exposure in a manner not associated with generation of ROS [8,9]. In addition, it has been shown that addition of the antioxidant ascorbic acid to the cell culture medium did not
alleviate particle-induced ICAM-1 and VCAM-1 expression on human umbilical vein endothelial cells (HUVECs) [10]. On the other hand, NP induced lipid accumulation in rat cells was inhibited by pre-treatment with the antioxidant N-acetylcysteine (NAC) [11].
oxidative stress, whereas the mRNA expression of adhesion molecule VCAM-1as well as the oxidative stress response genes in the NRF-2 signaling pathway, glutamate-cysteine ligase, modifier subunit (GCLM), the rate limiting enzyme in GSH synthesis, and heme oxygenase 1 (HMOX1), one of the essential enzymes in heme catabolism [17], was assessed in HUVECs by qRT-PCR.
Materials and Methods
Cell lines
The HUVECs and culture medium were purchased from Cell Applications (San Diego, CA, USA). The cells were cultured in Endothelial Cell Growth Medium Kit with 2% serum at 37uC in an incubator with 5% CO2. The medium was changed 24–36 h
after seeding and the cells were cultured until they were 90% confluent. The cells were used between passages 2–5 because they maintain their morphologic and phenotypic characteristics within these passages [9,13]. The THP-1 monocytes were obtained from the American Type Culture Collection (Manassas, VA, USA) and was cultured in RPMI with 10% serum as previously described [18]. The THP-1 cells were differentiated into adherent macro-phages (denoted THP-1a) by treatment with 10 ng/ml phorbol 12-myristate 13-acetate (PMA, Sigma, St. Louis, MO, USA) overnight [19]. The THP-1a cells attach to the surface of the culture flasks, whereas THP-1 cells stay in suspension and were removed with the supernatant.
Particles
CB particles (Printex 90) were obtained from Evonik Industries, Frankfurt, Germany (primary particle size 14 nm; surface area 300 m2/g). Printex 90 is an extensively studied model NP and has been characterized elsewhere [20,21]. The mean size of the particles suspended in media was 85638 nm [13]. The uptake of CB in cells has been confirmed by transmission electron micrograph (TEM) [13]. A stock solution of CB was prepared by sonicating a 1 mg/ml suspension of particles in double distilled water (Sigma-Aldrich), using a Branson Sonifier S-450D (Branson Ultrasonics Corp., Danbury, CT, USA) equipped with a disrupter horn (Model number: 101-147-037) before each experiment. The suspension was sonicated for 8 min with alternating 10 s pulses and 10 s pauses at amplitude of 10% and continuously cooling on ice to avoid sample heating and evaporation [13]. After sonication, the suspension was diluted in cell culture medium and used only freshly. For all the experiments except real-time RT-PCR, cells were incubated with 200ml CB solutions in 96-wells plates (growth area 0.32 cm2). The concentrations of CB were 0, 2.5, 12.5, 25,
and 100mg/ml, which were equal to the concentrations of 0, 1.6, 7.8, 15.6, 62.5mg/cm2. Our previous studies showed increased levels of ICAM-1 and VCAM-1 in HUVECs after exposure to these concentrations of CB [9,10,13]. As we observed increased lipid accumulation in THP-1a cells by CB as low as 2.5mg/ml (see in results section), we also included lower concentrations of CB of 0.25, 2.5, 25, 250, 2500 ng/ml, which were equal to the concentrations of 0.16, 1.6, 15.6, 156.3, 1562.5 ng/cm2. For real-time RT-PCR, cells were incubated with 5 ml CB solutions in 6-wells plates.
Cytotoxicity
The cytotoxicity was measured with the WST-1 or lactate dehydrogenase (LDH) assays (Roche Diagnostics GmbH, Mann-heim, Germany) according to the manufacturer’s instructions. The WST-1 assay is regarded to reflect mitochondrial succinate dehydrogenase activity, although it should not be interpreted as
a specific measurement for this enzyme. The LDH assay is considered to reflect leakage of this cytosolic enzyme through the cell membrane to the extracellular fluid.
Briefly, 56104 THP-1, 56104 THP-1a or 26104 HUVECs were seeded in 96-wells plates and incubated with CB for 24 h. Then, the supernatant was collected for LDH assay and cells were rinsed once for WST-1 assay. The cells were incubated with 100ml fresh medium containing 10% WST-1 reagent for 2 h and the absorbance was measured at 450 nm with 630 nm as reference by an ELISA reader (Labsystems, Multiskan Ascent). For LDH assay, 100ml supernatant was incubated with 100ml LDH reaction buffer provided in the kit for 1 h and the absorbance was measured at 490 nm with 630 nm as reference using an ELISA reader. We have previously shown that the CB particles do not interact with LDH enzyme activity [13,22].
Cell viability was further assessed in THP-1 cells by trypan blue exclusion. After exposure of 56104THP-1 cells to 100mg/ml CB, 40ml cell suspension was mixed with 40ml 0.4% trypan blue. The non-colored viable cells and blue-stained non-viable cells were counted in a hemacytometer.
Cell proliferation assay
The proliferation of THP-1 cells and HUVECs was measured with the BrdU cell proliferation assay kit (Roche Diagnostics GmbH, Mannheim, Germany) according to the manufacturer’s instructions. Briefly, 26104THP-1, 56103HUVECs or a mixture of THP-1 or THP-1a (16104) with HUVECs (2.56103) were exposed to CB suspension in the presence of BrdU for 24 h. After exposure, the medium were removed and cells were fixed for 30 min in fix solution, and then the BrdU-labelled DNA was bind to antibody for 90 min in antibody solution. After washing three times, the substrate solution was added to detect the immune complexes. The reaction was stopped with 50ml 2 M HCl, and the absorbance was measured at 450 nm with 690 nm as reference. To confirm the proliferation results of THP-1 cell, 56104/well of THP-1 cells were exposed to 100mg/ml CB for 24 h, and the cell number was counted using a CASY Technology Cell counter (Scharfe System, Stuttgart, Germany). The prolifer-ation of HUVECs was also measured after 24 h exposure to 10 ng/ml vascular endothelial growth factor (VEGF, Gibco, Camarillo, CA, USA) to assess the maximal proliferation capacity or 100 ng/ml tumor necrosis factor (TNF, Gibco, Carlsbad, CA, USA) because it is used as positive control for the expression of cell adhesion molecules (see below). Moreover, we assessed the proliferation of HUVECs after pre-treatment with the Ca2+ chelator BAPTA-AM (10mM; Sigma, St. Louis, MO, USA) for 1 h before the 24 h exposure period because the VEGF-stimulated cell proliferation is mediated by increases in the intracellular Ca2+ concentration [23].
ROS measurement
The intracellular ROS production was measured with the fluorescent probe 29,79-dichlorofluorescein diacetate (DCFH-DA; Invitrogen A/S Taastrup, Denmark) [24]. A 10 mM DCFH-DA stock solution was made in methanol. 56104 THP-1a cells or 26104 HUVECs in a 96-wells plate were stained with 2mM DCFH-DA in Hanks balanced salt solution (Sigma-Aldrich) at 37uC for 15 min and then rinsed twice in Hanks’ balanced salt solution. The THP-1 suspension cells were incubated with probe as described above and then transferred to a 96 well plate as 56104 cells/well. The cells were then incubated with CB in Hanks’ balanced salt solution and the fluorescence was measured every 15 min for 3 h (lex= 485 nm; lem= 538 nm) in a
The accumulated ROS production over time was calculated as the area under the curve (AUC). The results are reported as fold increase compared with the control. The ROS production showed a bell-shaped concentration-effect relationship with a peak level at 12.5mg/ml. This has also been observed in earlier investigations with CB and other types of particles with the same protocol [10,11,25,26]. We show the results from the cell cultures that were exposed to 25 or 100mg/ml, although these results were not included in the statistical analysis.
As we observed increased lipid accumulation in THP-1a cells after 24 h exposure to lower concentrations of CB (see in results section), we also measured intracellular ROS production in THP-1a cells after exposure to lower concentrations of CB. Here 56104 THP-1a cells were exposed to CB concentrations of 0.25, 2.5, 25, 250, 2500 ng/ml for 24 h, rinsed, and the ROS production was measured as indicated above.
We also detected the ROS production by fluorescence microscopy. After exposure, 26104HUVECs or 56104THP-1a on 8-well microscopy chamber slides (Ibidi, Munich, Germany) were stained with 25mM DCFH-DA in medium for 30 min, rinsed twice with medium, and then examined by combined differential interference contrast (DIC) and fluorescence micros-copy in a Leica AF6000 inverted widefield microscope with a 63 times dry objective with NA 0.7 (Leica Microsystems GmbH, Wetzlar, Germany).
Intracellular GSH concentration
The intracellular GSH concentration was measured with the fluorescent probe ThioGlo-1 (Covalent Technologies, Inc., Wal-nut Creek, CA, USA) [27]. A 2 mM ThioGlo-1 stock solution was made in DMSO. 56104 THP-1, 56104 THP-1a or 26104 HUVECs seeded in 96-well plates was incubated with CB for 3 h or 24 h. After exposure, the cells were rinsed once with PBS, incubated with 10mM ThioGlo-1 for approximately 5 min and then measured by fluorescence spectrophotometer (lex= 355 nm;
lem= 460 nm). A standard curve was made by incubating 10mM
ThioGlo-1 with GSH ranged from 16 to 0.125mM (two fold dilution). The GSH concentration is expressed as nmol/106cells, and is considered to be an observation of GSH equivalents.
BSO treatment
The intracellular GSH concentration was reduced by incubat-ing the cells with 100mM of BSO (Sigma-Aldrich, St. Louis, MO, USA) for 24 h. The cells were subsequently rinsed with PBS and exposed to CB or TNF.
THP-1 cell adhesion assay
The adhesion of THP-1 cells onto HUVCs was performed as previously described [3]. Briefly, 26104HUVECs in 96-well plates were co-cultured with 56103 BrdU-labeled THP-1 cells, and exposed to CB or the positive controls TNF (100 ng/ml) and PMA (100 ng/ml) for 24 h. We assessed the CB-mediated interaction between THP-1 cells and BSO pre-treatment HUVECs in co-culture. Only the HUVECs were pre-treated with 100mM of BSO for 24 h because there was increased CB-mediated ROS production in BSO pre-treated HUVECs, but not in THP-1 cells. After exposure, the cells were rinsed twice with 100ml PBS and the BrdU contents both in the co-culture and supernatant were determined according to manufacturer’s instructions (Roche Diagnostics GmbH, Mannheim, Germany) as indicated in Cell proliferating assay section. The percentage of THP-1 cells remaining attached in the co-culture was calculated [3].
Measurement of ICAM-1 and VCAM-1
The surface expression of ICAM-1 and VCAM-1 was measured with a modified ELISA procedure [10,13,26]. The expression of cell adhesion molecules were investigated in cultures with 26104 HUVECs, 1.86104HUVEC+56103TPH-1a, 16104HUVECs +2.56104THP-1a, or 56104THP-1a in 96-well plates. The cells were exposed to CB or TNF as positive control (100 ng/ml) for 24 h. Subsequently, the cells were incubated with anti-ICAM-1 or anti-VCAM-1 (both from R&D systems, Abingdon, UK) in a 1:500 dilution for 1 h at 37uC. After being rinsed for three times in 1% BSA medium, the cells were incubated with 1:25 000 diluted secondary antibody (anti-goat IgG peroxidase coupled antibody; Sigma, MI, USA) in PBS with 0.1% Tween 20 for 1 h on ice. After washing 5 times with ice-cold PBS/Tween 20 solution, the cells were incubated with a substrate solution containing 0.4 mg/ml o-phenylenediamine (OPD; Sigma, St. Louis, MO, USA) and 3.5 mM H2O2 in phosphate-citrate buffer (phosphate-citrate
buffer tablets, Sigma) for 30 min in the dark. The absorbance was measured in at 450 nm.
We assessed the interference of particles with the assay by exposing HUVECs to 100 ng/ml TNF for 24 h to induce the expression of ICAM-1 and VCAM-1, followed by 30 min exposure to CB. This short CB exposure was expected to have little effect on ICAM-1 and VCAM-1 expression on HUVECs, whereas the adherent CB particles might affect the measurement in the ICAM-1 and VCAM-1 assays.
Lipid accumulation in THP-1a cells
The lipid accumulation in THP-1a was measured by the fluorescent probe Nile Red (Sigma, St. Louis, MO, USA). THP-1a cells (56104 cells/well) in 96-well black plates were exposed to various concentrations of CB for 24 h, with or without the presence of 1 mM NAC. After washing, the cells were incubated with either medium containing 1% BSA (for control) or 0.5 mM free fatty acid (FFA; oleic/palmitic acid, 2:1; in medium with 1% BSA) for another 3 h. After one wash, the cells were stained in Hanks solution containing 0.5mg/ml Nile red and 0.01% Pluronic F127 (Sigma-Aldrich, St. Louis, MO) for 15 min in the dark and subsequently rinsed twice. The fluorescence was measured in a fluorescence spectrophotometer (lex= 544 nm, lem= 590 nm).
There was a remarkable decrease in the Nile red signal at the concentration of 100mg/ml; probably due to the interactions of CB with the probe. Therefore we show the results from the cell cultures that were exposed to 0 to 25mg/ml CB.
Gene expression ofGCLM,HMOX1andVCAM1in HUVECs
The mRNA levels of GCLM (Gene ID: 601176), HMOX1 (Gene ID: 141250)and VCAM1(Gene ID: 19225) were measured in HUVECs as previously described [25]. HUVECs (56105cells/ well) were seeded in 0.1% gelatine pre-coated 6-well plates and exposed to 100mg/ml of CB for 3 h. Total RNA was extracted using TRIzol reagent (Invitrogen A/S, Taastrup, Denmark) and treated with DNAse (Promega Biotech AB, Denmark). The cDNA synthesis was done with the High Capacity cDNA Reverse Transcription Kit based on the GeneAmp PCR system 2700. The quantitative RT-PCR reactions were carried out with TaqMan Gene Assays on ABI PRISM 7900HT. All kits were obtained from Applied Biosystems, Naerum, Denmark. We used 18S rRNA as reference gene (Eukaryotic 18S rRNA Endogenous Control, 4352930E, Applied Biosystems, Naerum, Denmark). The gene expression levels were reported as the ratio between the mRNA level of the target genes and the 18S rRNA reference gene using the comparative 22DCtmethod.
Statistics
The results were analyzed by full-factorial ANOVA with least statistical difference as post-hoc test or linear regression analysis using Statistica version 5.5 (StatSoft Inc., Tulsa, OK, USA). Tests for normal distribution of residuals were carried out with the Kolmogorov-Smirnov test. The distribution of residuals for the ROS production did not follow a normal distribution as assessed by the Kolmogorov-Smirnov test, whereas it was by the Shapiro-Wilk test. The results of BSO pretreatment for CB-mediated ROS production in cells were not normally distributed on normal scale, whereas a log-transformation produced residuals that were normally distributed without affecting the statistically significant differences between the groups. The residuals of the ANOVA analysis of the VCAM-1 expression did not follow a normal distribution on either normal or log-transformed scale. However, this was because of a low value for the positive control (TNF) in one experiment; removal of this result produced residuals that followed a normal distribution. For the assessment of the interaction of BSO pretreatment, the residuals of the VCAM-1 expression was not normally distributed, which was due to one high value in the BSO group that was exposed to 25mg/ml of CB. Removal of this result from the regression analysis produced residuals with normal distribution, whereas it did not affect the statistical outcome of the test. P–values,0.05 were considered to be statistically significant.
Results
Cytotoxicity
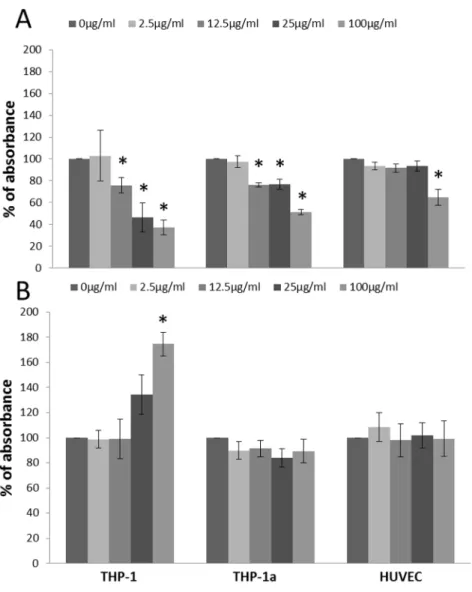
The results from the WST-1 assay showed increased cytotox-icity in the three types of cells at 100mg/ml (P,0.05), whereas the exposure to 12.5 and 25mg/ml of CB also decreased the WST-1 formation THP-1 and THP-1a cells (P,0.05) (Figure 1A). The results from the LDH assay only showed increased membrane leakage at 100mg/ml CB in THP-1 cells (P,0.05) (Figure 1B).
The viability of THP-1 cells after exposure for 24 h to CB was also measured by the trypan blue assay (Figure S1 in File S1). The viability of both the control and 100mg/ml CB exposed THP-1 cells were over 90%, and there was no effect of CB exposure.
BrdU cell proliferation assay
Figure 2 shows that the proliferation rate of THP-1 cells, HUVECs or co-cultures of both cell types was not significantly affected by the 24 h exposure to CB. The cell proliferation rate was also unaltered after treatment with TNF (8364%) or VEGF
(9566%), indicating that the HUVECs had maximal proliferation capacity. The effect of pre-treatment of HUVECs with the Ca2+ chelator BAPTA-AM, which interferes with the VEGF-mediated increase in intracellular Ca2+
concentration, decreased the cell proliferation in HUVECs that were incubated in the presence (2663%) or absence of VEGF (2264%).
To confirm the lack of effect on the THP-1 cells, their number was also counted after 24 h CB exposure (Figure S2 in File S1). The results showed that the exposure to 100mg/ml of CB did not affect the number of THP-1 cells.
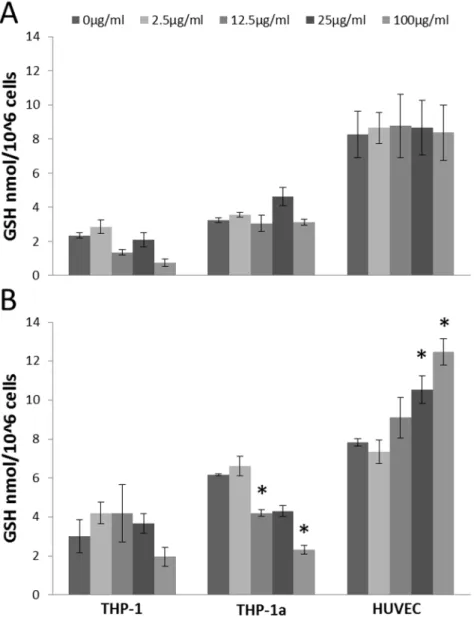
Intracellular GSH concentration
Figure 3 shows the GSH concentration in cells after exposure to CB. The concentration of GSH was unaltered in all cell types after 3 h exposure to CB (Figure 3A). The GSH concentration was decreased in the THP-1a cells after 24 h exposure to 12.5 (P, 0.05), 25 (P = 0.056) and 100mg/ml CB (P,0.05). In the HUVECs, 24 h exposure to 25 or 100mg/ml CB (P,0.05) increased the GSH content, whereas there was no difference in the GSH concentration in the CB exposed THP-1 cells. The experiments for the 3 and 24 h exposures were carried out on different days. Therefore, we have not statistically analyzed for differences in the absolute GSH values in the cells after 3 or 24 h incubation. The exposure to PMA, which was used to activate the THP-1 cells, did not affect the GSH concentration in THP-1 cells (data not shown).
Intracellular ROS production
The 3 h exposure to CB was associated with increased intracellular ROS production in all cell types (Figure 4A). In keeping with earlier findings, we observed bell-shaped concentra-tion-response curves for the intracellular ROS production [10,13], and the results from 25 and 100mg/ml were not included in the statistical analysis as these concentrations are speculated to interfere with the measurements [10,25]. The ROS production was increased at the concentrations of 2.5 and 12.5mg/ml in the THP-1 (P,0.05), THP-1a cells (P,0.05) and HUVECs (P,0.05). The intracellular ROS generation was further directly observed by fluorescent microscopy to investigate the possible interaction between the particles and the measurement. It showed that the CB exposure induced ROS production in a concentration-dependent manner and there was no obvious decline in ROS signal in HUVECs or THP-1a cells after exposure to 100mg/ml CB as compared with control or 12.5mg/ml of CB (Figure S3 in File S1). The exposure to 10 and 100 ng/ml PMA, which was used to activate the THP-1 cells, increased the ROS production in THP-1 cells by 1.36-fold (95% CI: 0.98–1.72) and 1.57-fold (95% CI: 1.13–1.88), respectively (data not shown).
In another set of experiments we pre-treated the cells with 100mM of BSO to reduce the intracellular concentration of GSH. The pre-treatment with 100mM of BSO resulted in a 30% (from 7.2 to 5.0 nmol/106cells), 28% (from 4.7 to 3.4 nmol/106 cells) decrease and no effect (from 4.2–4.7 nmol/106cells) on the level of GSH in HUVECs, THP-1a and THP-1 cells, respectively. This pre-treatment was associated with increased CB-induced ROS production in THP-1 cells exposed to 2.5 (P,0.05) or 12.5mg/ml (P,0.05), whereas the BSO pre-treatment did not affect the CB-induced ROS production in THP-1a cells. The BSO pre-treated HUVECs also showed higher ROS production as compared with non-treated HUVECs after exposure to 2.5 (P,0.05) or 12.5mg/ ml (P,0.05) of CB (Figure 4B).
THP-1a cells after 24 h exposure to lower concentrations of CB to correlate intracellular ROS production with lipid accumulation (Figure 4C). 2500 ng/ml CB exposure significantly increased intracellular ROS production (p,0.05) by 1.29-fold (95% CI: 1.03–1.55 fold), whereas lower concentrations of CB did not significantly affect intracellular ROS production.
ICAM-1 and VCAM-1 surface expression
Figure 5 shows the ICAM-1 and VCAM-1 surface expression after 24 h of CB exposure in HUVECs and THP-1a monocultures and co-cultures of these. The ICAM-1 expression was significantly increased in 100mg/ml CB- exposed HUVEC monocultures (P, 0.01), the co-culture of 1.86104HUVEC+56103THP-1a (P, 0.01), and the TNF-exposed (positive control) (P,0.001) (Fig-ure 5A). The VCAM-1 expression was only significantly increased after 100mg/ml of CB or TNF-treatment in HUVEC monocul-tures (P,0.01) (Figure 5B).
Figure 5C shows the effect of BSO pre-treatment on the CB-mediated expression of ICAM-1 and VCAM-1 in HUVECs. The exposure to CB increased the expression of ICAM-1 (P,0.01) and VCAM-1 (P,0.01), whereas no difference in the slopes of the
CB-mediated concentration-response relationships in HUVECs with-out or with BSO pre-treatment was observed (P = 0.91 for ICAM-1 and P = 0.70 for VCAM-ICAM-1). The slopes (b6SE) were 0.1660.07 (P,0.05) and 0.1560.08 (P = 0.08) for the CB-mediated ICAM-1 expression in HUVECs without or with BSO pre-treatment, respectively. For the CB-mediated VCAM-1 expression in HUVECs, the slopes were 0.1860.08 (P,0.05) and 0.1460.05 (P,0.01) without or with BSO pre-treatment, respectively. The reference control TNF also increased the expression of ICAM-1 (P,0.001) and VCAM-1 (P,0.001) in the HUVECs. The effect of TNF was not affected by pretreatment with BSO for ICAM-1 (P = 0.39) and VCAM-1 (P = 0.15).
The possible interaction effect of CB particles on the ICAM-1 and VCAM-1 assays is shown in Figure S4 in File S1. TNF exposure for 24 h increased the ICAM-1 and VCAM-1 expression approximately 3-fold on HUVECs, whereas a subsequent 30 min exposure to CB only caused a slight decrease in the antibody-based measurement of ICAM-1 and VCAM-1, indicating that no interaction between CB and the antibody-based detection of cell adhesion molecules is taking place.
Figure 1. Cytotoxicity measured by the WST-1 assay (A) and LDH leakage (B) after 24 h CB exposure of THP-1, THP-1a and HUVECs.
The data represent the percentage of absorbance compared with the unexposed control cells. Bars are means 6SEM of three independent experiments. *P,0.05 compared with unexposed cells.
THP-1 adhesion
The CB exposure did not alter the level of adhesion of THP-1 cells to the mono-layer of HUVECs or culture dishes (Figure 6A). The positive control TNF was associated with increased adhesion of THP-1 cells onto HUVECs (P,0.05) and PMA (positive inducer of THP-1a macrophages) significantly increased THP-1 adhesion to both HUVECs (P,0.05) and culture dishes (P,0.05). The pre-treatment of HUVECs with BSO was associated with decreased adhesion of THP-1 cells onto HUVECs in co-cultures that were not exposed to CB (P,0.05) and those that were exposed to TNF (P,0.05). Although we observed a similar tendency in co-cultures exposed to 25mg/ml of CB (P,0.05), it was not a concentration-dependent effect (Figure 6B).
Lipid accumulation in THP-1a cells
The result of the lipid accumulation in THP-1a cells is shown in Figure 7. Pre-exposure to CB for 24 h increased lipid accumula-tion in THP-1a cells with a bell-shaped concentraaccumula-tion-response curve. The CB exposure was associated with a significant increase in lipid accumulation at a concentration of 2.5mg/ml (p,0.05). There was 30% (95% CI: 6.9%–60%) and 36% (95% CI: 11%– 67%) higher lipid load in the cells that had been exposed to 2.5mg/ml of CB and co-treated without or with FAA, respectively. In the cells that had been exposed to 2.5mg/ml of CB and NAC, there was 82% (95% CI: 45%–123%) and 38% (95% CI: 10%– 74%) higher lipid load in cells that were co-treated without or with FFA, respectively. The 3 h exposure to FFA was associated with a minor 11% (95% CI: 3.0%–20%) increase of the lipid level (p, 0.05 for single-factor effect of FFA treatment) (Figure 7A). Pre-exposure to lower concentrations of CB ranging from 2500 ng/ml to 0.25 ng/ml for 24 h also increased lipid accumulation in THP-1a cells with or without further exposure to FFA (p,0.05 for 2500 ng/ml and p,0.01 for other concentrations) (Figure 7B).
Using fluorescence microscopy for further semi-quantitative determination of lipid accumulation, we observed increased lipid accumulation in THP-1a cells that were incubated with CB and/ or FFA. Staining with Nile Red showed predominantly increased lipid content in cells exposed to CB and FFA (Figure 7C), whereas
Bodipy 493/503 staining revealed increased lipid content in CB exposed cells without FFA treatment (Figure 7D). Although the lipid stains differ somewhat in regard to effect of FFA treatment, the collective interpretation from the fluorescence microscopy is that CB exposure is associated with increased lipid content in THP-1a cells.
Gene expressions
Because we observed increased ROS production at 3 h after the CB exposure and increased GSH content in HUVECs at 24 h, we measured the expression ofGCLM, HMOX1andVCAM1 after 3 h exposure to CB. The results showed that CB exposure did not alter the expressions ofGCLM(P = 0.75) andHMOX1(P = 0.97) in HUVECs, whereas there was a concentration- dependent increase inVCAM1expression (P,0.05) (Figure 8).
Discussion
In this study we assessed the in vitro effects of CB exposure on oxidative stress, endothelial activation and foam cell formation which are important events in the early development of atherosclerosis [2]. The results showed that CB exposure increased the expression of ICAM-1 at protein level and VCAM-1 at both protein and gene level in HUVECs, whereas the adhesion of THP-1cells to HUVECs or culture dishes was unaffected by the exposure. In a previous study, we showed that exposure to particles from combustion of diesel or wood was associated with increased VCAM-1 expression, whereas only the wood smoke particles enhanced the adhesion of THP-1 cells onto HUVECs [3]. It is therefore possible that particle-induced monocyte adhesion onto endothelium depends on the activation of both types of cells. Nevertheless, CB exposure has been found to be associated with vasomotor dysfunction in aorta rings and altered pressure-diameter relationship in mesenteric artery segments from mice [13]. These effects correlated with the observations in HUVECs in mono-culture, including increased expression of cell adhesion molecules and ROS production. However, it can be argued that HUVECs mono-culture is a rather simple exposure
Figure 2. Cell proliferation of THP-1 and HUVECs in monocultures or co-culture after 24 h exposure to CB, measured by the BrdU assay.Data are expressed as percentage of absorbance compared with the unexposed cells. The bars are means6SEM of at least three independent experiments with n = 3 for each. *P,0.05 compared with unexposed cells.
system and therefore co-culture was used here. This showed that the addition of THP-1a cells did not increase the CB-mediated expression of ICAM-1 and VCAM-1 on HUVECs. This is in accordance with earlier observations that THP-1 cells did not increase the expression of IL-1b, IL-6, IL-8 and TNF after exposure to CB [28]. Overall, the results indicate that CB possesses the ability to cause a modest activation of endothelial cellsin vitro.
The CB exposure significantly increased the lipid accumulation in THP-1a cells, suggesting that CB exposure may promote the transformation of monocytes to foam cells, which is an important event in the atherogenesis [2]. This is consistent with previous studies showing that NP exposure could induce intracellular lipid accumulation [6,7,11] and it supports the observation that pulmonary exposure to CB accelerated progression of atheroscle-rosis [16]. However, the presence of the antioxidant NAC showed no effect on lipid accumulation induced by CB, and the concentrations of CB needed to induce lipid accumulation were apparently lower than the concentrations to promote intracellular
ROS production in THP-1a cells, which indicated that CB induced lipid accumulation is independent of intracellular ROS production. This is in contrast to the effect of other NPs like cadmium telluride that can induce lipid droplet in an oxidant-dependent way [11].
We measured the intracellular ROS production by the DCHF assay that has been widely used in research on oxidative stress for years [29]. In keeping with earlier findings, we observed bell-shaped concentration-response curves for the intracellular ROS production in experiments were the cells loaded with DFCH before the exposure to CB [10,13,25]. This exposure condition enables the possibility to measure the intracellular ROS produc-tion in real-time, although the limitaproduc-tion is possible quenching of the signal by the particles in the cell culture medium. We have previously shown that addition of DCFH to HepG2 cells after the exposure to CB was associated with increased intracellular ROS production that did not show a bell-shaped concentration-response curve [30]. Those results showed essentially the same trend as the results in Figure S3 in File S1, albeit it was a different cell type.
Figure 3. GSH concentration in HUVECs, THP-1 or THP-1a cells after 3 h (A) or 24 h (B) exposure to CB.Data are expressed as nmol/106 cells and bars are means6SEM of three independent experiments. *P,0.05 compared with unexposed cells.
The collective interpretation of the Printex 90 exposure in our experiments is mediates the generation of intracellular ROS as measured by the DCFH assay. This is supported by studies on other types of probes for intracellular ROS production such as hydroethidium for detection of superoxide anion radicals [31].
It is generally acknowledged that the DCFH assay does not have specificity to particular types of ROS in the context of an intracellular environment. Interestingly some studies have shown that lysosomal permeabilization and subsequent increased release of iron to the cytosol is an important source of intracellular ROS as detected by the DCFH assay [32,33]. Studies in acellular conditions have also highlighted iron or heme-compounds as potent oxidants of DCFH [34,35]. It is therefore possible that the increased intracellular ROS production in CB-exposed cells arises as a consequence of ‘‘free’’ iron from compartments such as the lysosome or mitochondria. We have shown in several studies that CB in acellular conditions oxidizes DCFH [12,13]. In addition, the same type of CB generated ROS in acellular conditions be electron spin resonance [36], indicating the intrinsic ability of CB to generate ROS.
For all cell types there was CB-induced ROS production, whereas the intracellular GSH concentration remained unaffected during the same time period of 3 h CB exposure. To further explore the possible relationship between CB-induced endothelial activation and intracellular ROS level, we reduced the
intracel-lular GSH concentration by BSO pretreatment prior to CB exposure. This increased the CB-induced ROS production especially in the THP-1 cells and HUVECs. The combined results from the BSO pre-treatment experiments indicate that the response is cell type specific, which might be related to thede novo synthesis of GSH and its interaction with other cellular compo-nents of the antioxidant defense system. We did not attempt to completely deplete the GSH because it might render the cells more susceptible to cytotoxicity by exposure to particles [37]. Too low GSH levels may also affect ROS-mediated redox signaling in macrophages, as seen in another study [38]. The BSO treatment did not affect CB-induced ICAM-1 and VCAM-1 surface expression or the THP-1 adhesion to HUVECs, which indicates that endothelial activation by CB exposure could be independent of oxidative stress. This is consistent with earlier observation where maintenance of ascorbate levels in HUVECs attenuated the CB-induced ROS production without affecting the expression of ICAM-1 and VCAM-1 [10]. Indeed, our results showed that depletion of GSH by BSO pre-treatment resulted in slightly reduced ICAM-1 and VCAM-1 expressions by TNF exposure and significantly reduced the TNF-mediated adhesion of THP-1 cells onto HUVECs. This is consistent with the observation that excessive BSO pre-treatment can lead to cellular adaptive response through the activation of the NRF-2 pathway and thus altered cell survival response [39]. However, the CB exposure for
Figure 4. Intracellular ROS production during 3 h incubation with CB in HUVECs, THP-1 or THP-1a cells (A) or cells with or without BSO pre-treatment (B).C. Intracellular ROS production in THP-1a cells after 24 h exposure to lower concentrations of CB. Data are expressed as fold increase of ROS compared with unexposed control cells and bars are means6SEM of 3–4 independent experiments. *P,0.05 compared with unexposed cells.#
3 h did not change the expressions ofGCLMandHMOX1. Up regulation of GCLM with possibly increased synthesis capacity might be related to the elevated GSH levels found after CB
exposure in HUVECs. However, the unalteredHMOX1 expres-sion is consistent with no sign of oxidative stress and even elevated GSH levels despite ROS formation detected by DCFH in
HUVECs. In contrast, it has been shown that the VCAM1 expression was sensitive to fluctuations in the redox state and mediators that are generated by inflammation [40], whereas the expression of VCAM-1 did not depend on the superoxide anion radical levels in vessel segments form mice [41]. Indeed, we observed an increased expression of VCAM1 after the 3 h exposure to CB. This indicates that the gene expression of VCAM-1 might be sensitive to intracellular generation of ROS without overt oxidative stress, or that the mRNA up regulation is unrelated to ROS formation like the enhanced expression of VCAM-1 on the plasma membrane of HUVECs induced by CB. PMA was used to differentiate THP-1 cells to become adherent macrophage-like cells (THP-1a cells). It has been suggested that ROS have an initial signaling role for the differentiation of THP-1 cells to macrophages [19]. Here we also found that PMA treatment slightly increased ROS production in THP-1 cells, although this was much lower than the CB-induced ROS
production. However, the slightly increased ROS production of THP-1a cells as compared with undifferentiated THP-1cells could also be related to higher phagocytosis activity in the former as also evidenced by higher mitochondrial activity and oxidative respira-tion [42]. The CB induced ROS producrespira-tion was not associated with enhanced adhesion of THP-1 cells to HUVECs or culture dishes.
We measured cell viability by several methods to determine concentrations with minimum cytotoxicity in order to be able to interpret the data related to atherosclerosis processes. The WST-1 and LDH assays are considered to be indicators of effect to mitochondria and cell membrane, respectively, whereas the proliferation ability can be regarded as an overall indicator of the cellular well-being in as much as the cells will not proliferate if they are damaged. The exposure to CB at high concentration was associated with cytotoxicity in THP-1 cells, without any effect on the proliferation in the same exposure period or decreased viability
Figure 6. THP-1 adhesion to HUVEC cells or culture dishes assessed by BrdU labeling after 24 h CB exposure (A).In a separate experiment, HUVECs were exposed to 100mM of BSO for 24 h before they were exposed to CB in co-culture with THP-1 cells (B). Data are expressed
as percentage of adherent THP-1 cells compared with the total number of THP-1 cells (cell culture+supernatant) and bars are means6SEM of three independent experiments *P,0.05 compared with unexposed cells,#
P,0.05 compared with co-cultures where the HUVECs were not pre-treated with BSO.
assessed by trypan blue exclusion. This is in agreement with earlier observations that the LDH release was increased in A549 lung epithelial cells after exposure to diesel exhaust particles, although it had little effect on the ability to proliferate and form colonies [43]. There were increased oxidative stress endpoints and lipid accumulation at the concentration of 2.5mg/ml, whereas the expression of ICAM-1 and VCAM-1 was increased at 25 and 100mg/ml. These are high but typical concentrations in particle toxicology. The relevance to the human exposure situation is difficult to assess firmly because studies on translocation usually use other types of particles, which can be traced systemically. In perspective, the dose was 1 mg/mouse by i.t. instillation in a study that showed increased level of atherosclerosis after exposure to CB [16]. This corresponds to 10mg/ml in blood, assuming 1% translocation of the deposited dose in a blood volume of 1 ml in mice. It has further been estimated that a 24 h exposure to1 mg/ m3of NPs with a diameter around 14–20 nm would correspond to an average exposure of 0.15mg/cm2lung surface, which equals 0.24mg/ml (240 ng/ml) in 96-wells plates [44]. This corresponds to a concentration of 2.4 ng/ml in blood, assuming the same 1% translocation to 1 ml blood. As the Occupational Exposure Limit
Figure 7. Accumulation of lipids in THP-1a cells after 24 h exposure to CB with or without the presence of NAC (A) or lower concentrations of CB (B) and subsequently treated with free fatty acids (FFA) for 3 h.Data are expressed as percentage increase of lipid accumulation compared with unexposed control cells and bars are means 6SEM of 4–10 independent experiments. *P,0.05 compared with unexposed cells. Semi-quantitative determination of lipid accumulation were performed by microscopy with Nile Red and Bodipy 493/503: C) Cells are stained with Nile Red (red) and Hoechst (blue), D) Cells are stained with Bodipy 493/503 (green) and Hoechst (blue) and representative images are shown in top, and calculation of the lipid fluorescence area per cell shown below calculated from 5 independent areas with SEM.
doi:10.1371/journal.pone.0106711.g007
Figure 8. mRNA expression of GCLM, HMOX1 and VCAM1 in HUVECs after exposure to CB for 3 h.The symbols represent the mean and SEM of three independent experiments. #
P,0.05 (linear regression analysis).
for carbon black is 3.5 mg/m3, the exposure concentration levels used in this study were high and endothelial cells and monocytes will probably never be exposed to such concentrations in vivo. Nevertheless, the mechanistic effects have to be investigated both in realistic concentrations as well as under circumstances where effects are observable. On the other hand, we found an increase in the lipid accumulation by CB at concentrations ranging from 2.5mg/ml to 0.25 ng/ml, which could be achievedin vivo. As in atherosclerosis, there are increased level of differentiated macro-phages adherent to the endothelium [2], CB exposure could promote the lipid laden foam cell formationin vivo.
In conclusion, the results showed that exposure to nano-sized CB increased the expression of ICAM-1 and VCAM-1 on endothelial cells. This expression was not enhanced by BSO pre-treatment, although BSO augmented the CB-mediated ROS generation. In addition, CB exposure increased the lipid accumulation in THP-1 macrophages, but the presence of antioxidants did not affect the lipid accumulation induced by CB. Further, very low concentrations of CB promoted lipid accumulation without obvious effect on intracellular ROS
production. Our results suggest that CB induces endothelial adhesion molecule expression and foam cell formation indepen-dent of CB-induced ROS generation.
Supporting Information
File S1 Figure S1. Cytotoxicity of CB on THP-1 cells after 24 h exposure as measured by trypan blue assay. Figure S2. Cell number of THP-1 cells after 24 h CB. Figure S3. Representative micrographs showing the intracellular ROS production after 3 h incubation with CB in HUVECs or THP-1a cells. Figure S4. Interaction effect of a 30 min CB exposure on the ICAM-1 and VCAM-1 assays.
(DOC)
Author Contributions
Conceived and designed the experiments: YC MR PM SL. Performed the experiments: YC MR PD. Analyzed the data: YC MR PD PM SL. Contributed reagents/materials/analysis tools: PM SL. Wrote the paper: YC MR PD PM SL.
References
1. Moller P, Mikkelsen L, Vesterdal LK, Folkmann JK, Forchhammer L, et al. (2011) Hazard identification of particulate matter on vasomotor dysfunction and progression of atherosclerosis. Crit Rev Toxicol 41: 339–368.
2. Packard RRS, Libby P (2008) Inflammation in Atherosclerosis: From Vascular Biology to Biomarker Discovery and Risk Prediction. Clin Chem 54: 24–38. 3. Forchhammer L, Loft S, Roursgaard M, Cao Y, Riddervold IS, et al. (2012)
Expression of adhesion molecules, monocyte interactions and oxidative stress in human endothelial cells exposed to wood smoke and diesel exhaust particulate matter. Toxicol Lett 209: 121–128.
4. Montiel-Davalos A, Ibarra-Sanchez MD, Ventura-Gallegos JL, Alfaro-Moreno E, Lopez-Marure R (2010) Oxidative stress and apoptosis are induced in human endothelial cells exposed to urban particulate matter. Toxicol in Vitro 24: 135– 141.
5. Cao Y, Jacobsen NR, Danielsen PH, Lenz AG, Stoeger T, et al. (2014) Vascular Effects of Multiwalled Carbon Nanotubes in Dyslipidemic ApoE-/- Mice and Cultured Endothelial Cells. Toxicological Sciences 138: 104–116.
6. Przybytkowski E, Behrendt M, Dubois D, Maysinger D (2009) Nanoparticles can induce changes in the intracellular metabolism of lipids without compromising cellular viability. FEBS J 276: 6204–6217.
7. Tsukahara T, Haniu H (2011) Nanoparticle-mediated intracellular lipid accumulation during C2C12 cell differentiation. Biochem Biophys Res Commun 406: 558–563.
8. Gojova A, Guo B, Kota RS, Rutledge JC, Kennedy IM, et al. (2007) Induction of inflammation in vascular endothelial cells by metal oxide nanoparticles: Effect of particle composition. Environ Health Perspect 115: 403–409.
9. Mikkelsen L, Jensen KA, Koponen IK, Saber AT, Wallin H, et al. (2012) Cytotoxicity, oxidative stress and expression of adhesion molecules in human umbilical vein endothelial cells exposed to dust from paints with or without nanoparticles. Nanotoxicology 7: 117–134.
10. Frikke-Schmidt H, Roursgaard M, Lykkesfeldt J, Loft S, Nojgaard JK, et al. (2011) Effect of vitamin C and iron chelation on diesel exhaust particle and carbon black induced oxidative damage and cell adhesion molecule expression in human endothelial cells. Toxicol Lett 203: 181–189.
11. Khatchadourian A, Maysinger D (2009) Lipid Droplets: Their Role in Nanoparticle-Induced Oxidative Stress. Mol Pharm 6: 1125–1137.
12. Jacobsen NR, Pojana G, White P, Moller P, Cohn CA, et al. (2008) Genotoxicity, cytotoxicity, and reactive oxygen species induced by single-walled carbon nanotubes and C-60 fullerenes in the FE1-Muta (TM) mouse lung epithelial cells. Environ Mol Mutagen 49: 476–487.
13. Vesterdal LK, Mikkelsen L, Folkmann JK, Sheykhzade M, Cao Y, et al. (2012) Carbon black nanoparticles and vascular dysfunction in cultured endothelial cells and artery segments. Toxicol Lett 214: 19–26.
14. Moller P, Jacobsen NR, Folkmann JK, Danielsen PH, Mikkelsen L, et al. (2010) Role of oxidative damage in toxicity of particulates. Free Radic Res 44: 1–46. 15. Vesterdal L, Folkmann J, Jacobsen N, Sheykhzade M, Wallin H, et al. (2010) Pulmonary exposure to carbon black nanoparticles and vascular effects. Part Fibre Toxicol 7: 33.
16. Niwa Y, Hiura Y, Murayama T, Yokode M, Iwai N (2007) Nano-sized carbon black exposure exacerbates atherosclerosis in LDL-receptor knockout mice. Circ J 71: 1157–1161.
17. Kensler TW, Wakabayash N, Biswal S (2007) Cell survival responses to environmental stresses via the Keap1-Nrf2-ARE pathway. Annu Rev Pharmacol Toxicol 47: 89–116.
18. Danielsen PH, Loft S, Kocbach A, Schwarze PE, Moller P (2009) Oxidative damage to DNA and repair induced by Norwegian wood smoke particles in human A549 and THP-1 cell lines. Mutat Res 674: 116–122.
19. Traore K, Trush MA, George M, Spannhake EW, Anderson W, et al. (2005) Signal transduction of phorbol 12-myristate 13-acetate (PMA)-induced growth inhibition of human monocytic leukemia THP-1 cells is reactive oxygen dependent. Leuk Res 29: 863–879.
20. Bourdon J, Saber A, Jacobsen N, Jensen K, Madsen A, et al. (2012) Carbon black nanoparticle instillation induces sustained inflammation and genotoxicity in mouse lung and liver. Part Fibre Toxicol 9: 5.
21. Jackson P, Hougaard KS, Boisen AM, Jacobsen NR, Jensen KA, et al. (2012) Pulmonary exposure to carbon black by inhalation or instillation in pregnant mice: effects on liver DNA strand breaks in dams and offspring. Nanotoxicology 6: 486–500.
22. Jacobsen NR, Saber AT, White P, Moller P, Pojana G, et al. (2007) Increased mutant frequency by carbon black, but not quartz, in the lacZ and cII transgenes of muta mouse lung epithelial cells. Environ Mol Mutagen 48: 451–461. 23. McLaughlin AP, De Vries GW (2001) Role of PLCgamma and Ca(2+) in
VEGF- and FGF-induced choroidal endothelial cell proliferation. Am J Physiol Cell Physiol 281: C1448–C1456.
24. Dikalov S, Griendling KK, Harrison DG (2007) Measurement of Reactive Oxygen Species in Cardiovascular Studies. Hypertension 49: 717–727. 25. Danielsen PH, Moller P, Jensen KA, Sharma AK, Wallin H, et al. (2011)
Oxidative Stress, DNA Damage, and Inflammation Induced by Ambient Air and Wood Smoke Particulate Matter in Human A549 and THP-1 Cell Lines. Chem Res Toxicol 24: 168–184.
26. Hemmingsen JG, Moller P, Nojgaard JK, Roursgaard M, Loft S (2011) Oxidative Stress, Genotoxicity, And Vascular Cell Adhesion Molecule Expression in Cells Exposed to Particulate Matter from Combustion of Conventional Diesel and Methyl Ester Biodiesel Blends. Environ Sci Technol 45: 8545–8551.
27. Cao Y, Liang S, Zheng Y, Liu D, Zhang B, et al. (2011) Induction of GSNO reductase but not NOS in the lungs of mice exposed to glucan-spiked dust. Environ Toxicol 26: 279–286.
28. Murphy F, Schinwald A, Poland C, Donaldson K (2012) The mechanism of pleural inflammation by long carbon nanotubes: interaction of long fibres with macrophages stimulates them to amplify pro-inflammatory responses in mesothelial cells. Part Fibre Toxicol 9: 8.
29. Chen X, Zhong Z, Xu Z, Chen L, Wang Y (2010) 29, 79 -Dichlorodihydro-fluorescein as a fluorescent probe for reactive oxygen species measurement: Forty years of application and controversy. Free Radic Res 44: 587–604. 30. Vesterdal LK, Danielsen PH, Folkmann JK, Jespersen LF, Aguilar-Pelaez K,
et al. (2013) Accumulation of lipids and oxidatively damaged DNA in hepatocytes exposed to particles. Toxicol Appl Pharmacol 10.
31. Hussain S, Thomassen L, Ferecatu I, Borot MC, Andreau K, et al. (2010) Carbon black and titanium dioxide nanoparticles elicit distinct apoptotic pathways in bronchial epithelial cells. Particle and Fibre Toxicology 7: 10. 32. Karlsson M, Kurz T, Brunk UT, Nilsson SE, Frennesson CI (2010) What does
the commonly used DCF test for oxidative stress really show? Biochem J 428: 183–190.
34. LeBel CP, Ischiropoulos H, Bondy SC (1992) Evaluation of the probe 29, 79 -dichlorofluorescin as an indicator of reactive oxygen species formation and oxidative stress. Chem Res Toxicol 5: 227–231.
35. Zhu H, Bannenberg GL, Moldeus P, Shertzer HG (1994) Oxidation pathways for the intracellular probe 29, 79-dichlorofluorescein. Arch Toxicol 68: 582–587. 36. Peebles BC, Dutta PK, Waldman WJ, Villamena FA, Nash K, et al. (2011) Physicochemical and toxicological properties of commercial carbon blacks modified by reaction with ozone. Environ Sci Technol 45: 10668–10675. 37. Anderson CP, Reynolds CP (2002) Synergistic cytotoxicity of buthionine
sulfoximine (BSO) and intensive melphalan (L-PAM) for neuroblastoma cell lines established at relapse after myeloablative therapy. Bone Marrow Transplanta-tion 30: 135–140.
38. Forman HJ, Fukuto JM, Torres M (2004) Redox signaling: thiol chemistry defines which reactive oxygen and nitrogen species can act as second messengers. Am J Physiol Cell Physiol 287: C246–C256.
39. Speciale A, Anwar S, Ricciardi E, Chirafisi J, Saija A, et al. (2011) Cellular adaptive response to glutathione depletion modulates endothelial dysfunction triggered by TNF-alpha. Toxicol Lett 207: 291–297.
40. Cook-Mills JM, Marchese ME, Abdala-Valencia H (2011) Vascular Cell Adhesion Molecule-1 Expression and Signaling During Disease: Regulation by Reactive Oxygen Species and Antioxidants. Antioxid Redox Signal 15: 1607– 1638.
41. Willett NJ, Kundu K, Knight SF, Dikalov S, Murthy N, et al. (2011) Redox Signaling in an In Vivo Murine Model of Low Magnitude Oscillatory Wall Shear Stress. Antioxid Redox Signal 15: 1369–1378.
42. Jantzen K, Roursgaard M, Desler C, Loft S, Rasmussen LJ, et al. (2012) Oxidative damage to DNA by diesel exhaust particle exposure in co-cultures of human lung epithelial cells and macrophages. Mutagenesis 27: 693–701. 43. Danielsen P, Loft S, Moller P (2008) DNA damage and cytotoxicity in type II
lung epithelial (A549) cell cultures after exposure to diesel exhaust and urban street particles. Part Fibre Toxicol 5: 6.