Vibrational spectroscopic study of poldervaartite CaCa[SiO
3
(OH)(OH)]
Ray L. Frost
a,⇑, Andrés López
a, Ricardo Scholz
b, Rosa Malena Fernandes Lima
c aSchool of Chemistry, Physics and Mechanical Engineering, Science and Engineering Faculty, Queensland University of Technology, GPO Box 2434, Brisbane, Queensland 4001, Australia b
Geology Department, School of Mines, Federal University of Ouro Preto, Campus Morro do Cruzeiro, Ouro Preto, MG 35,400-00, Brazil c
Mining Engineering Department, School of Mines, Federal University of Ouro Preto, Campus Morro do Cruzeiro, Ouro Preto, MG 35,400-00, Brazil
h i g h l i g h t s
We have studied the structure of the mineral poldervaartite
CaCa[SiO3(OH)](OH).
It forms a series with its manganese analogue olmiite
CaMn[SiO3(OH)](OH). We used scanning electron
microscopy, thermogravimetric analysis, Raman and infrared spectroscopy.
Thermogravimetric analysis proves the mineral decomposes at 485°C with a mass loss of 7.6%.
Vibrational spectroscopy enables a detailed assessment of the molecular structure of poldervaartite.
g r a p h i c a l
a b s t r a c t
a r t i c l e
i n f o
Article history:
Received 14 July 2014
Received in revised form 25 August 2014 Accepted 11 September 2014
Available online 22 September 2014
Keywords:
Poldervaartite Silicate
Thermogravimetric analyses Scanning electron microscopy Infrared and Raman spectroscopy
a b s t r a c t
We have studied the mineral poldervaartite CaCa[SiO3(OH)(OH)] which forms a series with its
manga-nese analogue olmiite CaMn[SiO3(OH)](OH) using a range of techniques including scanning electron
microscopy, thermogravimetric analysis, Raman and infrared spectroscopy. Chemical analysis shows the mineral is reasonably pure and contains only calcium and manganese with low amounts of Al and F. Thermogravimetric analysis proves the mineral decomposes at 485°C with a mass loss of 7.6% compared with the theoretical mass loss of 7.7%. A strong Raman band at 852 cm1is assigned to the
SiO stretching vibration of the SiO3(OH) units. Two Raman bands at 914 and 953 cm1are attributed
to the antisymmetric vibrations. Intense prominent peaks observed at 3487, 3502, 3509, 3521 and 3547 cm1are assigned to the OH stretching vibration of the SiO
3(OH) units. The observation of multiple
OH bands supports the concept of the non-equivalence of the OH units. Vibrational spectroscopy enables a detailed assessment of the molecular structure of poldervaartite.
Ó2014 Elsevier B.V. All rights reserved.
Introduction
The mineral poldervaartite CaCa[SiO3(OH)(OH)] is a silicate min-eral of calcium[1]. Sometimes, the formula is written as (Ca,Mn2+)
2 -SiO3(OH)2. The Mn dominant analogue of poldervaartite is olmiite[2].
The mineral poldervaartite CaCa[SiO3(OH)](OH), forms a series with olmiite, ideally CaMn[SiO3(OH)](OH), its Mn analogue –[1,3]. The chemical formula of olmiite[4]is correctly calculated from the EPMA data (Mn > 0.5 and Ca < 1.5 atom per formula unit (a.p.f.u.)). For the mineral chemistry of poldervaartite (Ca > 1.5 and Mn < 0.5 a.p.f.u). This mineral was first found in South Africa at the N’Chwaning II mine of the Kalahari manganese fields and occurs as a product of hydrothermal alteration of primary sedimentary and low-grade
http://dx.doi.org/10.1016/j.saa.2014.09.017
1386-1425/Ó2014 Elsevier B.V. All rights reserved.
⇑ Corresponding author. Tel.: +61 7 3138 2407; fax: +61 7 3138 1804.
E-mail address:[email protected](R.L. Frost).
Contents lists available atScienceDirect
Spectrochimica Acta Part A: Molecular and
Biomolecular Spectroscopy
metamorphic ores in a temperature range from 250°C to 400°C.
Usu-ally, poldervaartite occurs in association with celestine, bultfontei-nite, olmiite, sturmanite and hematite[1,3].
The mineral is orthorhombic with point group: 2/m 2/m 2/m. The mineral occurs as wheat-sheaf aggregates with a crystal length reaching up to 7 mm. The space group is Pbca witha= 9.398(1), b= 9.139(2),c= 10.535(2) Å andZ= 8. Olmiite crystallizes in the orthorhombic crystal system, with unit cell parameters a= 9.243(3),b= 9.076(9),c= 10.342(9) Å.V= 868(1) Å3 [1,3]. The atomic arrangement of poldervaartite is similar to that of olmiite. Variations in bond distances and angles are related to the pronounced difference in the Ca and Mn content. The structure of both poldervaartite and olmiite can be schematically described, for convenience, as a sequence along [0 1 0] of alternating layers containing M2 + Si and M1 polyhedra, respectively. Nonetheless, the strong three-dimensional linkage among the polyhedral units results in a rather isotropic framework, as pointed out by Dai
[1,3]. Olmiite consists of isolated SiO3(OH) tetrahedra continuously connected along the [100] direction to two M2O7 polyhedra by sharing edges. The M2–Si chains are linked together by corner sharing to form waved sheets parallel to (0 1 0). Alternating sheets are linked together by M1 octahedra and hydrogen bonds, result-ing in a strongly bonded polyhedral network[1,3].
Recently, the authors undertook a study of the mineral olmiite
[4]. In this work, we have studied the mineral poldervaartite CaCa [SiO3(OH)(OH)] using scanning electron microscopy, thermogravi-metric analyses and vibrational spectroscopy. The combination of scanning electron microscopy (SEM) and vibrational spectroscopy has proven a success for the study of the chemistry and molecular structure of minerals[5–10]. In this work we also related the Raman and FTIR spectra of poldervaartite to the structure of the mineral.
Experimental
Samples description and preparation
The poldervaartite sample studied in this work was obtained from the collection of the Geology Department of the Federal University of Ouro Preto, Minas Gerais, Brazil, with sample code SAD-041. The sample is from the type locality in N’ Chwaning II mine of the Kalahari manganese fields, South Africa. The mineral occurs in association with calcite and manganese oxides.
The compositions have been reported by Anthony et al. (page 192) [11]. The sample was gently crushed and the associated minerals were removed under a stereomicroscope Leica MZ4. Qualitative and semiquantitative chemical analysis via SEM/EDS were applied to the mineral characterization.
Scanning electron microscopy (SEM)
Experiments and analyses involving electron microscopy were performed in the centre of Microscopy of the Universidade Federal de Minas Gerais, Belo Horizonte, Minas Gerais, Brazil (http:// www.microscopia.ufmg.br).
Poldervaartite crystals were coated with a 5 nm layer of evapo-rated carbon. Secondary Electron and Backscattered Electron images were obtained using a JEOL JSM-6360LV equipment. Qual-itative and semi-quantQual-itative chemical analyses in the SEM/EDS mode were performed with a ThermoNORAN spectrometer model Quest and was applied to support the mineral characterization.
Thermogravimetric analysis – TG/DTG
Thermogravimetric analysis of the poldervaartite mineral was obtained by using TA Instruments Inc. Q50 high-resolution TGA
operating at a 10°C/min ramp with data sample interval of
0.50 s/pt from room temperature to 1000°C in a high-purity
flow-ing nitrogen atmosphere (100 cm3/min). A total mass of 41.92 mg of finely ground samples was heated in an open platinum crucible.
Raman microprobe spectroscopy
Crystals of poldervaartite were placed on a polished metal sur-face on the stage of an Olympus BHSM microscope, which is equipped with 10, 20, and 50 objectives. The microscope is part of a Renishaw 1000 Raman microscope system, which also includes a monochromator, a filter system and a CCD detector (1024 pixels). The Raman spectra were excited by a Spectra-Phys-ics model 127 He–Ne laser producing highly polarized light at 633 nm and collected at a nominal resolution of 2 cm1and a pre-cision of ±1 cm1 in the range between 200 and 4000 cm1. Repeated acquisitions on the crystals using the highest magnifica-tion (50) were accumulated to improve the signal to noise ratio of the spectra. Raman Spectra were calibrated using the 520.5 cm1 line of a silicon wafer. The Raman spectrum of at least 10 crystals was collected to ensure the consistency of the spectra.
An image of the poldervaartite crystals measured is shown in the graphical abstract. Clearly the crystals of poldervaartite are readily observed, making the Raman spectroscopic measurements readily obtainable.
Infrared spectroscopy
Infrared spectra of poldervaartite were obtained using a Nicolet Nexus 870 FTIR spectrometer with a smart endurance single bounce diamond ATR cell. Spectra over the 500–4000 cm1range were obtained by the co-addition of 128 scans with a resolution of 4 cm1and a mirror velocity of 0.6329 cm/s. Spectra were co-added to improve the signal to noise ratio.
Spectral manipulation such as baseline correction/adjustment and smoothing were performed using the Spectracalc software package GRAMS (Galactic Industries Corporation, NH, USA). Band component analysis was undertaken using the Jandel ‘Peakfit’ soft-ware package that enabled the type of fitting function to be selected and allows specific parameters to be fixed or varied accordingly. Band fitting was done using a Lorentzian–Gaussian cross-product function with the minimum number of component bands used for the fitting process. The Lorentzian–Gaussian ratio was maintained at values greater than 0.7 and fitting was undertaken until reproducible results were obtained with squared correlations ofr2greater than 0.995.
Results and discussion
Chemical characterization
The SEM image of poldervaartite sample studied in this work is shown inFig. 1. The image shows a poldervaartite crystal aggre-gate. The mineral occurs in association with small amounts of manganese oxides. Qualitative chemical analysis shows a Ca and Mn silicate (Fig. 2). Traces of Al and F were noted. No other elements were detected. The chemical analysis of olmiite shows a Ca and Mn silicate[4].
Thermal analysis
The temperature range for the mass loss is very narrow. The following chemical reaction is proposed for the thermal decompo-sition of poldervaartite:
CaMn½SiO3ðOHÞðOHÞ !CaMnSiO4þH2O
Vibrational spectroscopy
Vibrational spectroscopy of poldervaartite
The Raman spectrum of poldervaartite in the 100–4000 cm1 spectral range is displayed in Fig. 3a. This spectrum shows the position and relative intensities of the Raman bands. It is noted that there are large parts of the spectrum where no intensity or minimal intensity is observed. Thus, the spectrum is subdivided into subsections depending upon the type of vibration being stud-ied. The infrared spectrum of poldervaartite in the 500–4000 cm1 spectral region is shown inFig. 3b. This figure shows the position of the infrared bands and their relative intensities. As for the Raman spectrum, there are parts of the spectrum where little or no inten-sity is observed.
The Raman spectrum of poldervaartite over the 700–1000 cm1 spectral range is shown inFig. 4a. The Raman spectrum is dominated by an intense peak at 852 cm1. Dowty showed that the SiO
3units had a unique band position of 980 cm1[12](seeFigs. 2 and 4of this
reference). Dowty also showed that Si2O5units had a Raman peak at around 1100 cm1. Poldervaartite consists of isolated SiO
3(OH) tet-rahedra continuously connected along the [100] direction to two M2O7 polyhedra by sharing edges. The M2–Si chains are linked together by corner sharing to form waved sheets parallel to (0 10). Alternating sheets are linked together by M1 octahedra and hydro-gen bonds, resulting in a strongly bonded polyhedral network
[1,3]. Thus, the Raman peak at 852 cm1 is assigned to the SiO stretching vibration of the SiO3(OH) units. In the Raman spectrum of olmiite[4]the band position was found at 853 cm1. The two bands of poldervaartite at 900 and 917 cm1with a low intensity shoulder at 907 cm1are attributed to the antisymmetric vibrations of the SiO3(OH) units. The position of these bands for olmiite[4] were found at 914 and 953 cm1. The two Raman bands of pold-ervaartite at 792 and 807 cm1are attributed to the SiOH deforma-tion modes. These two bands were found for olmiite[4]at 799 and 811 cm1.
The infrared spectrum of poldervaartite over the 650 to 1050 cm1spectral range is shown inFig. 4b. Strong infrared bands are observed at 858 and 970 cm1. This latter band together with the infrared bands at 877, 897 and 926 cm1are assigned to the SiO antisymmetric stretching vibrations. The infrared band at 858 cm1is ascribed to the SiO symmetric stretching band. Other infrared bands are observed at 780, 786, 800 and 815 cm1. If we follow the assignment of the Raman bands, then these bands are due to hydroxyl deformation modes.
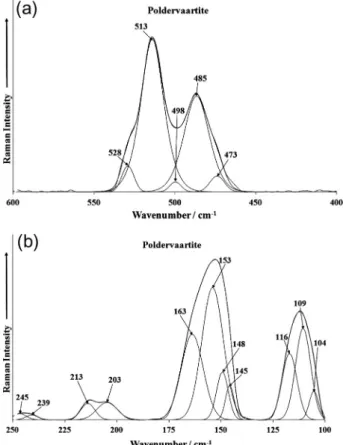
The Raman spectra over the 400–600 cm1spectral range and over the 100–250 cm1 spectral range are presented in Fig. 5. Raman bands noted at 485 and 513 cm1 are assigned to OSiO bending modes. Dowty calculated the band position of these bend-ing modes for different siloxane units[12]and demonstrated the
Fig. 1.Backscattered electron (BSE) image of a poldervaartite crystal aggregate up to 0.5 mm in length.
Fig. 2.EDS analysis of poldervaartite.
Fig. 3.(a) Raman spectrum of poldervaartite over the 100–4000 cm1spectral
range (upper spectrum). (b) Infrared spectrum of poldervaartite over the 500– 4000 cm1spectral range (lower spectrum).
band position of the bending modes for SiO3 units is located at around 650 cm1. This calculated value is in harmony with the higher wavenumber band observed at 663 cm1as calculated by Dowty. According to Adams et al.[13], the band at 432 cm1 is due to the coincidence of both theB2gandEgmodes. Raman bands are observed in the far low wavenumber region at 104, 109, 116, 145, 148, 153, 163, 203, 213 cm1. These bands are simply described as lattice vibrations.
The Raman spectrum of poldervaartite over the 3400–3650 cm1 spectral range is reported inFig. 6a. Prominent peaks are observed at 3487, 3502, 3509, 3521 and 3547 cm1. These bands are assigned to the OH stretching vibration of the SiO3(OH) units. The observa-tion of multiple bands proves that the OH groups are not equivalent
Fig. 4.(a) Raman spectrum of poldervaartite (upper spectrum) over the 1000– 1150 cm1 spectral range and (b) infrared spectrum of poldervaartite (lower
spectrum) over the 650–1150 cm1spectral range.
Fig. 5.(a) Raman spectrum of poldervaartite (upper spectrum) over the 400– 800 cm1 spectral range and (b) Raman spectrum of poldervaartite (lower
spectrum) over the 100–400 cm1spectral range.
Fig. 6.(a) Raman spectrum of poldervaartite (upper spectrum) over the 2800– 4000 cm1 spectral range and (b) infrared spectrum of poldervaartite (lower
spectrum) over the 2800–3800 cm1spectral range.
Fig. 7.Infrared spectrum of poldervaartite over the 1200–1800 cm1 spectral
in the poldervaartite structure. The infrared spectrum of pold-ervaartite over the 3000–3800 cm1 spectral range is shown in
Fig. 6b. Infrared bands are found at 3494, 3509 and 3540 cm1with a broad shoulder at 3425 cm1. The infrared bands support the con-cept of the non-equivalence of the OH units in the poldervaartite structure. The broad feature may be ascribed to water stretching modes; however, no water bending mode was observed in the infra-red spectrum in the 1500–1800 cm1spectral range. Some infrared bands were observed in the 1200–1800 cm1spectral range (Fig. 7). Infrared bands are observed at 1305, 1323, 1332 and 1377 cm1. These bands are all related to SiO vibrations. Infrared bands are observed at 1609 and 1640 cm1and are probably due to water bending modes.
Conclusions
We have studied the mineral poldervaartite CaCa[SiO3 (OH)](OH) which forms a continuous series with its manganese analogue olmiite CaMn[SiO3(OH)](OH) using a combination of electron microscopy with EDS analysis, thermogravimetric analy-sis, infrared and Raman spectroscopy. These temperatures are below the thermal decomposition of poldervaartite of 502°C.
Raman spectroscopy identifies a peak at 852 cm1assigned to the SiO stretching vibration of the SiO3(OH) units. Strong infrared bands observed at 858 and 970 cm1are assigned to this vibration. Prominent peaks are observed at 3487, 3502, 3509, 3521 and 3547 cm1and are assigned to the OH stretching vibration of the SiO3(OH) units. The equivalent infrared bands found at 3494, 3509 and 3540 cm1supports the concept of the non-equivalence of the OH units in the poldervaartite structure. Vibrational spec-troscopy enables a detailed assessment of the molecular structure of poldervaartite to be attained.
Acknowledgements
The financial and infra-structure support of the Discipline of Nanotechnology and Molecular Science, Science and Engineering Faculty of the Queensland University of Technology, is gratefully acknowledged. The Australian Research Council (ARC) is thanked for funding the instrumentation.
Appendix A. Supplementary material
Supplementary data associated with this article can be found, in the online version, athttp://dx.doi.org/10.1016/j.saa.2014.09.017.
References
[1]Y. Dai, G.E. Harlow, A.R. McGhie, Am. Min. 78 (1993) 1082–1087.
[2]P. Bonazzi, L. Bindi, O. Medenbach, R. Pagano, G.I. Lampronti, S. Menchetti, Min. Mag. 71 (2007) 193–201.
[3]R. Pagano, A. Guastoni, F. Pezzotta, Min. Rec. 39 (2008) 373–381.
[4]R.L. Frost, R. Scholz, A. Lopez, Y. Xi, A. Granja, Z. Zigovecki Gobac, R.M.F. Lima, J. Mol. Struct. 1053 (2013) 22–26.
[5]R.L. Frost, A. Lopez, R. Scholz, Y. Xi, C. Lana, Spectrochim. Acta, Part A 128 (2014) 408–412.
[6]R.L. Frost, A. Lopez, R. Scholz, Y. Xi, J. Mol. Struct. 1059 (2014) 40–43. [7]R.L. Frost, A. Lopez, R. Scholz, Y. Xi, Spectrochim. Acta, Part A (2014) (ahead of
print).
[8]R.L. Frost, A. Lopez, F.M. Belotti, Y. Xi, R. Scholz, Spectrochim. Acta, Part A 127 (2014) 243–247.
[9]R.L. Frost, R. Scholz, A. Lopez, Y. Xi, S. Queiroz Camila de, M. Belotti Fernanda, M. Candido Filho, Spectrochim. Acta, Part A 118 (2014) 430–437.
[10] R.L. Frost, A. Lopez, Y. Xi, R. Scholz, L. Gandini Antonio, Spectrochim. Acta, Part A 118 (2014) 987–991.
[11]J.W. Anthony, R.A. Bideaux, K.W. Bladh, M.C. Nichols, Handbook of Mineralogy, Mineral Data Publishing, Tucson, Arizona, USA, 2003.
[12]E. Dowty, Phys. Chem. Min. 14 (1987) 80–93.
[13]D.M. Adams, R.S. Armstrong, S.P. Best, Inorg. Chem. 20 (1981) 1771–1776.