Infrared and Raman spectroscopic characterization of the carbonate
mineral huanghoite – And in comparison with selected rare earth
carbonates
Ray L. Frost
a,⇑, Andrés López
a, Ricardo Scholz
b, Yunfei Xi
a, Fernanda Maria Belotti
caSchool of Chemistry, Physics and Mechanical Engineering, Science and Engineering Faculty, Queensland University of Technology, GPO Box 2434, Brisbane, Queensland 4001, Australia bGeology Department, School of Mines, Federal University of Ouro Preto, Campus Morro do Cruzeiro, Ouro Preto, MG 35,400-00, Brazil
cFederal University of Itajubá, Campus Itabira, Itabira, MG, Brazil
h i g h l i g h t s
We have undertaken a study of huanghoite using vibrational spectroscopy.
A comparison is made with spectra of other halogenated carbonates.
Multiple carbonate stretching vibrations proved that there are non-equivalent carbonate units.
Raman bands in the OH stretching region gives evidence for OH units in the huanghoite structure.
a r t i c l e
i n f o
Article history: Received 15 May 2013
Received in revised form 15 July 2013 Accepted 26 July 2013
Available online 20 August 2013
Keywords: Huanghoite Carbonate Molecular structure Raman spectroscopy Infrared spectroscopy
a b s t r a c t
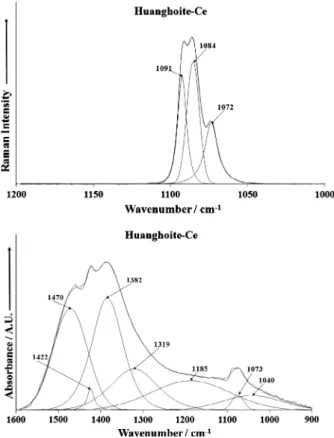
Raman spectroscopy complimented with infrared spectroscopy has been used to study the rare earth based mineral huanghoite with possible formula given as BaCe(CO3)2F and compared with the Raman spectra of a series of selected natural halogenated carbonates from different origins including bastnasite, parisite and northupite. The Raman spectrum of huanghoite displays three bands are at 1072, 1084 and 1091 cm 1attributed to the CO2
3 symmetric stretching vibration. The observation of three symmetric stretching vibrations is very unusual. The position of CO2
3 symmetric stretching vibration varies with mineral composition. Infrared spectroscopy of huanghoite show bands at 1319, 1382, 1422 and 1470 cm 1. No Raman bands of huanghoite were observed in these positions. Raman spectra of bastna-site, parisite and northupite show a single band at 1433, 1420 and 1554 cm 1assigned to the
m3(CO3)2 antisymmetric stretching mode. The observation of additional Raman bands for them3modes for some halogenated carbonates is significant in that it shows distortion of the carbonate anion in the mineral structure. Four Raman bands for huanghoite are observed at 687, 704, 718 and 730 cm 1and assigned to the (CO3)2 m2bending modes. Raman bands are observed for huanghoite at around 627 cm 1and are assigned to the (CO3)2 m4bending modes. Raman bands are observed for the carbonatem4in phase bending modes at 722 cm 1for bastnasite, 736 and 684 cm 1for parisite, 714 cm 1for northupite. Raman bands for huanghoite observed at 3259, 3484 and 3589 cm 1are attributed to water stretching bands. Multiple bands are observed in the OH stretching region for bastnasite and parisite indicating the presence of water and OH units in their mineral structure. Vibrational spectroscopy enables new information on the structure of huanghoite to be assessed.
Ó2013 Elsevier B.V. All rights reserved.
1. Introduction
The carbonates are a group of over 150 naturally occurring min-erals containing the essential structural building block (CO3)2 . Most of these minerals are relatively rare and quite often in asso-ciation with other building blocks such as hydroxyls, halogens, sul-fate, silicate, and phosphate. Among these minerals is the carbonate mineral huanghoite BaCe(CO3)2F. The mineral is one of
the synchysite mineral group which includes synchysite-Ce Ca(Ce,La)(CO3)2F, synchysite-Nd Ca(Nd,Y,Gd)(CO3)2F, synchysite-Y Ca(Y,Ce)(CO3)2F. The importance of these rare earth minerals is that the minerals are a source of rare earths including lanthanum, yttrium and cerium.
There are a number of halogen containing carbonates including bastnaesite (often written as bastnasite and bastnäsite) [(Ce,La)CO3F], parisite [(Ce2,Ca)(CO3)F2], northupite [(Na2, Mg)(CO3)2F], and phosgenite [Pb2CO3Cl][1]. In fact this group of minerals supplies more than 70% of the world’s supply of rare earths. In addition minerals based upon hydroxbastnasite are also
0022-2860/$ - see front matterÓ2013 Elsevier B.V. All rights reserved. http://dx.doi.org/10.1016/j.molstruc.2013.07.051
⇑ Corresponding author. Tel.: +61 7 3138 2407; fax: +61 7 3138 1804. E-mail address:[email protected](R.L. Frost).
Contents lists available atScienceDirect
Journal of Molecular Structure
known but little or no information is available for this mineral
[2–4]. It is probable that the mineral decrespignyite-(Y) is
structur-ally related to bastnäsite–synchysite–parsite group all of which adopt a hexagonal or at least a pseudohexagonal layered structure based upon repeat units of REE—CO23 (F,OH)[5–7]. Bastnäsite is one of three carbonate-fluoride minerals. There is bastnäsite-(Ce) with a formula of (Ce,La)CO3F. There is bastnäsite-(La) with a for-mula of (La, Ce)CO3F. There is also bastnäsite-(Y) with a forfor-mula of (Y, Ce)CO3F. Most bastnäsite is bastnäsite-(Ce), and cerium is by far the most common of the rare earths in this class of minerals. Bastnäsite is closely related to the mineral parisite; both are rare earth fluorocarbonates. Parisite formula varies depending upon the locality of origin and may be generalized as [Ca(Ce,La,Nd)2(-CO3)F2]. Bastnasite forms a series with the mineral hydroxybastn-asite. This latter mineral has a formula [(Ce,La)CO3(OH,F)] in which hydroxyl units substitute for the fluorine.
The crystal structures of most halogenated carbonates have been studied[8–10]including huanghoite [11–14]. However the crystal structure of decrespignyite is not known or defined. The crystal structure of parisite is said to be rhombohedral but the structure depends on the composition and origin of the mineral
[8,15–19]. The infrared spectra of bastnasite, parisite and
northu-pite have been published[20,21]. According to Farmer[1], bastna-site is hexagonal and the carbonate units lie on the 6(h) bastna-sites with point symmetryCs. The internal modes of the carbonate ion are symmetrical with little evidence of splitting. In the infrared spec-tra, the only evidence of symmetry reduction is the appearance of a low intensity band in the
m
1position. The infrared spectra ofparisite has been said to show low site symmetry and the presence of more than one carbonate type in the unit cell. Adler and Kerr ob-served splitting of
m
1andm
4vibrational modes[20]. Farmer statesthat northupite has a highly symmetrical structure and is a rare example of a carbonate with a cubic structure[1]. The structure is complex with 16 formula units in the face-centred cubic cell. As a consequence of the reduction in symmetry from D3h toC3, all bands are both infrared and Raman active.
Raman spectroscopy has proven most useful for the study of diagenetically related minerals as often occurs with carbonate minerals[22–24].
The objective of this paper is to report the vibrational spectro-scopic study of a huanghoite mineral and relate the spectra to the molecular chemistry and the crystal chemistry of this carbon-ate mineral. We have characterized huanghoite using Raman and infrared spectroscopy, with support of scanning electron micros-copy in the mineral characterization.
2. Experimental
2.1. Samples description and preparation
The huanghoite sample studied in this work was obtained from the collection of the Geology Department of the Federal University of Ouro Preto, Minas Gerais, Brazil, with sample code SAB-116. The sample is from the type locality for the mineral, the Bayan Obo de-posit, Inner Mongolia Autonomous Region, China[25]. The mineral occurs in association with aegirine.
The sample was gently crushed and the associated minerals were removed under a stereomicroscope Leica MZ4. Scanning elec-tron microscopy (SEM) was applied to support the mineralogical characterization.
2.2. Scanning electron microscopy (SEM)
Experiments and analyses involving electron microscopy were performed in the Center of Microscopy of the Universidade Federal
de Minas Gerais, Belo Horizonte, Minas Gerais, Brazil (http://
www.microscopia.ufmg.br).
Huanghoite single crystal up to 2 mm was coated with a 5 nm Au. Secondary Electron and Backscattering Electron images were obtained using a JEOL JSM-6360LV equipment. A qualitative and semi-quantitative chemical analysis in the EDS mode was per-formed with a ThermoNORAN spectrometer model Quest and was applied to support the mineral characterization.
2.3. Raman microprobe spectroscopy
Crystals of huanghoite were placed on a polished metal surface on the stage of an Olympus BHSM microscope, which is equipped with 10, 20, and 50 objectives. The microscope is part of a Renishaw 1000 Raman microscope system, which also includes a monochromator, a filter system and a CCD detector (1024 pixels). The Raman spectra were excited by a Spectra-Physics model 127 He–Ne laser producing highly polarized light at 633 nm and col-lected at a nominal resolution of 2 cm 1 and a precision of ±1 cm 1in the range between 200 and 4000 cm 1. Repeated acqui-sitions on the crystals using the highest magnification (50) were accumulated to improve the signal to noise ratio of the spectra. Raman Spectra were calibrated using the 520.5 cm 1line of a sili-con wafer. The Raman spectrum of at least 10 crystals was col-lected to ensure the consistency of the spectra.
2.4. Infrared spectroscopy
Infrared spectra were obtained using a Nicolet Nexus 870 FTIR spectrometer with a smart endurance single bounce diamond ATR cell. Spectra over the 4000–525 cm 1 range were obtained by the co-addition of 128 scans with a resolution of 4 cm 1and a mirror velocity of 0.6329 cm/s. Spectra were co-added to improve the signal to noise ratio. The infrared spectra are given in the sup-plementary information.
Spectral manipulation such as baseline correction/adjustment and smoothing were performed using the Spectracalc software package GRAMS (Galactic Industries Corporation, NH, USA). Band component analysis was undertaken using the Jandel ‘Peakfit’ soft-ware package that enabled the type of fitting function to be se-lected and allows specific parameters to be fixed or varied accordingly. Band fitting was done using a Lorentzian–Gaussian cross-product function with the minimum number of component bands used for the fitting process. The Gaussian–Lorentzian ratio was maintained at values greater than 0.7 and fitting was under-taken until reproducible results were obtained with squared corre-lations ofr2greater than 0.995.
3. Results and discussion
3.1. Chemical composition of huanghoite
The SEM image of huanghoite sample studied in this work is shown inFig. 1. The image shows a homogeneous fragment with no zonation or associated minerals. Qualitative chemical analysis shows a Ba, Ce and F carbonate with minor amounts of Nd
(Fig. 2). The observed elements via SEM/EDS are in agreement with
the chemical composition of huanghoite.
3.2. Spectroscopy of the carbonate anion
Nakamoto et al.[26]first published and tabulated the selection rules for unidenate and bidentate anions including the carbonate anion. The free ion, CO2
out-of-plane bend (
m
2), a doubly degenerate asymmetric stretch(
m
3) and another doubly degenerate bending mode (m
4). Thesym-metries of these modes are A0
1(R) + A002(IR) + E0(R, IR) + E00(R, IR) and occur at 1063, 879, 1415 and 680 cm 1respectively. Generally, strong Raman modes appear around 1100 cm 1due to the sym-metric stretching vibration (
m
1), of the carbonate groups, whilein-tense IR and weak Raman peaks near 1400 cm 1 are due to the antisymmetric stretch (
m
3). Infrared modes near 800 cm 1arede-rived from the out-of-plane bend (
m
2). Infrared and Raman modesaround 700 cm 1region are due to the in-plane bending mode (
m
4). This mode is doubly degenerate for undistorted CO23 groups. As the carbonate groups become distorted from regular planar sym-metry, this mode splits into two components. Infrared and Raman spectroscopy provide sensitive test for structural distortion of CO23 .3.3. Spectroscopy
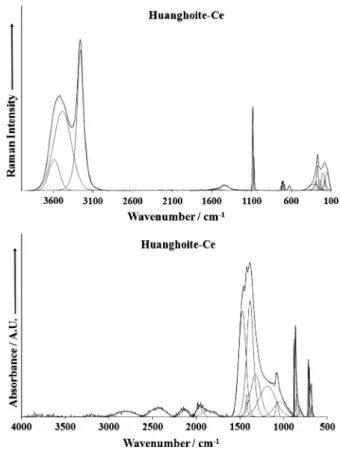
The Raman spectrum of huanghoite in the 100–4000 cm 1 spec-tral range is displayed inFig. 3a. This figure shows the position and relative intensities of the Raman bands. There are large parts of the spectrum where no intensity is observed and thus, the spectrum is divided into sections depending upon the type of vibration being studied. The infrared spectrum of huanghoite over the 500– 4000 cm 1spectral range is shown inFig. 3b. Again, there are large parts of the spectrum where no intensity is observed, and the spec-trum may be subdivided into sections according to the type of vibration being examined.
The Raman spectrum of huanghoite in the 800–1400 cm 1 spec-tral range is displayed inFig. 4a. The spectrum is dominated by a very intense sharp band at 1084 cm 1assigned to the CO2
3
m
1 sym-metric stretching mode. The main band has shoulders at 1072 and 1091 cm 1. Low intensity Raman bands are found at 1350, 1371 and 1385 cm 1. These bands are attributed to the CO23
m
3 antisym-metric stretching modes. In the infrared spectrum shown inFig. 4b, the CO23m
1symmetric stretching mode is observed as a number of bands at 1057 and 1065 cm 1with shoulder bands at 1048, 1072 and 1080 cm 1.The Raman spectra of huanghoite in the 500–800 cm 1spectral range and in the 100–500 cm 1 spectral range are illustrated in
Fig. 5. Four Raman bands for huanghoite are observed at 687,
704, 718 and 730 cm 1and assigned to the (CO3)2
m
2 bending modes. Raman bands are observed for huanghoite at 619, 632 and 635 cm 1and are assigned to the (CO3)2
m
4bending modes. Raman bands are observed for the carbonate
m
4in phase bendingmodes at 722 cm 1for bastnasite, 736 and 684 cm 1for parisite, 714 cm 1for northupite. The Raman spectrum in the far low wave-number region (Fig. 5b) shows a broad spectral feature which may be resolved into component bands at 150, 181, 244, 270, 292 cm 1. These bands are simply described as lattice vibrations.
The Raman spectrum of huanghoite in the 2800–3800 cm 1 spectral range is reported inFig. 6. Raman bands are observed at 3259, 3484 and 3589 cm 1. These bands are attributed to water stretching vibrations. The observation of water bands in the Raman spectrum of huanghoite is unexpected as the formula suggests that no water is present.
A comparison may be made with the hydroxyl stretching region of the other halogenated minerals.
The Raman spectrum of bastnasite displays bands in similar positions at 3651, 3620, 3526, 3355, 3276, 3169 and 3203 cm 1. The three higher wavenumber bands (3651, 3620, 3526 cm 1) Fig. 1.Backscattered electron image (BSI) of a huanghoite crystal up to 0.5 mm in
length.
Fig. 2.EDS spectra of huanghoite.
are most likely assignable to OH stretching vibrations. Raman spec-tra of a Chinese bastnasite have been published but no specspec-tral
information is available for comparison in this spectral region
[27]. Another study reported some Raman data for rare earth car-bonates [28,29]. However no spectral information in the OH stretching region was reported. The Raman spectrum of the hydroxybastnasite shows several bands at 3741, 3535, 3430, 3352 and 3317 cm 1. For this mineral OH units replace F in a com-plex structure. It is possible that all of this set of bands is attribut-able to OH stretching vibrations. Aleksandrov described two types of bastnasites namely fluorobastnasite and hydroxybastnasite[29]. Another paper described the IR spectra in this spectral region with no detail except to state bands were observed[4]. For the mineral parisite broad bands in the OH stretching region are observed. Four Raman bands are observed at 3661, 3517, 3316 and 3180 cm 1.
4. Conclusions
Raman spectroscopy has been used to characterize the mineral huanghoite and a comparison made with other halogenated car-bonates including bastnasite, hydroxybastnasite, parisite and northupite. The spectra of the minerals are dependent upon the mineral origin and its formulation. The halogenated carbonates are characterized by (CO3)2 symmetric stretching modes in the 1078–1090 cm 1spectral range. In the case of huanghoite three Raman bands are found suggesting three non-equivalent (CO3)2 units in the huanghoite structure. This concept is supported by the observation of multiple bands in the antisymmetric stretching region. Infrared bands of huanghoite occur at 1391, 1414, 1489 and 1547 cm 1. These bands are assigned to the CO2
3
m
3antisymmetric stretching mode. Two low intensity bands at 1504 and 1432 cm 1 for bastnasite are assigned to them
3 (CO3)2 antisymmetricstretching mode.
The complexity of the symmetric stretching region is reflected in the (CO3)2 bending region. Four Raman bands for huanghoite are observed at 791, 815, 837 and 849 cm 1and are assigned to the (CO3)2
m
2 bending modes. Two Raman bands at 865 and 845 cm 1 for bastnasite are assigned to the
m
2 (CO3)2 bending mode. Raman bands are observed for decrespignyite at 694, 718 and 746 cm 1and are assigned to the (CO3)2
m
4bending modes. Raman spectroscopy shows both the presence of water and OH units in certain selected minerals from this group even though the suggested formula does not show any OH units being present. The Raman spectra of bastnasite show bands at 3651, 3620, 3526, 3355, 3276, 3169 and 3203 cm 1. For the mineral parisite broad bands in the OH stretching region with bands observed at 3516, 3310 and 3178 cm 1. For parisite four Raman bands are observed at 3661, 3517, 3316 and 3180 cm 1. A generalized formula may be written as [Ca(Ce,La,Nd)2(CO3)F2]. Raman spectroscopy suggests a general formula [(Ce,La)CO3(OH,F)xH2O]. The presence of OH -Fig. 4.(a) Raman spectrum of huanghoite over the 800–1400 cm 1spectral range.
(b) Infrared spectrum of huanghoite over the 500–1300 cm1spectral range.
Fig. 5.(a) Raman spectrum of huanghoite over the 300–800 cm 1spectral range. (b) Raman spectrum of huanghoite over the 100–300 cm 1spectral range.
anion suggest the partial substitution of F by OH and the existence of a F–OH series between huangoite-Ce and an undescribed min-eral phase where OH is dominant in the structure.
Raman spectroscopy supports the concept that the position of the (CO3)2 bands is a function of the chemical composition of the halogenated mineral. Farmer (pp 278) showed that the (CO3)2 symmetric stretching band varied according to the ionic radius of the cation[1]. Raman spectroscopy supports the concept that the symmetry of the carbonate anion is maintained in the structure of bastnasite, parisite and northupite, even though many minerals have significant amounts of Ce, La or Y in the formula. The carbonate anion in the mineral hydroxybastnasite is of lower symmetry.
Acknowledgements
The financial and infra-structure support of the Discipline of Nanotechnology and Molecular Science, Science and Engineering Faculty of the Queensland University of Technology, is gratefully acknowledged. The Australian Research Council (ARC) is thanked for funding the instrumentation. The authors would like to acknowledge the Center of Microscopy at the Universidade Federal de Minas Gerais (http://www.microscopia.ufmg.br) for providing the equipment and technical support for experiments involving electron microscopy. R. Scholz thanks to CNPq – Conselho Nacional de Desenvolvimento Científico e Tecnológico (Grant No. 306287/ 2012-9).
References
[1] V.C. Farmer, Mineralogical Society Monograph 4: The Infrared Spectra of Minerals, 1974.
[2]Z. Maksimovic, G. Panto, The occurrence and genesis of the hydroxyl-bastnaesites from Montenegro, Yugoslavia, Bulletin – Academie Serbe des Sciences et des Arts, Classe des Sciences Mathematiques et Naturelles: Sciences Naturelles 27 (1987) 15–20. 14 plates.
[3]H. Wakita, S. Kinoshita, Bull. Chem. Soc. Jpn. 52 (1979) 428–432. [4]Z. Maksimovic, G. Panto, Mineral. Mag. 49 (1985) 717–720.
[5]R.L. Frost, M.J. Dickfos, Spectrochim. Acta Part A Mol. Biomol. Spectrosc. 71A (2008) 143–146.
[6]R.L. Frost, M. Dickfos, Polyhedron 26 (2007) 4503–4508. [7]R.L. Frost, M.J. Dickfos, J. Raman Spectrosc. 38 (2007) 1516–1522. [8]G. Donnay, J.D.H. Donnay, Am. Mineral. 38 (1953) 932–963. [9]T. Watanabe, Sci. Pap. Inst. Phys. Chem. Res. (Japan) 21 (1933) 40–62. [10] H. Shiba, T. Watanabe, Compt. Rend. 193 (1931) 1421–1423. [11]H.-F. Fan, Y.-Y. Chang, K.-C. Chao, Wuli Xuebao 19 (1963) 466–471. [12]S.V. Krivovichev, S.K. Filatov, Can. Mineral. 36 (1998) 809–815. [13]R. Miyawaki, I. Nakai, Kidorui 23 (1993) 1–21.
[14]R. Miyawaki, I. Nakai, Kidorui 25 (1994) 1–18.
[15]D. Meng, X. Wu, T. Mou, D. Li, Can. Mineral. 39 (2001) 1713–1724. [16]D. Meng, X. Wu, M. Tao, D. Li, Mineral. Mag. 65 (2001) 797–806. [17]Y. Ni, J.E. Post, J.M. Hughes, Am. Mineral. 85 (2000) 251–258. [18]D. Meng, X. Wu, G. Yang, Z. Pan, Kuangwu Xuebao 15 (1995) 378–382. [19]X. Wu, G. Yang, Z. Pan, TEM study of the syntaxies formed from the polytypes
of parisite (BS) and regular mixed-layer mineral B2S, Kuangwu Xuebao 13 (1993) 214–219. 212 plates.
[20] H.H. Adler, P.F. Kerr, Am. Mineral. 48 (1963) 839–853. [21]M.V. Akhmanova, L.P. Orlova, Geokhimiya (1966) 571–578. [22]R.L. Frost, S. Bahfenne, J. Raman Spectrosc. 42 (2011) 219–223.
[23]R.L. Frost, S. Bahfenne, J. Cejka, J. Sejkora, J. Plasil, S.J. Palmer, E.C. Keeffe, I. Nemec, J. Raman Spectrosc. 42 (2011) 56–61.
[24]S.J. Palmer, R.L. Frost, J. Raman Spectrosc. 42 (2011) 224–229.
[25]M.P. Smith, P. Henderson, L.S. Campbell, Geochim. Cosmochim. Acta 64 (2000) 3141–3160.
[26] K. Nakamoto, Infrared Spectra of Inorganic and Coordination Compounds, 1963.
[27]H. Fan, K. Tao, Y. Xie, K. Wang, Yanshi Xuebao 19 (2003) 169–172. [28]W. Hong, S. He, S. Huang, Y. Wang, H. Hou, X. Zhu, Guangpuxue Yu Guangpu
Fenxi 19 (1999) 546–549.
[29]I.V. Aleksandrov, V.I. Ivanov, L.A. Sin’kova, Zapiski Vserossiiskogo Mineralogicheskogo Obshchestva 94 (1965) 323–326.