Influence of Diffusion Parameters on Electrical Characteristics of mc-Si Solar Cells with
Aluminum and Phosphorus Diffusion Performed in the Same Thermal Step
Gabriela Wehra , Izete Zanescoa* , Adriano Moehleckea
Received: June 22, 2018; Revised: October 03, 2018; Accepted: November 02, 2018
The diffusion of phosphorus and aluminum in a single-step thermal process may reduce the production cost of multicrystalline silicon (mc-Si) solar cells. The goal of this paper is to analyze the influence of phosphorus diffusion parameters on the electrical characteristics of p-type mc-Si solar cells processed with a single-step diffusion of phosphorus and aluminum. To avoid the wafer bowing during aluminum paste firing, the aluminum was deposited by e-beam and co-diffused in the same thermal step that the phosphorus diffusion. First, the aluminum diffusion was performed and, then, the POCl3 was introduced into the quartz tube. The steps of the phosphorus diffusion were experimentally
optimized. The best result was found with the temperature of 875 ºC. The POCl3 concentration of 0.15%
and the optimized phosphorus diffusion parameters lead to the efficiency of 14.1%. The reduction of the oxygen flow during ramp temperature and aluminum diffusion improved the efficiency.
Keywords: mc-Si solar cells, phosphorus and aluminum co-diffusion, diffusion parameter optimization.
*e-mail: [email protected]
1. Introduction
The efficiency of the solar cells fabricated by the industry in p-type multicrystalline silicon (mc-Si) wafers is around 17.8%1. This efficiency is about 2 % lower than that of solar
cells manufactured in Czochralski silicon (Cz-Si) wafers2.
However, the improvement of the quality of the mc-Si wafers combined with the cost reduction and the optimization of the production process across the entire chain lead to the dominance in the solar cell market with a share of about 60%1.
In the last decade, different processes for texturing mc-Si wafer were developed and the reflectance was reduced down to 2 % 3,4,5,6. The surface passivation was also improved7.
The main disadvantage of multicrystalline material is the regions with low minority carrier lifetime in the wafer. Structural defects, such as grain boundaries and dislocations may be the causes of underperforming regions in mc-Si8,9.
The grain boundaries with metallic impurities agglomeration usually are centers of high recombination of the minority charge carriers10.
Phosphorus diffusion gettering may remove impurities from the bulk to diffused region and it may reduce the effect of metallic impurities at the grain boundaries, resulting in an increase in the minority carrier lifetime11,12. In addition,
the phosphorus gettering does not add an extra step to the solar cell production process10,13 and is a well-known
method to relocate iron from the bulk to the emitter, where it is less harmful14.
The phosphorus diffusion is the classic dopant-process to produce the junction in solar cells manufactured in
p-type crystalline silicon wafers since the 1970s15. The
diffusion is performed in a high temperature quartz furnace with a gaseous environment containing the phosphorus atoms (POCl3), nitrogen and small amount of oxygen. A
phosphorus silicate glass grows on the surface of the wafer and phosphorus diffusion occurs from this glass. The largest use of the phosphorus diffusion is related to low costs, good stability, high throughput production and the gettering, mainly in mc-Si wafers.
Bentzen et al.16 reported that after phosphorus diffusion,
the regions which had already shown higher values of minority carrier lifetime present a growth of this parameter, and the regions with low lifetime present little increase or no answer to the phosphorus gettering. The non-homogeneous behavior of the gettering is related to the dislocation density in the different regions of the material. The improvement of the poor quality areas is very important to increase the minority carrier lifetime in mc-Si wafers. Nevertheless, the processing at high temperatures causes degradation in mc-Si wafers, due to dissolution of precipitated impurities or to the formation of crystallographic defects. The diffusion to perform the emitter at low temperatures (less than 875 ºC) and long duration may increase the lifetime and reduce the Fe concentration dissolved in the material16.
The co-diffusion of phosphorus and boron or phosphorus and aluminum has the advantage of simplifying the fabrication process, avoiding single thermal steps, and the
n+ and p+ regions can be performed in the same thermal
step. Different methods have been developed17 for the
co-diffusion of phosphorus and boron with different sources of dopants. For instance, a bifacial solar cell with passivated aEscola de Ciências, Pontifícia Universidade Catolica do Rio Grande do Sul - PUCRS, Av. Ipiranga,
emitter rear totally diffused (PERT) was produced with co-diffusion of boron and phosphorus18. The p+ and n+ layer
were performed by atmospheric pressure chemical vapour deposition (APCVD) of boron (BSG) and phosphorous (PSG) silicate glass and co-diffusion in a quartz furnace. A SiNx antireflective coating was deposited on both faces and the BSG/SiNx stack was locally opened by laser radiation. The metallization was carried out by the screen printing technique. Solar cells manufactured in p-type Cz-Si wafers achieved the efficiency of 20.5 %. Meier et al.19 reported
the same efficiency for PERT solar cells with phosphorus diffusion using POCl3 and boron glass silicate deposited by
APCVD. Similar efficiency was obtained with PERT cells manufactured in n-type silicon wafers. In these cells, the co-diffusion was carried out with boron paste and phosphorus. The boron paste was deposited in both faces of one slave wafer and two wafers were put face-to-face with the slave in order to diffuse boron in one face of these two wafers and phosphorus in the other face during the co-diffusion20.
However, few works were reported concerning the co-diffusion of phosphorus and aluminum. Moussaoui et al.21 develop a simple process to produce high efficiency
multicrystalline solar cells, based on phosphorus pre-gettering and simultaneous diffusion of phosphorus and aluminum. The pre-gettering step was carried out to increase the minority carrier lifetime in the bulk. The efficiency reached was 16.1 % with 4 cm2 solar cell and metal grid performed by
Ti/Pd/Ag evaporation. The co-diffusion of phosphorus and aluminum was also implemented to develop emitter wrap-through solar cells22. The interdigitated p+ and n+ layers
were formed by the evaporation of the aluminum finger grid followed by the co-diffusion of aluminum and phosphorus in a quartz tube. The contact grids were formed by Ti/Pd/Ag evaporation and shadowing masks. The efficiency achieved was 10.1 % and 9.6 % in solar cells processed in Cz-Si and mc-Si, respectively.
The phosphorus diffusion using POCl3 continues to
be optimized to improve the efficiency of solar cells. For instance, Li et al.15 reported the influence of phosphorus
diffusion on the emitter formation of industrial solar cells. These devices are produced with a phosphorus diffusion in a thermal step and the aluminum back surface field (BSF) is formed by screen printing technique. The Al paste is fired in a thermal process using a belt furnace.
As an alternative to the industrial standard process to produce silicon solar cells, in this paper, a method is presented to perform the aluminum diffusion in the same thermal step of phosphorus diffusion, with aluminum deposited by electron beam physical vapor technique to avoid the wafer bowing. The Al paste deposited by screen printing to produce the back surface field may cause wafer bowing during the firing of metallization pastes, leading to wafer breakage23. This way, to
develop solar cells in p-type mc-Si wafers with co-diffusion
of phosphorus and aluminum, steps of the process have to be experimentally optimized. For instance, POCl3 concentration,
diffusion temperature and time as well as gas flows affect the minority charge carrier lifetime and the sheet resistance of the emitter and, consequently, the performance of the mc-Si solar cells. In this scenario, the goal of this paper is to optimize the phosphorus diffusion parameters and analyze their influence on the electrical characteristics of mc-Si solar cells processed with a single-step diffusion of phosphorus and aluminum. Specifically, the POCl3 concentration in the
quartz tube furnace, the temperature and time of phosphorus diffusion and the oxygen and nitrogen flow rate were evaluated. Differently of the method reported by Moussaoui et al.21,
the solar cells were developed without pre-gettering step and with the industrial screen printing metallization in the front face and in the rear face. The Al paste deposited by screen printing technique to produce the back surface field (BSF) may cause bowing in the wafers during the firing of metallization pastes, leading to the breaking of the wafers23,
then the aluminum was deposited by electron beam physical vapor method to perform the BSF and, in the same thermal step, the phosphorus emitter was produced.
2. Solar Cell Process and Methodology
A complete solar cell manufacturing process for n+pp+
multicrystalline silicon solar cells was developed by using p-type wafers, with resistivity of 0.5 to 2 Ω.cm. The phosphorus and aluminum diffusion was performed in the same thermal step. The developed process presents advantages if compared to the industry standard and to the typical process based on aluminum evaporated by the e-beam method.
In the first case, the proposed alternative process avoids the solar cell bowing because the aluminum was evaporated by e-beam and a metal grid with aluminum/silver paste was performed by screen-printing. In the industry standard process the Al paste is screen printed on whole rear area and, in a second step, the Ag/Al busbars are also screen printed. Then, the number of steps to manufacture the solar cells with the proposed process is similar to the industry standard, but the solar cell bowing is avoided due to the formation of the Al/Ag paste screen-printed metal grid on the rear aluminum BSF. Consequently, the wafer breakage can be reduced during the soldering.
In the second case, the silicon oxide growth is required to form the BSF in the manufacture of solar cells by diffusion of Al deposited by evaporation. Photoresist is deposited on one surface and silicon oxide is etched on the other surface. Thus, phosphorus diffusion occurs only on the front face of the mc-Si wafer. After the oxide etching in chemical solution, the aluminum on the back surface is evaporated and diffused24,25. In the proposed process, the deposition
then, the processing cost may be reduced. At the same time, an oxidation process at high temperature, that may degrade the mc-Si wafer, was not performed.
The developed process incorporated the following steps, as Figure 1 shows: surface texturing with acidic solution, RCA cleaning, aluminum evaporation, single step phosphorus and aluminum diffusion in the quartz tube furnace, phosphorus silicate glass removal, RCA cleaning, TiO2 anti-reflective
coating (ARC) deposition, screen printing of the metal grid in both faces, firing of metal pastes and laser edge isolation.
After the texturing process and RCA cleaning, an aluminum layer of 2 µm thickness was evaporated by e-beam method. Then, the aluminum was firstly diffused and, in the same thermal step, the phosphorus diffusion was performed. In order to optimize experimentally the phosphorus diffusion in the quartz tube furnace, the influence of several parameters of the process was analyzed, such as: POCl3 concentration
(in volume) in the quartz tube, time and temperature of phosphorus diffusion and gas flow during the diffusions. After the diffusion of the dopants, the phosphorus silicate glass was etched and a RCA cleaning was performed to prepare the wafers to receive the TiO2 anti-reflective coating
of 70 nm. Then, the Ag/Al metal grid was screen printed on the rear face and the Ag grid was deposited on the front face. Both pastes were fired in the belt furnace set at 870 ºC.
The electrical characteristics of the developed solar cells were measured under standard conditions (100 mW/
cm2, AM1.5G and 25 ºC) in a solar simulator calibrated
with a solar cell previously measured at CalLab - FhG-ISE (Fraunhofer-Institut für Solare Energiesysteme), Germany. The two-dimensional minority carrier diffusion length was measured using the WT-2000PV device of Semilab, by LBIC (light beam induced current) technique.
3. Results and Analysis
3.1 POCl
3concentration
To start the process development, the temperature of aluminum diffusion was set equal to the phosphorus diffusion, of 875 ºC. The aluminum was diffused during 90 minutes, and phosphorus was diffused during 30 minutes, because simulation by one-dimensional program PC1D and an in house software to optimize the metal grid indicated that for solar cells with back surface field (BSF), the n+ emitter
sheet resistance can range from 53 to 107 Ω/□. The POCl3
concentration (CPOCl3) was ranged and batches of solar cells were manufactured. The results are shown in the Table 1.
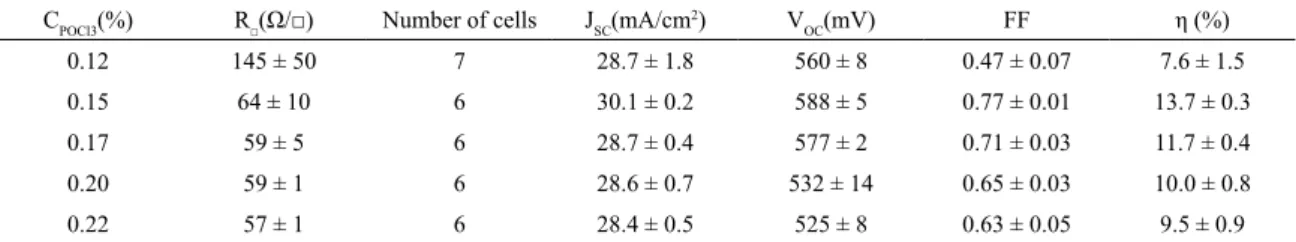
The higher average efficiency was found for CPOCl3 of 0.15%. The worst result was found for CPOCl3 of 0.12%, due to high sheet resistance that causes a high contact resistance and, consequently, a low fill factor. The standard deviation of sheet resistance decreases with the increase of POCl3
concentration, indicating that the uniformity of the emitter increases. For CPOCl3 ≥ 0.15 %, the JSC and VOC decrease
because the minority charge carrier recombination increases in the emitter.
The Fig. 2 compares the electric current density as a function of the applied voltage (J-V curve) for the solar cell with the highest efficiency processed with the CPOCl3 values presented in Table 1. The lower series resistance occurs in the solar cells processed with CPOCl3 = 0.15 %, resulting in the fill factor of 0.79, and in the efficiency of 14.1 %, as summarized in Table 2.
3.2 Phosphorus diffusion temperature
To evaluate the influence of the diffusion temperature in electrical characteristic of the solar cells, this parameter was
Figure 1. Sequence of the fabrication process of n+pp+ silicon solar cells in mc-Si wafers with phosphorus and aluminum diffusion in
the same thermal step.
Table 1. Average values of the sheet resistance (R□), short-circuit current density (JSC), open circuit voltage (VOC), fill factor (FF) and
efficiency (η) of the solar cells as a function of POCl3 concentration.
CPOCl3(%) R□(Ω/□) Number of cells JSC(mA/cm2) V
OC(mV) FF η (%)
0.12 145 ± 50 7 28.7 ± 1.8 560 ± 8 0.47 ± 0.07 7.6 ± 1.5
0.15 64 ± 10 6 30.1 ± 0.2 588 ± 5 0.77 ± 0.01 13.7 ± 0.3
0.17 59 ± 5 6 28.7 ± 0.4 577 ± 2 0.71 ± 0.03 11.7 ± 0.4
0.20 59 ± 1 6 28.6 ± 0.7 532 ± 14 0.65 ± 0.03 10.0 ± 0.8
Figure 2. Electric current density as a function of the applied voltage of the solar cells with the highest efficiency, processed with POCl3 concentration of 0.12%, 0.15%, 0.17%, 0.20% and
0.22% and aluminum and phosphorus diffusion performed in the same thermal step.
Table 2. Short-circuit current density, open circuit voltage, fill factor and efficiency of the solar cells with the highest efficiency as a function of POCl3 concentration.
CPOCl3(%) (mA/cmJSC 2)
VOC
(mV) FF η (%)
0.12 30.9 573 0.59 10.2
0.15 30.2 592 0.79 14.1
0.17 28.7 578 0.73 12.2
0.20 29.6 550 0.67 11.0
0.22 28.8 534 0.67 10.3
Figure 3. J-V curve of the solar cells with the highest efficiency, processed with the phosphorus temperature diffusion of 850 ºC and 875 ºC.
Table 3. Average values of the sheet resistance and electrical parameters of the solar cells as a function of phosphorus diffusion temperature.
TP(°C) R□(Ω/□) Number of cells JSC(mA/cm2) VOC(mV) FF η (%)
875 64 ± 10 6 30.1 ± 0.2 588 ± 5 0.77 ± 0.01 13.7 ± 0.3
850 168 ± 24 10 22.6 ± 4.9 465 ± 15 0.34 ± 0.07 3.7 ± 1.7
of (42 ± 3) Ω/□. Comparing the results presented in Table 4, we observed an improvement of open circuit voltage and fill factor when tp was increased from 30 minutes to 70 minutes.
Fill factor increased because the sheet resistance decreased. Figure 4 shows an enhancement of VOC with the increasing
of the diffusion time, that was related to the deeper BSF because the aluminum diffusion occurred also during the phosphorus diffusion. The current density decreased due to the deeper pn junction and the augment of the minority carrier recombination in the emitter.
3.4 Gas flow influence
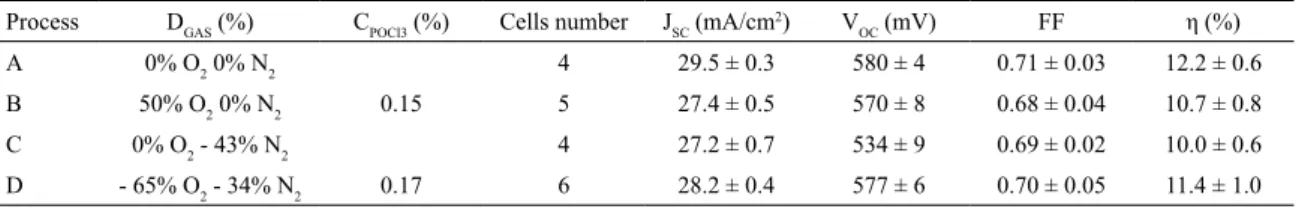
The oxygen flow during the entrance of the wafers in the quartz tube and the nitrogen flow during the Al diffusion may affect the solar cell efficiency. Table 5 presents the average electrical characteristics of the solar cells processed with different oxygen and nitrogen flows. The time of phosphorus diffusion was 70 minutes. The oxygen and nitrogen flow in the process A was 0.29 l/min and 4.68 l/min, respectively, and this process was considered as a reference. The oxygen flow was increased 50% in process B during the entrance of the wafers in the quartz tube. In the process C, nitrogen flow was decreased by 43% during the temperature ramp and Al diffusion. In the processes A, B and C the CPOCl3 was 0.15 % and in process D the CPOCl3 was 0.17 %. The oxygen flow was decreased by 65% during the entrance of the wafers and the nitrogen flow was reduced in 34% during the aluminum diffusion in process D. Table 5 shows that the electrical characteristics of solar cells of the process B and C were modified for POCl3 concentration of 0.15%. The average
electrical parameters are presented in the Table 3. When the temperature was decreased from 875 ºC to 850 ºC, the average sheet resistance of (64 ± 10) Ω/□ increased to (168 ± 24) Ω/□ and all the electrical characteristics decreased. The series resistance increased with the reduction of the diffusion temperature (Tp), as Figure 3 shows, due to the
increasing of the contact resistance. Therefore, in the next
processes Tp was set of 875 ºC.
3.3 Phosphorus diffusion time
Another parameter that affects the performance of solar cells is the phosphorus diffusion time (tP), because during
phosphorus diffusion, the aluminum diffusion also occurs. This parameter was ranged for the POCl3 concentration of
Figure 4. Electrical characteristics at standard conditions of solar cells with the highest efficiency, processed with POCl3 in the quartz
tube during 30 and 70 minutes at the temperature of 875 ºC.
Table 4. Average electrical parameters of the solar cells as a function of the phosphorus diffusion time (tP) with POCl3 concentration of
0.15 %.
tP(min) R□(Ω/□) Cells number JSC(mA/cm2) VOC(mV) FF η (%)
30 81 ± 15 7 30.5 ± 0.4 573 ± 3 0.65 ± 0.02 11.4 ± 0.4
70 42 ± 3 4 29.5 ± 0.3 580 ± 4 0.71 ± 0.03 12.2 ± 0.6
Table 5. Electrical characteristics of solar cells as function of oxygen and nitrogen flow variation (DGAS) during the entrance of the wafers in the quartz tube and Al diffusion, respectively, for aluminum and phosphorus diffusion temperature of 875 °C. The aluminum and phosphorus diffusion time was 90 and 70 minutes, respectively.
Process DGAS (%) CPOCl3 (%) Cells number JSC (mA/cm2) V
OC (mV) FF η (%)
A 0% O2 0% N2
0.15
4 29.5 ± 0.3 580 ± 4 0.71 ± 0.03 12.2 ± 0.6
B 50% O2 0% N2 5 27.4 ± 0.5 570 ± 8 0.68 ± 0.04 10.7 ± 0.8
C 0% O2 - 43% N2 4 27.2 ± 0.7 534 ± 9 0.69 ± 0.02 10.0 ± 0.6
D - 65% O2 - 34% N2 0.17 6 28.2 ± 0.4 577 ± 6 0.70 ± 0.05 11.4 ± 1.0
lower than the results obtained with process A. The increase of oxygen during the entrance of the wafers or the nitrogen flow reduction during aluminum diffusion decreased the efficiency of solar cells for CPOCl3 of 0.15%. In the process B and C, probably a thicker aluminum oxide was formed due to the high oxygen concentration in the quartz tube. In the both processes, the ratio of oxygen and nitrogen flow was 9.3x10⁻² and 10.9x10⁻², respectively, and these values
were higher than that used in the process A of 6.2x10⁻².
The reduction only in nitrogen flow (process C) caused the highest decreasing in the open circuit voltage, probably due to the lack of uniformity in the aluminum diffusion. In the process D, with CPOCl3 of 0.17 %, the reduction of both gas flows decreased mainly the short-circuit current density and the efficiency was reduced 0.8 % (absolute), when these parameters were compared to those obtained by the process A. In this case, the ratio of oxygen and nitrogen flow was 3.2x10⁻², lower than the ratio used in the process A (6.2x10⁻²),
resulting in lesser aluminum oxide thickness in the rear face of solar cells. The lower JSC obtained in process D than that
of process A, is related to the decreasing of sheet resistance
due to CPOCl3 of 0.17 % and, consequently increasing of
the minority charge carrier recombination in the emitter. The solar cells with the highest efficiency are compared in Fig. 5 and the above conclusions are confirmed.
In order to evaluate the gas flow influence during the diffusions, solar cells were also manufactured with phosphorus diffusion during 30 minutes. The electrical parameters for
CPOCl3 of 0.15% and 0.17% are summarized in Table 6. In the
process E, the gas flows and other parameters were the same of process A. For comparison, in process F and G, oxygen flow was increased to 25% during the entrance of the wafers and the temperature ramp was implemented with this oxygen flow, instead of nitrogen flow. In these processes, nitrogen flow was decreased by 15% during aluminum diffusion, then the ratio of oxygen to nitrogen flow was of 9.1x10⁻². The
results presented in Table 5 are confirmed: the increasing of the oxygen concentration reduces the fill factor and the open circuit voltage. The higher oxygen concentration increased the series resistance due to the thicker aluminum oxide formed on the rear face, as Fig. 6 shows.
Comparing the electrical parameters of solar cells fabricated with process F and G in Figure 6, we observe a little increase of VOC and FF with the increasing of CPOCl3 from
0.15 % to 0.17 %, due to the reduction of series resistance, as a result of the decreasing of the sheet resistance of the phosphorus emitter from 64 Ω/□ to 57 Ω/□.
3.5 Minority charge carrier diffusion length
The two-dimensional distribution of the minority carrier diffusion length (LD) measured in the solar cell with higher efficiency is shown in Fig. 7.
approximately 160 µm and it does not reach the thickness of the cell, which is around 240 µm.
4. Conclusions
After the experimental optimization of the process to manufacture solar cells with phosphorus and aluminum diffusion performed in the same thermal step, we concluded that the diffusion temperature of 875 ºC during 90 minutes and 30 minutes for aluminum and phosphorus, respectively, and the CPOCl3 of 0.15 % resulted in the highest efficiency. The phosphorus and aluminum diffusion performed in the same thermal step produced the sheet resistance in the phosphorus emitter of (64 ± 10) Ω/□. The efficiency achieved was of 14.1 %.
The analysis of the oxygen and nitrogen flow, during the steps of the entrance of the wafers in the quartz tube and aluminum diffusion, indicated that the reduction of the ratio of oxygen and nitrogen flow decreased the thickness of the aluminum oxide formed on the rear face, which increased the contact resistance between aluminum BSF and Al/Ag metal grid.
Figure 6. Electrical characteristics at standard conditions of solar cells with the highest efficiency, manufactured with process E, F and G.
Table 6. Electrical parameters of solar cells as function of oxygen and nitrogen flow variation (DGAS) during the entrance of the wafers in the quartz tube and Al diffusion, respectively, for aluminum and phosphorus diffusion temperature of 875 °C. The aluminum and phosphorus diffusion time was 90 and 30 minutes, respectively.
Proc. DGAS (%) CPOCl3(%) Cells JSC(mA/cm2) VOC(mV) FF (%) η (%)
E 0% O2
0 % N2
0.15
6 30.1 ± 0.2 588 ± 5 0.78 ± 0.01 13.7 ± 0.3
F 25% O2
-15% N2(Al)
6 30.8 ± 0.4 576 ± 4 0.60 ± 0.05 10.7 ± 0.8
G 25% O2
-15% N2(Al)
0.17 4 30.2 ± 0.6 580 ± 3 0.68 ± 0.02 11.9 ± 0.5
Figure 7. (a) Two-dimensional distribution of the minority carrier diffusion length measured in the best solar cell processed with simultaneous diffusion of aluminum and phosphorus.
5. Acknowledgements
The authors gratefully acknowledge the financial support of the State Electric Energy Distribution Company (CEEE-D), contract CEEE/D2009-9928171 and of the National Council for Scientific and Technological Development (CNPq).
6. References
1. Battaglia C, Cuevas A, De Wolf S. High-efficiency crystalline silicon solar cells: status and perspectives. Energy & Environmental Science. 2016;9:1552-1576.
2. Srivastava SK, Singh P, Yameen M, Prathap P, Rauthan CMS, Vandana, et al. Antireflective ultra-fast nanoscale texturing for efficient multi-crystalline silicon solar cells. Solar Energy. 2015;115:656-666. 3. Benick J, Müller R, Schindler F, Richter A, Hauser H, Feldmann F,
et al. Approaching 22% efficiency with multicrystalline n-type silicon solar cells. In: Proceedings of the 33rd European Conference and
Exhibition; 2017 Sep 25-29; Amsterdam, The Netherlands. 5 p.
4. Hu F, Sun Y, Zha J, Chen K, Zou S, Fang L. Pre-texturing multi-crystalline silicon wafer via a two-step alkali etching method to achieve efficient nanostructured solar cells. Solar Energy Materials and Solar Cells. 2017;159:121-127.
5. Chen WH, Hong FCN. 0.76% absolute efficiency increase for screen-printed multicrystalline silicon solar cells with nanostructures by reactive ion etching. Solar Energy Materials and Solar Cells. 2016;157:48-54.
6. Jiang Y, Shen H, Pu T, Zheng C, Tang Q, Gao K, et al. High efficiency multi-crystalline silicon solar cell with inverted pyramid nanostructure. Solar Energy. 2017;142:91-96.
7. Qiao Q, Lu H, Ge J, Xi X, Chen R, Yang J, et al. 18.5% efficient AlOX/SiNY rear passivated industrial multicrystalline silicon solar cells. Applied Surface Science. 2014;305:439-444.
8. Hartman K, Bertoni M, Serdy J, Buonassisi T. Dislocation density reduction in multicrystalline silicon solar cell material by high temperature annealing. Applied Physics Letters. 2008;93(12):122108. 9. Zheng P, Xu J, Sun H, Zhang F, Guo Y, Pan H, et al. 21.63% industrial
screen-printed multicrystalline Si solar cell. Physica Status Solidi Rapid Research Lettersr. 2017;11(3):1600453.
10. Díaz MB, Koch W, Hässler C, Bräutigam HG. Resistivity topography: a grain boundary characterisation method. Solar Energy Materials and Solar Cells. 2002;72(1-4):473-486.
11. Myers SM, Seibt M, Schröter W. Mechanisms of transition-metal gettering in silicon. Journal of Applied Physics. 2000;88(7):3795-3819.
12. Fenning DP, Zuschlag AS, Bertoni MI, Lai B, Hahn G, Buonassisi T. Improved iron gettering of contaminated multicrystalline silicon by high-temperature phosphorus diffusion. Journal of Applied Physics. 2013;113:214504.
13. Manshanden P, Geerligs LJ. Improved phosphorous gettering of multicrystalline silicon. Solar Energy Materials and Solar Cells. 2006;90(7):998-1012.
14. Vähänissi V, Haarahiltunen A, Talvitie H, Yli-Koski M, Savin H. Impact of phosphorus gettering parameters and initial iron level on silicon solar cell properties. Progress in Photovoltaics. 2013;21(5):1-29.
15. Li H, Kim K, Hallam B, Hoex B, Wenham S, Abbott M. POCl3 diffusion for industrial Si solar cell emitter formation. Frontiers in Energy. 2017;11(1):42-51.
16. Bentzen A, Holt A. Overview of phosphorus diffusion and gettering in multicrystalline silicon. Materials Science and Engineering: B. 2009;159-160:228-234.
17. Tanvir NB, Keding R, Rothhardt P, Meier S, Wolf A, Reinecke H, et al. Codiffusion sources and barriers for the assembly of back-contact back-junction solar cells. IEEE Journal of Photovoltaics. 2015;5(6):1813-1820.
18. Fellmeth T, Meier S, Clement F, Wolf A, Knauss H, Havercamp H. Co-diffused bi-facial PERT solar cells. Energy Procedia. 2017;124:875-880.
19. Meier S, Wiesnet S, Mack S, Werner S, Maier S, Unmüßig S, et al. Co-diffusion for p-type PERT solar cells using APCVD BSG layer as boron doping source. In: Proceedings of the 32nd European Photovoltaic Solar Energy Conference and Exhibition; 2016 Jun 20-24; Munich, Germany. 6 p.
20. Wei Q, Zhang S, Yu S, Lu J, Lian W, Ni Z. High efficiency n-PERT solar cells by B/P co-diffusion method. Energy Procedia. 2017;124:700-705.
21. El Moussaoui A, Moehlecke A, Cañizo A, Luque A. High efficiency in mc-Si by using a simple process. In: Proceedings of the 14th European Photovoltaic Solar Energy Conference and Exhibition; 1997 Jun 30 Jul -4; Barcelona, Spain. p. 747-749.
22. Faika K, Wagner M, Fath P, Bucher E. Simplification of EWT (emitter wrap-through) solar cell fabrication using Al-P-codiffusion. IEEE Journal of Photovoltaics. 2000;260-263. 23. Hilali MM, Gee JM, Hacke P. Bow in screen-printed
back-contact industrial silicon solar cells. Solar Energy Materials and Solar Cells. 2007;91:1228-1233.
24. Moehlecke A, Zanesco I. Pilot Production of n+pn+ and n+pp+ silicon solar cells: efficiency x yield. In: Proceedings of the 25th European Photovoltaic Solar Energy Conference and Exhibition and 5th World Conference on Photovoltaic Energy Conversion; 2010 Sep 6-10; Valencia, Spain. p. 2497-2500.