Pedro Jorge Gomes Mota
Licenciatura em Ciências de
Engenharia Electrotécnica e de Computadores
Comparative Analysis of Multicriteria Decision
Making Methods
Dissertação para obtenção do Grau de Mestre em Engenharia Electrotécnica e
de Computadores
Orientador: Rui Neves-Silva, Prof. Auxiliar da FCT-UNL
Coorientador: Ana Rita Campos, Investigadora da CTS/UNINOVA
ii
Comparative Analysis of Multicriteria Decision Making Methods for Project Selection
Copyright © Pedro Jorge Gomes Mota, Faculdade de Ciências e Tecnologia, Universidade Nova de Lisboa.
iii
Acknowledgments
I would like to acknowledge Dr. Rui Neves-Silva and Dra. Ana Rita Campos for their assistance during the development process of this dissertation. They were tireless to ensure, that even with full schedules and all the projects in hands, all the help needed was provided. I also have to express my gratitude for the opportunities they gave me, specially the possibility to contact with the project EnPROVE and to participate in the IDT / IIMSS Conference 2013.
I would like to thank all the people that since my first day of kindergarten until my last class in the university, had the difficult but rewarding job of teaching. Special thanks to São, Isabel Fiusa, Isabel, José Teixeira, Manuel Rêgo, Jorge Miranda and Ruy Costa.
Thanks to my friends, colleagues and partners of adventure João Puga Leal, Francisco Parreira do Amaral, Fábio Moreira de Passos and Filipe Martins, that closely shared these six amazing years of my academic and personal life.
I would like to express my deep gratitude to my aunt Nazaré and my cousin Joana that gave me all their support and welcomed me at their house when I moved to college.
I would like to thank my closest family, my father, my mother and my brother João, for all their care, love and dedication. My parents’ wise advices guided me through all my academic life, bringing me here confident in my future and grateful for my success. My brother’s energy and affection kept me alive and fighting to grant him a better tomorrow.
I have to thank my girlfriend Carolina for all her love, loyalty and tenderness, “What a wonderful
life for as long as you've been at my side”.Hope one day she will say “Yes!”.
v
Abstract
The main objective of this dissertation is to perform a Comparative Analysis of different Multicriteria Decision Making Methods applied to real-world problems, in order to produce relevant information to enable the incorporation of those methods on computational platforms. The current document presents a simple case study concerning a decision support application targeted for a real problem regarding retrofitting alternatives of a building with energy efficiency impact. The application process was started with the selection of two Multicriteria Decision Making Methods guided by a preexisting framework, and resulted in the choice of AHP and PROMETHEE II methodologies. These two methods were then combined with three different decision maker profiles (Conservative, Moderate and Aggressive) created by means of risk assessment profiling techniques for portfolio allocation. Afterwards, the chosen decision criteria were disposed in a Risk Pyramid according to their inherent level of risk regarding project evaluation. A match was then performed between the decision maker profiles and each criterion, so as to define a proper set of weights for the decision criteria and preference functions, with corresponding preference and indifference thresholds. Finally, three different sets of results (one for each decision maker profile) were produced using appropriate software, and a Sensitivity Analysis was performed over the criteria to understand their influence on the solution. The general conclusion of this Comparative Analysis is that the increase in the preference modelling ability of the methods brings up the least expected alternatives as recommendations for the decision maker. Besides, we have concluded that the decision profiles that allocate bigger weights to the riskiest criteria are the ones that produce the more dispersed set of results within each method application and within each decision maker profile.
vii
Resumo
O principal objetivo desta dissertação é realizar uma Análise Comparativa de diferentes métodos de suporte à decisão multicritério aplicados a problemas reais, para produzir informações que permitam a incorporação desses métodos em plataformas computacionais. O presente documento exibe um caso de estudo simples de uma aplicação de apoio à decisão direcionada para um problema real, que considera alternativas de renovação de um edifício com impacto na sua eficiência energética. O processo de aplicação teve início com a seleção de dois métodos de decisão multicritério, guiada por uma framework pré-existente, e resultou na escolha das metodologias AHP e PROMETHEE II. Estes dois métodos foram então combinados com três perfis diferentes de decisor (Conservador, Moderado e Agressivo) criados por meio de técnicas de análise de avaliação de risco para a alocação de portefólios. Seguidamente, os critérios de decisão escolhidos foram dispostos numa Pirâmide de Risco segundo o seu nível de risco relativamente à avaliação de projeto. Foi então realizada uma correspondência entre os perfis do decisor e cada critério, de modo a definir um conjunto adequado de pesos para os critérios de decisão e funções de preferência, com os respetivos limiares de preferência e indiferença. Finalmente, três conjuntos de resultados (um para cada perfil de tomador de decisão) foram produzidos utilizando software adequado, e uma Análise de Sensibilidade foi realizada sobre os critérios, para compreender a sua influência sobre a solução. A conclusão geral da Análise Comparativa é a de que o aumento na capacidade de modelação de preferência nos métodos revela as alternativas menos esperadas como recomendações para o decisor. Além disso, concluímos que os perfis de decisão que alocam maiores pesos para os critérios de maior risco são os que produzem os conjuntos de resultados mais dispersos dentro de cada aplicação do método e dentro de cada perfil de decisor.
ix
Symbols and Notation
Symbol Description
𝒂𝒊 Alternative 𝑖
𝔸 Set of possible actions 𝑨 Set of attributes
𝔸 − 𝑭/𝑨 − 𝔼 Classical model to describe a decision making situation 𝐁 Comparison matrix of criteria
𝒃𝒊𝒋 Entries of the matrix 𝐁
𝐃 Comparison matrix of alternatives
𝒅𝒋(𝒂, 𝒃) Deviation between alternatives 𝑎 and 𝑏 for a criterion 𝑗 𝒆𝒊𝒋 Performance indicator in the performance table
𝔼 Performance Table
𝑭 A family of criteria
𝝓−(𝒂) Incoming Flow of alternative 𝒂 𝝓+(𝒂) Outgoing Flow of alternative 𝒂
𝝓(𝒂) Net Flow of alternative 𝒂 𝒈𝒋 Criterion 𝑗
𝒈𝒋(𝒂𝒊) The performance of an alternative 𝑎𝑖 under a criterion 𝑗 {𝒈𝒋(∙), 𝑷𝒋(𝒂, 𝒃)} A generalized criterion
𝑰 Indifference
𝒍𝒊𝒋 Local priority of an alternative 𝑎𝑖 under a criterion 𝑔𝑗
𝑰𝒅𝒆𝒂𝒍(𝒍𝒊𝒋) Local Ideal Mode priority of an alternative 𝑎𝑖 under a criterion 𝑔𝑗 𝝅(𝒂, 𝒃) The preference index
𝑷. 𝜶 The Choice Problematic 𝑷. 𝜷 The Sorting Problematic 𝑷. 𝜸 The Ranking Problematic 𝑷. 𝜹 The Description Problematic
𝒑𝒊 Global priority of an alternative 𝑎𝑖 𝑷𝒋(𝒂, 𝒃) A preference function
𝑷 Preference
xi
Acronyms and abbreviations
Acronym Description
AHP Analytic Hierarchy Process ANP Analytic Network Process
BOCR Benefits, Opportunities, Costs and Risks
CAD Computer Aided Design
CCF Cumulative Cash Flow
CF Cash Flows
CI Consistency Index
CR Consistency Ratio
CRM Customer Relationship Management
DCF Discounted Cash Flow
DM Decision Maker
DMP Decision Maker Profiles DMS Decision Making Situation DSS Decision Support Systems
ELECTRE Elimination Et Choix Traduisant la Realité EPDSS Energy Prediction and Decision Support System FMADM Fuzzy Multiple Attribute Decision Making FMODM Fuzzy Multiple Objective Decision Making GAIA Geometrical Analysis for Interactive Aid
GP Goal Programming
GUI Graphical User Interface
HVAC Heating, Ventilation And Air Conditioning IRR Internal Rate of Return
IT Information Technology
KPI Key Performance Indicators LENI Lighting Energy Numeric Indicator LIMI Lighting Maintenance Indicator LINI Lighting Initial Investment Indicator
MACBETH Measuring Attractiveness by a Categorical Based Evaluation Technique MADM Multiple Attribute Decision Making
MAUT Multi-attribute Utility Theory MAVT/ Multi-attribute Value Theory
MCAP Multiple Criteria Aggregation Procedure MCDA Multicriteria Decision Aid
MCDM Multicriteria Decision Making MODM Multiple Objective Decision Making MOP Multi-Objective Programming
MS Management Science
NAIADE Novel Approach to Imprecise Assessment and Decision Environments
NPV Net Present Value
OR Operations Research
PBP Discounted Payback Period
PROMETHEE Preference Ranking Organization Method for Enrichment Evaluations R&D Research and Development
SPB Simple Payback Period
xiii
Table of Contents
1. Introduction ______________________________________________________________ 1 1.1. Motivation _____________________________________________________________ 1 1.2. Original Contributions ____________________________________________________ 2 1.3. Organization of the Dissertation ____________________________________________ 2
2. State of the Art ___________________________________________________________ 5 2.1. Origins of MCDM _______________________________________________________ 5 2.2. Classifications and Definitions _____________________________________________ 6 2.3. Bibliometrics of MCDM ___________________________________________________ 7 2.4. The Decision Process Model ______________________________________________ 8 2.4.1. Alternatives or Potential actions ______________________________________ 9 2.4.2. Family of Criteria and Performance Table ______________________________ 9 2.4.3. Problematic _____________________________________________________ 10 2.4.4. Structure of a Decision Process _____________________________________ 10 2.5. How to choose a Decision Method _________________________________________ 12 2.5.1. Designated methodology for method selection _________________________ 13 2.5.1.1. The Seven Guidelines __________________________________________ 14 2.5.1.2. The Typological tree ____________________________________________ 15
3. Case Study _____________________________________________________________ 19 3.1. EnPROVE project description ____________________________________________ 19 3.2. Technical and Financial Analysis __________________________________________ 20 3.2.1. Cash Flow ______________________________________________________ 21 3.2.2. Payback Period _________________________________________________ 22 3.2.3. Net Present Value _______________________________________________ 22 3.2.4. Internal Rate of Return ____________________________________________ 23 3.2.5. Decision Rules __________________________________________________ 23 3.3. Test Case: Building in Dublin, Ireland ______________________________________ 24
xiv
4.1.2.4. Exploitation of Outranking Relation ________________________________ 44 4.1.2.5. PROMETHEE I ________________________________________________ 45 4.1.2.6. PROMETHEE II _______________________________________________ 45 4.1.2.7. Rank Reversal ________________________________________________ 46 4.1.2.8. Visual PROMETHEE ___________________________________________ 46
5. Decision Maker Profiles ___________________________________________________ 49 5.1. Defining the profiles ____________________________________________________ 49 5.1.1. Conservative Decision Maker _______________________________________ 51 5.1.2. Moderate Decision Maker _________________________________________ 51 5.1.3. Aggressive Decision Maker ________________________________________ 51 5.2. Weighting the decision criteria ____________________________________________ 51 5.2.1. Discounted Payback Period ________________________________________ 52 5.2.2. Net Present Value _______________________________________________ 52 5.2.3. Internal Rate of Return ____________________________________________ 53 5.3. Criteria Pyramid _______________________________________________________ 53 5.4. Decision Groups _______________________________________________________ 54 5.4.1. Conservative Decision Group _______________________________________ 54 5.4.2. Moderate Decision Group _________________________________________ 55 5.4.3. Aggressive Decision Group ________________________________________ 56
6. Method application results and Sensitivity Analysis ______________________________ 59 6.1. Method application results _______________________________________________ 59 6.1.1. AHP application results ___________________________________________ 59 6.1.2. PROMETHEE II application results __________________________________ 62 6.1.2.1. PROMETHEE II – Without DM preference functions ___________________ 62 6.1.2.2. PROMETHEE II – With DM preference functions _____________________ 64 6.2. Sensitivity Analysis _____________________________________________________ 65 6.2.1. AHP Sensitivity Analysis___________________________________________ 65 6.2.2. PROMETHEE II Sensitivity Analysis _________________________________ 66
7. Comparative Analysis of results _____________________________________________ 67
8. Conclusion and Future Work________________________________________________ 73
References _________________________________________________________________ 77
Annex A. Catalogue of methods – Guitouni and Martel _____________________________ 81
Annex B. PROMETHEE I – Flow charts ________________________________________ 85
xv
List of Figures
xvii
List of Tables
1
1. Introduction
The main objective of this dissertation is to perform a comparative analysis of different Multicriteria Decision Making Methods, applied to real-world problems, in order to produce relevant information to enable the incorporation of those methods on computational platforms.
On the present chapter we describe the motivation that guided all our work and the original contributions produced during this process. Also, we present a short summary of each chapter and the organization of the dissertation.
1.1. Motivation
Through the last four decades the concept of decision support has been evolving to keep up with the growing complexity of the decisions taken in the modern world dominated by technology. Nowadays, the application of Decision Support Systems (DSS) starts to be a wider reality due to the advent of technology specially catalyzed by the internet. Even non-traditional areas of the decision support application, such as agriculture and the food sector start to apply DSS to help manage and optimize their outcomes (e.g. pest and diseases control) [1].
Thomas Saaty, a well-known author in the area of decision, draw the attention, in one of his papers to an interesting point about decision, stating that “We are all fundamentally decision makers” and that “Everything we do consciously or unconsciously is the result of some decision” [2]. This statement makes sense not only at a personal level but also when addressing different segments of the industry and other business areas. Companies make decisions constantly and due to the demands of the markets the decisions have increased their complexity, scope and number of actors involved [3]. Bearing in mind the importance of decisions both at a personal and at a business level, we considered the subject of decision support interesting and with a lot of potential to explore. As a consequence of the main objective of our dissertation we intended to produce relevant information for future applications by selecting and comparatively analyzing different applications of decision support methods. The results produced are expected to serve as documentation for future applications and to allow the understanding of the behavior of different decision methods when applied to specific decision making situations.
2
The combination of these two situations, represent the motivation that drove the production of this dissertation. The opportunity to apply the concept of decision support to a thematic with such importance as energy management represented a stimulus to the conception of our work.
1.2. Original Contributions
The following points describe the original contributions that resulted from the work performed under the main objective of this dissertation.
1. An Application of a decision framework to select a decision method in order to define the
appropriate methodologies to solve a real problem, according to the problem characteristics and the preferences of the decision makers involved in the process. This application produced results and information for future work in the area and verified the framework itself.
2. The Definition of Decision Maker Profiles using risk analysis to allow the evaluation of
different decision methods under the same circumstances. The profiles built upon investment and risk assessment theories guaranteed a stronger and tangible simulation environment to support the criteria weighting and the definition of preference functions.
3. The Classification of decision criteria according to a Risk Pyramid guided the weighting
process of the decision criteria giving the fundamental guidelines to correlate the decision maker profiles and their behavior towards each criterion.
4. A Comparative analysis of two widely applied decision methods resulted in a series of
information for future applications. The results obtained in this comparative analysis evidence differences in the methods performances and corresponding outcomes.
1.3. Organization of the Dissertation
Chapter 1, Introduction, gives an overview of the motivation that led to the production of this
dissertation and its background. It also describes the original contributions achieved and the organization of the document.
Chapter 2, State of the Art, introduces fundamental concepts about decision support, describing
3
Chapter 3, Case study, presents a real problem based on the selection of retrofitting alternatives
of a building with energy efficiency impact, using decision support methods. This chapter contains all the information about the different alternatives and the criteria to use in the decision process.
Chapter 4, Choosing the appropriate method for the Case Study, describes the process of
method selection based on one of the methodologies found in chapter 2. In addition an explanation of the selected methods, and their associated software tools, is given with simple illustrative examples.
Chapter 5, Decision Maker Profiles, comprises the creation of decision maker profiles, based
on investment profiles and risk assessment, to test the selected methods from chapter 4. Theses profiles contain information about criteria weights and preference functions defined by the decision makers.
Chapter 6, Method application results and Sensitivity Analysis, displays all the results from
the methods application regarding the Case Study. Besides, a Sensitivity Analysis is performed to evaluate the influence of each criterion in the final ranking of the alternatives.
Chapter 7, Comparative Analysis of results, exploits the results presented in the previous chapter in order to understand the relation between the methods tested. Furthermore, some remarks are drawn around special situations.
Chapter 8, Conclusions and future work, summarizes the main aspects of this work, pointing
5
2. State of the Art
This chapter provides an analysis of the Multicriteria Decision Making (MCDM) scenario through time. In the next sections we examine the origins of the discipline, its history and the latest developments. In another section, the most relevant MCDM methods and the different streams of thought related to them are presented. Besides, the structure of the decision process and its elements are described and a general model is displayed. Finally, an overview of different method selection techniques and approaches is performed with special attention to the framework selected for the purpose of this dissertation.
2.1. Origins of MCDM
Multiple Criteria Decision Making is a branch of Operations Research (OR), also called Management Science (MS) or Decision Science, and mentioned sometimes as a sub-field of mathematics. According to Hanne [7], MCDM “deals with (mathematical) theory, methods and methodological issues and case studies (applications) for decision processes where multiple criteria (objectives, goals, attributes) have to be (or should be) considered”.
The International Society of MCDM refers in its website that the earliest reference of MCDM is due to the American scientist and politician Benjamin Franklin (1706 – 1790). Franklin had a simple decision method, based on writing in one side of a sheet of paper the arguments in favor and on the other side the ones against the decision. To find how to manage the decision one has to eliminate the pros and cons of equal importance. In the end, the side of the paper with more arguments left is the solution of the problem. Although this is an interesting reference, the MCDM discipline, as we know it nowadays, is an indirect result of a war state and post war situation.
During the Second World War, in order to gain an advantage against the enemies, the nations started to develop and combine different fields of knowledge. These areas suffered a massive expansion and as a consequence new disciplines emerged, e.g. Operations Research. After the World War II, with a prosperous economic and political scenario, OR evolved promptly and extended its applications to other areas than the military, such as industry and logistics. The main objective of OR is to improve the decision making process by providing mathematical tools of analysis, modelling and optimization that aid making better decisions in empirical contexts. As a part of OR, MCDM also results from an interdisciplinary background, combining different areas like engineering, economics, psychology, computer science and of course, mathematics.
6
paradigm to give voice to the decision maker (DM), we are no longer finding the optimal solution but a solution that satisfies more the DM [9].
2.2. Classifications and Definitions
In the MCDM literature, one can find two main streams of thought sometimes called schools. The first to arise was the French School or also mentioned as the European School, and it is famous for its connection to the outranking methods created and developed by Bernard Roy [10].
In opposition, the American school is associated with Multi-Attribute Value/Utility Theories (MAVT/MAUT) motivated by the work of Keeney and Raiffa and made famous by one of the most studied and used methods worldwide, the Analytic Hierarchy Process (AHP) by T.L. Saaty [11].
Along with these two different approaches also two distinct denominations emerged to define the discipline. The French practitioners dislike the acronym MCDM, as they think that the MCDM “approach is based on a misconception of the decision process and the way a decision analyst
or a multicriteria decision method is involved into it” [7]. The word “making” is then replaced by
“aid” – Multicriteria Decision Aid (MCDA) – on the tentative to step aside the role of the decision
analyst from the one played by the DM.
In some cases this field of studies is also mentioned as Multi-criteria Decision Analysis, a definition which tries to bring both MCDA and MCDM supporters to a consensus or is sometimes adopted by international teams gathering researchers from both schools. Besides these two approaches there are still some major definitions which could be assigned to both MCDM and MCDA and were established to assist a methodical and structured research in the field.
Hwang and Yoon have proposed two main categories for grouping different MCDM problems according to their purposes and available information. The classes defined are Multiple Attribute Decision Making (MADM) and Multiple Objective Decision Making (MODM). The later handles decision problems that consider a continuous decision space, and are usually related to design and planning. On the other hand, MADM problems are assigned to an evaluation component with a discrete decision space and a predetermined set of alternatives/potential actions normally considering information from the DM [11] [12].To better illustrate these classes we will now briefly describe the most common used methods of each class.
7
On the other hand, the MADM class presents methods such as Technique for Order Preference by Similarity to Ideal Solution (TOPSIS), AHP and its generalization the Analytic Network Process (ANP), Fuzzy Set Theory, Elimination Et Choix Traduisant la Realité (ELECTRE) and Preference Ranking Organization Methods for Enrichment Evaluations (PROMETHEE): TOPSIS is a compensatory method that uses the notion of geometric distance to evaluate the alternatives of a problem in relation to the ideal solution. AHP is a method based on mathematics and founded on a psychological background. It uses a hierarchy structure and pairwise comparisons to convert human judgment into a set of scores addressing the alternatives of the problem. Besides the original AHP methods, various methods were created based on the original concept. An example is the Analytic Network Process (ANP), which is a generalization of the AHP that allows the interdependency of different levels of the hierarchy forming a network of relations. The Fuzzy Set Theory methods were created to deal with imprecision in defining activities and expressions on the definition of problems. ELECTRE methods define a family with the same name which is closely related to the foundation of the European school of thought. These methods are based on the concept of outranking relations between the alternatives of the problem. PROMETHEE is another family of methods, also settled in the concept of outranking relations. This family was created as a simplest alternative to the use of ELECTRE. PROMETHEE uses preference functions to model the judgments and preferences of the decision makers.
Another classification used for MCDM methods is related to the quality of the available information. The application of MCDM to real world problems faces some issues related with imperfect knowledge from human evaluations, consequence of modelling complex real decision problems. Thus, the information is often catalogued as Crisp, when there is precise data or as Fuzzy, when it is incomplete or vague. In the same way, MCDM methods are subdivided into MADM/MODM if they use crisp information or into FMADM/FMODM (Fuzzy MADM/ Fuzzy MODM) if they use fuzzy knowledge. One of the modelling and solution techniques to solve this kind of problems is Fuzzy Set Theory, which has been on study over the last four decades (for more information on this subject see [13]).
2.3. Bibliometrics of MCDM
During the literature search conducted for this work, two important bibliometric studies emerged and showed some significant conclusions [14] [15]. This type of qualitative analysis, based mathematical and statistical examination of literature shows the development of research in certain areas. Although this practice is commonly used in other areas, there are few studies in the field of MCDM studies.
8
exponential growth of this field and how it has influenced other neighboring disciplines. Later, in 2011, Toloie-Eshlaghy and Homayonfar[15] published a review of the literature from 1999 to 2009, which presents the most relevant areas of application for MCDM methods through a comparative analysis, and also shows the most dominant methods within each area.
The main reason for mentioning these studies in the present dissertation remains in the fact that the conclusions presented by them allow us to give form to our objective of showing the scope of MCDM nowadays. Moreover, these two documents are mandatory to any initial research on the area, as they illustrate the multitude of publications accounting them by country, source, year, and research area.
According to Toloie-Eshlaghy and Homayonfar to ease the task of pointing out the relevant topics, the analyzed papers were divided in twelve categories: Transportation and Logistics, Business and Financial Management, Managerial and Strategic Planning, Project
Management and Evaluation, Other topics, Manufacturing and Assembly, Environment
Management, Water Management, Energy Management, Agricultural and Forestry
Management, Social service and Military Service. The category with bigger percentage of published papers was the Transportation and Logistics with around 20% of the total 386 application documents.
Among the 628 papers (application and non-application) analyzed on the same study the method with more papers dedicated was AHP (142 papers), followed by TOPSIS (54 papers), MOP (53 papers), GP (37 papers), ANP (37 papers), Fuzzy Set Theory (33 papers) and PROMETHEE (22 papers).
2.4. The Decision Process Model
The MCDM literature is divergent on the right approach to organize and define a decision making process or a Decision Making Situation (DMS). However a famous quote by Albert Einstein is largely used and points out the importance of this step:
“The formulation of a problem is often more essential than its solution, which may be merely a matter of mathematical or experimental skill”
9
2.4.1. Alternatives or Potential actions
The concepts of alternatives and potential actions come together as they represent the main goal of the decision process, or the possible choices for the DM. Every decision process starts with a problem that needs a solution or a set of solutions that together can solve the initial situation.
Different problems require different modelling approaches, which points out the difference between alternative and potential action. An action is called potential when it is possible to implement or it has something to add to the decision process. On other hand, an alternative results from modelling situations where two potential actions are mutually exclusive, so they are expected to operate separately [16]. Thus, when referring to the best alternative to a problem, one can think of it as the only potential solution to implement from the initial set. It is also essential to mention that a set of potential solutions can change through the decision process as more information is gathered, leaving out some actions.
Let 𝔸 be the set of possible actions, when we analyze a discrete decision space, then:
𝔸 = {𝒂𝟏, … , 𝒂𝒊, … , 𝒂𝒎}
2.4.2. Family of Criteria and Performance Table
The concept of criteria is connected to both the notions of attribute and objective, as we already observed when describing MADM and MODM. Eldrandaly et al. refer that an attribute measures the system performance regarding an objective, whereas the objective is a statement of the desired situation of the system [17].
A criterion that we denote by 𝒈𝒋, represents one of the possible dimensions from which the alternatives or possible actions can be evaluated, according to a defined point of view, in general the DM’s angle. The criteria measures how well a potential action is performing towards the goals of the problem.
It is important that the criteria are descriptive of the goals in order to understand the performance of each alternative under those goals. Thus, we denote by 𝒈𝒋(𝒂𝒊) the performance of an alternative 𝒂𝒊 regarding a certain criterion. This indicator assesses the level of fulfilment of a certain goal, and also allows the comparison of different alternatives concerning a given criterion.
10
A large number of decision methods use criteria weighting in order to favor a certain aspect of the
decision makers’ preferences. A well-known example of these methods is the AHP [21].
Choosing the right criteria for the problem situation in hands is very important, as it can shorten the number of alternatives or assure a consistent evaluation of the set of actions (for more details see [12], [16] and [22]). On the definition of the criteria, situations of independence, cooperation, or conflict can happen, thereby it is also relevant to analyze the way criteria interact.
2.4.3. Problematic
This last concept is related to the expected outcome of the decision problem and represents a major role in choosing the right method for the DMS under consideration.
Bernard Roy [23] categorized the decision making situations according to four major problematics, and the way the decision support should be envisaged:
The Description problematic (𝑷. 𝜹)–Decision support focuses in providing an appropriate set
of actions and a suitable family of criteria, without making any recommendation.
The Choice Problematic (𝑷. 𝜶)–The support intends to narrow down the number of actions to
find a single alternative or a possible smaller subset (usually containing the most fulfilling actions to the predefined goals).
The Sorting Problematic (𝑷. 𝜷)–In this problematic the support seeks to assign each action a
category from a set defined a priori. These categories can be related with the feasibility of the actions and the possibility of their implementation.
The Ranking Problematic (𝑷. 𝜸)–The decision support results in a complete or partial preorder of the set of alternatives, after comparing them with each other.
Although, these are the most common problematics across the literature other categories could be considered (see [24]).
2.4.4. Structure of a Decision Process
11
it combines different aspects of the decision support and closely relates to the selection methodology to be presented on the next section, and that will support our work.
It is often mentioned that a universal MCAP does not exist, meaning that a single MCAP is not likely to be used in all DMS. Each MCAP is associated to an approach, the considered possibilities are: the single synthesizing criterion approach, the outranking synthesizing approach and the interactive approach.
According to Guitouni et al. [9] the multi-attribute utility/value theory considers a set of attributes denoted by 𝑨, while the outranking methods consider a family of criteria denoted by 𝑭. This leads to a classical model 𝔸 − 𝑭/𝑨 − 𝔼 that can be used to describe any DMS. Although the model is considered incomplete (see [26]) it is representative for the purpose of this study.
The 𝔸 − 𝑭/𝑨 − 𝔼model, regards the set of alternatives 𝔸 and the family of criteria/attributes 𝑭/ 𝑨, and adds a new concept of Performance Table 𝔼, also called Decision Matrix. In this table the rows represent the alternatives, as the columns represent the criteria. A value on the intersection of a certain 𝒊𝒕𝒉 alternative with a 𝒋𝒕𝒉 criterion is the performance indicator 𝒈(𝒂), denoted 𝒆𝒊𝒋 on the performance table.
𝔸 = {𝒂𝟏, … , 𝒂𝒊, … , 𝒂𝒎}
𝑭/𝑨 = {𝒈𝟏, … , 𝒈𝒋, … , 𝒈𝒏}
𝔼 = {𝒆𝒊𝒋= 𝒈𝒋(𝒂𝒊) 𝒊 = 𝟏, … , 𝒎; 𝒋 = 𝟏, … , 𝒏}
The 𝔸 − 𝑭/𝑨 − 𝔼 model is included on the first stage of a five step decision-making process seen as recursive and nonlinear, with the decision maker and the decision analyst providing information and changes to the loop. Hence, we consider the following steps of the process represented in Figure 2.1, developed by Guitouni [25] :
I. Structuration– the structuring of the DMS (alternatives, criteria and Performance Table) II. Preferences Articulation and Modelling– determination of criteria relative importance,
inter-criteria information, value and utility functions, thresholds, etc.
III. Preferences Aggregation– establishment of a preference relational system IV. Exploitation (depends on each MCAP)
V. Recommendation –the output of the process
12
Figure 2.1. Model of a Multicriteria Decision Process (Adapted from [25])
2.5. How to choose a Decision Method
A fundamental step on the application of MCDM is to define or choose the appropriate MCDM method to solve the problem under consideration. Not all the methods are suitable for the same situations, for that reason there is a need to find the right method for a certain situation.
Many attempts have been made to define a framework that links each DMS to the most suitable decision method. This is an exhaustive, thorough, and nearly impossible procedure that must take
into consideration all the decision process dimensions, the DM’s role, not to mention the extensive
number and variety of methods, and the information available [27].
However it is unquestionable that the selection problem is primal to the success of the process [17], which explains some of the meticulous studies in this area (see [26]).
One of the first methodologies to help in the selection of a method was defined by Hwang and Yoon [28], and it is still in use. They organized some decision methods on a diagram tree according to the available information, then the DM only needs to follow the branches of the tree according to the DMS he is analyzing. In the end of the process the DM will find a proposed decision method or a group of possible methods. This approach provided the decision analysts and the decision makers with a simple tool to make a choice. Nevertheless, it is a restricted approach and leaves out important aspects of the decision process as well as powerful methods, not considered in the definition of the tree.
Step V
Step I Step II Step III Step IV
Multicriteria Method
MCAP
Aggregation Exploitation Preference Modelling Modelling Elements (Criteria relative importance, Thresholds, pairwise comparisons, value functions, utility functions) Analyst DM Output Input Data Structuring Process (𝔸, 𝑭, 𝔼 )
13
Later, a study conducted by Kornyshova et al. [20] presented a state of the art of the existing approaches to select MCDM methods. This study considered nine different approaches and compared them with each other regarding their characteristics. In this document the authors pointed out four major facets and their inner features which, according to them, guarantee the characterization of the decision problem in the selection context. Those facets are:
The Problem facet – type of decision problematic, problem scale (workplace, department, enterprise, corporation…).
The Potential Action facet – number of alternatives, ability to consider new alternatives,
incompatibility and conflict, organization of the alternatives, nature of the alternatives set (discrete, continuous).
The Criteria facet – data type, measure scale, criteria weighting, criteria interaction.
The Usage facet – tool (Software), Approaches for giving partial and final evaluations, Easiness
of use, cost for implementing (purchasing the tool, costs for training), decision maker preferences (DM understanding, skills and habits).
By analyzing these four facets and their elements, one can easily understand the amount of possibilities to define a selection methodology. Moreover, these facets address different aspects
of a DMS and also different DM’s points of view. For example, it is more likely for a DM without
proper training in the field of decision making to rely his choice on the Usage facet rather than on more technical facets such as the Criteria or the Potential Action.
2.5.1. Designated methodology for method selection
In order to capture the essential characteristics of the decision methods, we decided to apply an alternative methodology to the ones already mentioned. The procedure that we applied on our work combines an easy structure and a careful description of different methods, resulting from a comparative study of twenty-nine MCDA discrete methods. Once more, the methodology used was presented by Guitouni and Martel [9], already cited in the previous chapter. Their technique is based on the definition of seven guidelines that help choosing an appropriate decision method. Those guidelines are synthesized below and they will be observed in detail in the next section.
Guideline 1: Determine the stakeholders of the decision process.
Guideline 2: Consider the DM ‘cognition’ when choosing a certain preference evaluation mode.
Guideline 3: Determine the decision problematic pursued by the DM.
14
Guideline 6: Verifythe fundamental hypothesis of the method Guideline 7: Consider the decision support system
These seven guiding principles supported the designing of a typological tree of discrete MCAP. Similarly to what Hwang and Yoon, the DM or the analyst only needs to follow the branches of the tree according to the guidelines and one or several decision methods (MCAP) will be presented as possibilities for the DMS under consideration.
Although it may seem like an analogous technique, the seven guidelines approach presents more advantages to the selection process. Beyond the guidelines and the typological tree, Guitouni and Martel presented twenty-nine possible MCAP with detailed information about their characteristics and the way they fulfil the seven guidelines (see [9]). This information makes the selection process easier and less time-consuming, increasing the probability of having less possible methods as an output.
Before exploring the guidelines and typological tree it is important to mention that some limitations come with this strategy as, once more, it does not take into consideration all the possible methods and dimensions of the decision situations. Hence, not always an unequivocal choice is the result of its use. Still it represents a powerful tool for guiding the method selection and can be improved by adding new branches to the tree, new guidelines, and more easily other methods to the list, for example MACBETH [29], VIKOR [30], and ANP [31].
2.5.1.1. The Seven Guidelines
The first guideline (G1) intends to define the proper operational approach, one that will be in line with the perspectives of the stakeholders of the process, or the DM.
Guideline number two (G2) is divided in four different points concerning the preference elucidation modelling. The first point addresses the preference elucidation mode itself, pairwise comparisons and tradeoffs are two common examples. The second point refers to the moment of preference elucidation, which for the twenty-nine methods studied always happens a priori. The global DM preference structure considered is the third point in G2 and it regards the preference structures including for example Preference (𝑃), Indifference (𝐼), and Incomparability (𝑅) – {𝑃, 𝐼, 𝑅 }. The last point in G2 is the type of ordering of the alternatives, that results from the application of the method, total preorder, partial semiorder, and partial interval order are some of the possibilities.
15
The fourth guideline is related to information. Using G4 allows understanding the kind of information considered (ordinal, cardinal or mixed) and the nature of that information or its determinism.
G5 considers the discrimination power of the criteria (absolute or non-absolute), the compensation degree of the method and the inter-criteria information.
The guideline G6 regards the hypothesis of the method (e.g. Independence, commensurability, invariance, transitivity, dominance).
The last guideline (G7) refers to the existence of a software or tool to support the method application.
The twenty-nine methods are catalogued according to these seven guidelines and their inner elements, allowing a simple selection among those methods (see Annex A. ). The concepts behind the guidelines also appear in the typological tree conditioning the assortment of the branches. The next section presents the different levels of the typological tree in an adaptation of the original.
2.5.1.2. The Typological tree
The typological tree represents a graphical application of the guidelines. Through its use one can solve the selection process in an easier way, checking the different characteristics of the problem against the possible methods.
In the original typological tree [9], the authors present three stages of selection. However, to clearly identify not only the guidelines but also their inner elements we split up one of the stages in two smaller ones.
Every selection stage begins with a question. According to the answer we eliminate a group or groups of methods and we move to the next question, and also the next stage.
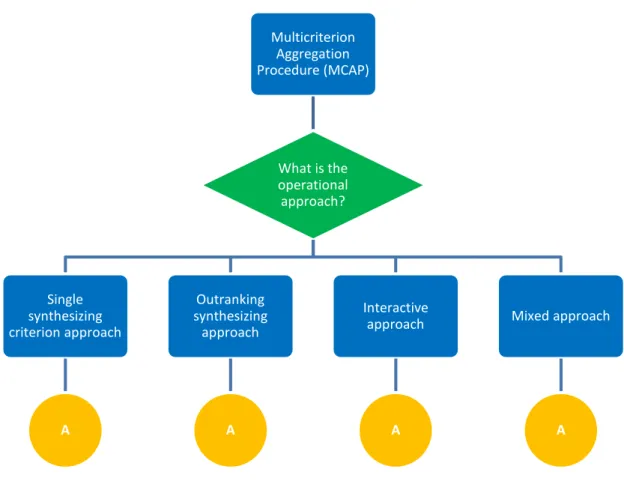
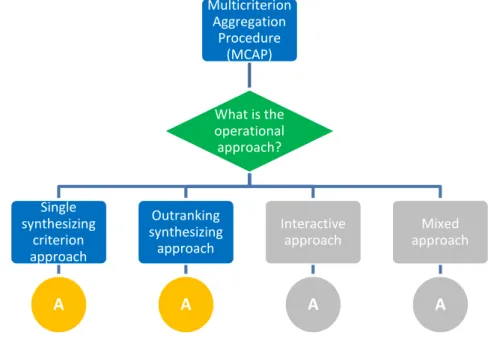
The first stage (Figure 2.2) asks the question “What is the operational approach?”. This question brings the guideline G1 and four possible answers. This first level of the tree allows the removal of a large number of methods, since it requests the DM to choose a family of methods.
16 Multicriterion
Aggregation Procedure (MCAP)
What is the operational approach?
Single synthesizing criterion approach
A
Outranking synthesizing
approach
A
Interactive approach
A
Mixed approach
A
Figure 2.2. First Stage of the Typological Tree
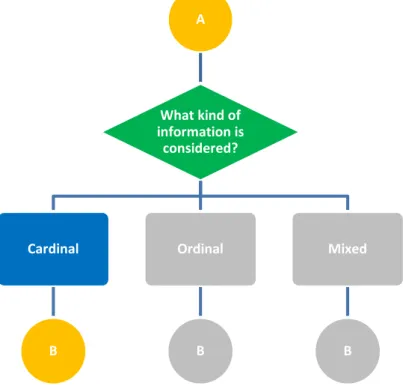
A
What kind of information is
considered?
Cardinal
B
Ordinal
B
Mixed
B
17
Stage two asks the question “What kind of information is considered?”. The possible answers are three: ordinal, cardinal and mixed. Once again, and considering that we are selecting a method among one of the families selected in the first stage, we are shortening the number of methods since some of the possibilities cannot deal with both kinds of information.
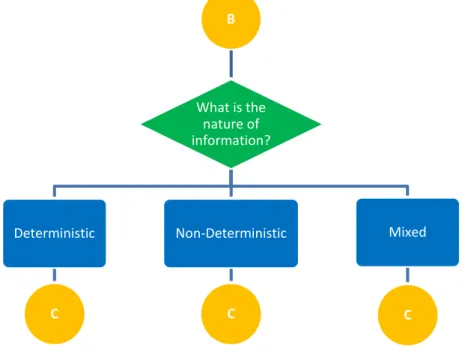
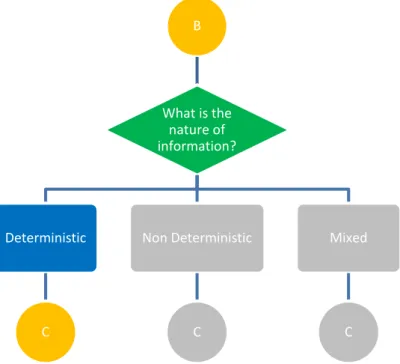
Similarly to stage two, stage three asks “What is the nature of the information?”, to assess the determinism of the information. With the proper answer one can choose a method that is able to deal with certain, uncertain, fuzzy or other types of information.
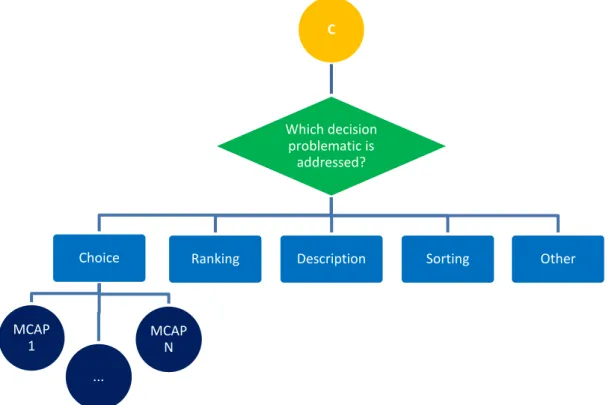
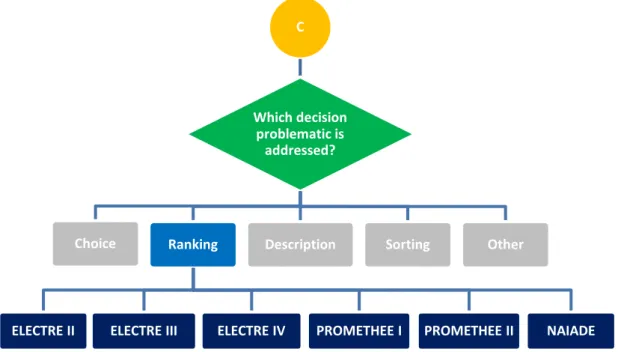
Last stage of the typological tree defines the final selection through the question “Which decision
problematic is addressed?”. This level relates to the guideline G3 to define a method that suits
the DM intentions. As we can see in Figure 2.5 these are the last branches of the tree, and they lead us to a selected MCAP or multiple.
Although the tree is only able to presents these four stages referring to guidelines G1, G3 and G4, it is important not to forget the other four guidelines. The application of G2, G5, G6 and G7 can sometimes guarantee an unequivocal output, and this is why the application of these four remaining guidelines is usually performed after using the typological tree to further refine the results.
Analyzing our designated methodology and all the other studies, we found that a common denominator to all of them is the fact that, even though some of them are very extensive and accurate, none of them is able to encompass all the methods and all the DMS.
B
What is the nature of information?
Deterministic
C
Non-Deterministic
C
Mixed
C
18
This problem could be solved with a standard tabulation for all the methodologies, creating a universal taxonomy for one or several of the available selection techniques. Despite the fact it is an interesting research topic, the method selection issue is outside the boundaries of our work. Thus we will accept the drawback of having multiple possibilities as an output of the method selection technique used, and justify our choices with other arguments.
C
Which decision problematic is
addressed?
Choice
MCAP 1
...
MCAP N
Ranking Description Sorting Other
19
3. Case Study
EnPROVE, Energy consumption prediction with building usage measurements for software-based decision support, is a European project supported by the European Union’s Seventh Framework Programme (FP72007-2013) under grant agreement 248061. This project ran between 2010 and 2013 and gathered institutions from Portugal, Spain, Germany, Netherlands, Poland and Ireland.
3.1. EnPROVE project description
Most building owners forgo building renovation and direct their investment to other areas, which may have a bigger impact. In addition, there are so many technologies related to energy efficiency measures, that it becomes an impossible mission to select the most appropriate ones for a specific building.
The EnPROVE project’s main objective is to convince, in an objective and accurate way, the investors, either building owners or not, to invest in renovation of existing infrastructures. The recovery of invested capital happens by the reduction of energy consumption and in shorter periods than usually perceived.
EnPROVE developed a method to predict energy consumption of a building once appropriate energy-efficient technologies were employed. This was used to prepare an implementation plan convincing building owners to renovate with energy-efficient solutions. The result was an easy-to-use software decision-support tool, structured to fit on a variety of architectural software programs.
The key hypothesis followed by EnPROVE is that it is possible, from the adequate gathering and assessing of data on how an infrastructure is being used, to build Energy Consumption Models relevant for prediction of alternative scenarios. By relevant prediction, it is meant enabling the assessment of the energy-efficiency impact of several alternative technologies for which available investment resources can be directed and, thus, supporting the decision maker in finding the best set of energy-efficient solutions to be implemented.
EnPROVE assumed that the data gathered on how an infrastructure is used may serve to improve the accuracy on prediction of future energy consumption impact of installing alternative sets of available technologies. This also justifies the necessary renovation investment based on a financial return-on-investment calculation.
20
on available market solutions and provide recommendations for a best solution, taking into consideration the decision-maker’s criteria and restrictions.
The concept of the EnPROVE platform is based on analyzing the real use of the building and proposing sets of control technologies that could be installed in the building, predicting the energy consumption.
The EnPROVE platform consists of two major systems [31]:
The Building Performance and Usage Auditing includes a wireless sensor network deployed in the building to be renovated, connected to local gateways that transmit data to the remote building performance and usage server, which processes this.
The Energy Prediction and Decision Support System responsible for interacting with the technical consultant to extrapolate the data collected from the building and predict energy consumption for several possible technical solutions, and enable the investor in selecting the best renovation scenario considering tangible (e.g. return on investment) and intangible (e.g. comfort level) criteria.
The EnPROVE platform is used to support a full assessment of a building to be renovated, suggest a set of possible renovation scenarios, and help the decision maker in selecting the most appropriate one.
A wireless sensor network is deployed to the building being assessed, to collect data on occupation, temperature inside and outside, daylight inside and outside, luminance, lighting and HVAC actuation. Sensors are deployed to typical zones, avoiding having to audit the complete building. The audit results are extrapolated to achieve full yearly profiles of a building’s use, which together with installation information, comprise the building’s baseline scenario, or starting point.
The EnPROVE decision support system suggests a set of renovation scenarios to be applied to the building, which can be compared with the baseline scenario. The investor has to select the most appropriate scenario to be implemented.
3.2. Technical and Financial Analysis
21
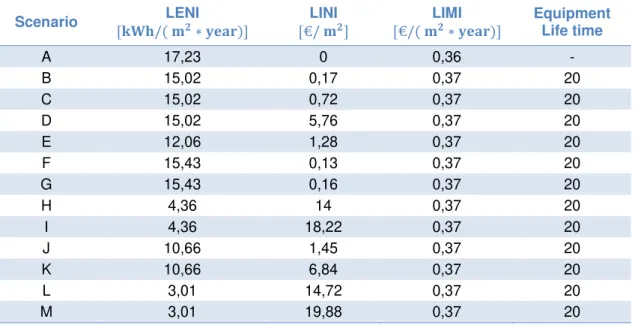
The defined KPI for evaluating the different scenarios are the Lighting Energy Numeric Indicator (LENI) the Lighting Initial Investment Indicator (LINI), and the Lighting Maintenance Indicator (LIMI).
LENI accesses the total annual lighting energy required in a building and it is expresses in [kWh/(m2∗ year)]. On the other hand, LIMI defines the total amount of money spent per year in maintenance, and it is expressed in [€/(m2∗ year)].
The last indicator is related to the initial investment for each scenario. LINI is presented in [€/m2].
After the technical evaluation, a financial analysis is performed to supply another set of indicators. This means that each scenario becomes a possible project to implement, so its financial characteristics need to be assessed in order to understand the project’s validity.
The financial perspective proposed by EnPROVE relies on three major indicators: Discounted Payback Period (PBP), Net Present Value (NPV) and Internal Rate of Return (IRR).
These indicators result from the combination of the KPI and the information related to the building. Following the indicators, the EnPROVE platform uses the available data to calculate standard, discounted, and cumulative Cash Flows (CF) for each scenario and then the Initial Investment, and the PBP, the NPV and the IRR.
3.2.1. Cash Flow
Since the aim of EnPROVE is to maximize energy efficiency, the Cash Flow results from an investing activity where the energy savings are considered the project Inflow.
Normally on a project, after the Initial Investment, the cash inflow is expected to be presented by the amount of money coming, for example from revenues. However, in this situation the cash inflow is the difference between what would be spent in a baseline scenario and what is really spent in one of the renovation scenarios provided by the platform. This means that the cash inflow is the amount of money saved after the renovation.
On the other hand, the cash outflow is the initial investment and, after that, the amount of money spent on building maintenance. In that way, the Cash Flow is the difference between Inflows and Outflows for a certain period, which in this case study is a year.
22
The latter is the sum of all Cash Flows (Net or Discounted) since the inception of the project or the company until a certain period, and it allows understanding the long term strength of a project.
To obtain the Discounted Cash Flow:
𝐷𝐶𝐹 = 𝐶𝐹 × (1 + 𝑖)1 𝑛
Where, 𝒊– discount rate 𝒏– period
3.2.2. Payback Period
There are two possible Payback Period indicators, the Simple Payback Period (SPB) and the Discounted Payback Period, being the latter considered much more accurate to make a decision.
The SPB represents the time the initial investment (outflow) is expected to be recovered from the inflows created by the investment.
Since the SPB does not account for the time value of the money, the PBP approach is followed in order to overcome that drawback.
To determine the PBP, first we should calculate the discounted cash flow and then the accumulated cash flow. Then we follow the formula:
𝐷𝑖𝑠𝑐𝑜𝑢𝑛𝑡𝑒𝑑 𝑃𝑎𝑦𝑏𝑎𝑐𝑘 𝑃𝑒𝑟𝑖𝑜𝑑 = 𝐴 +𝐵𝐶
Where, 𝑨 − Last period with a negative discounted cumulative cash flow
𝑩 − Absolute value of discounted cumulative cash flow at the end of period 𝐴 𝑪 − Discounted cash flow during the period after 𝐴
Both Simple and Discounted indicators do not take into account the cash inflows after the Payback Period. This means that other indicators should also be used to evaluate the project.
3.2.3. Net Present Value
23 The following formula stands for the NPV:
𝑁𝑃𝑉 = − 𝐶𝐹0+ ∑(1 + 𝑖)𝐶𝐹𝑛 𝑛 𝑇
𝑛=1
Where,𝑪𝑭𝟎− Initial Investment 𝑪𝑭 − Cash Flow
𝒊 − Discount rate 𝑻 − Project life time
3.2.4. Internal Rate of Return
The IRR is the discount rate that brings the net present value of an investment to zero. In other words, the IRR is the discount rate that equals NPV to the current value of the Initial Investment, or the break even rate. IRR is also a reliable measure for project appraisal. It allows a meaningful comparison with the defined discount rate showing the quality of the investment.
To determine the IRR:
𝑁𝑃𝑉 = 0 ⇔ − 𝐶𝐹0+ ∑(1 + 𝑖𝑟𝑟)𝐶𝐹𝑛 𝑛 𝑇
𝑛=1
= 0
Where,𝑵𝑷𝑽 −Net Present Value 𝑪𝑭𝟎− Initial Investment 𝑪𝑭𝒏− Cash Flow per period 𝒊𝒓𝒓 − Internal Rate of Return 𝑻 − Project life time
3.2.5. Decision Rules
All the financial indicators mentioned above have a decision rule which helps understanding if a certain project, under the evaluation of a particular factor, represents or not a good investment. These rules can be used either to evaluate a single project, or compare between a set of alternatives.
24
The decision rules for the NPV and IRR are slightly different, since the bigger the value of the indicator, the more probable is the project to be accepted. Usually a project is accepted if its NPV is positive or zero. However other indicators should be considered if the NPV is null. Moreover, whenever judging different projects, the one with the highest value of NPV should prevail.
Respecting the comparison of multiple projects, with equal initial investments, the IRR rule follows the previous, being the project with the highest value of IRR the right choice. Another important point is that a project with an IRR smaller than the target discount rate should be put aside.
These rules are very significant and can be used to provide a conjoint approach to help choosing the best project. On chapter 5 we will analyze these decision rules under a MCDM approach.
3.3. Test Case: Building in Dublin, Ireland
The first test of EnPROVE was realized in an office building in Ireland. The objective was to renovate only the lighting infrastructure of a portion of a building of 445 m2. The EnPROVE platform suggested twelve lighting renovation scenarios with energy savings between 300 kWh/year and 6 000 kWh/year, and investment efforts between 60 € and 9 000 € have been selected as input to the decision support process and the review by the investor.
The set of results produced by the EnPROVE platform in the Irish building were the beginning of the comparative analysis proposed in this dissertation. According to what we have described in chapter 2 the structure of a decision process is divided into five different phases. The first one is the Structuration and represents the definition of the basic elements of the decision situation: the criteria, the alternatives and the corresponding performance table.
Until now we have mentioned twelve renovation scenarios that henceforth will be mentioned as the alternatives/potential actions of the DMS. These alternatives are displayed in Table 3.1 alongside with the baseline scenario, or the original configuration of the building, before the auditing process.
We have also presented three financial indicators, the PBP, the NPV and the IRR, that in the context of the Structuration phase, and by EnPROVE default, we will consider the criteria/attributes of the DMS.
25
Table 3.1. Baseline and renovation scenarios with energy savings information
Scenario Scenario Description Energy
Savings
A Baseline -
B Scheduling (all zones) - auto 1-KeepLP-KeepCtrl 12,83%
C Scheduling (all zones) - auto 1 - KeepLP-LocalCtrl 12,83% D Scheduling (all zones) - auto 1 - KeepLP-AreaCtrl 12,83% E Manual On/Occupancy Off (improving) - auto 1 - KeepLP-LocalCtrl 30,01% F Occupancy On/Occupancy Off (improving) - auto 1 -
KeepLP-KeepCtrl
10,45%
G Occupancy On/Occupancy Off (improving) - auto 1 -
KeepLP-LocalCtrl 10,45%
H Daylight Dimming (improving) - auto 1 - KeepLP-LocalCtrl 74,70% I Daylight Dimming (improving) - auto 1 - KeepLP-AreaCtrl 74,70% J Scheduling (all zones) - auto 1 & Manual On/Occupancy Off
(improving) -auto 1-KeepLP-KeepCtrl
38,13%
K Scheduling (all zones) - auto 1 & Manual On/Occupancy Off
(improving) -auto 1-KeepLP-LocalCtrl 38,13%
L Scheduling (all zones) - auto 1 & Daylight Dimming (improving) -auto
1-KeepLP-LocalCtrl 82,53%
M Scheduling (all zones) - auto 1 & Daylight Dimming (improving) -auto
1-KeepLP-AreaCtrl 82,53%
Table 3.2. KPI and Equipment life time of each scenario
Scenario LENI
[𝐤𝐖𝐡/( 𝐦𝟐∗ 𝐲𝐞𝐚𝐫)] [€/ 𝐦LINI 𝟐] [€/( 𝐦LIMI 𝟐∗ 𝐲𝐞𝐚𝐫)] Equipment Life time
A 17,23 0 0,36 -
B 15,02 0,17 0,37 20
C 15,02 0,72 0,37 20
D 15,02 5,76 0,37 20
E 12,06 1,28 0,37 20
F 15,43 0,13 0,37 20
G 15,43 0,16 0,37 20
H 4,36 14 0,37 20
I 4,36 18,22 0,37 20
J 10,66 1,45 0,37 20
K 10,66 6,84 0,37 20
L 3,01 14,72 0,37 20
26 Table 3.3. Performance Table – Case study
Scenario IRR NPV PBP (years)
B 208,62% 2.504,92 € 1
C 49,24% 2.260,17 € 3
D 2,07% 17,37 € 20
E 65,86% 5.564,76 € 2
F 220,77% 2.030,47 € 1
G 179,37% 2.017,12 € 1
H 14,00% 9.149,01 € 8
I 9,82% 7.271,11 € 10
J 74,07% 7.169,95 € 2
K 14,69% 4.771,40 € 7
L 14,88% 10.449,42 € 7
27
4. Choosing the appropriate decision method for the Case Study
After defining the case study problem with all the fundamental characteristics, and with that defining the DMS, we can bring the methodology presented in chapter 2 and through it select the appropriate decision method to help solve it. As we have already mentioned the chosen methodology applies a set of guidelines and a typological tree to determine the suitable decision method among a list of twenty-nine possibilities (see Annex A. ).
In the present chapter we will go through the process of selection step by step, simulating the application of this methodology by a DM or a decision analyst.
The first element that we have considered was the typological tree. Therefore, the guidelines G1, G3 and G4 are the leading components of the selection. The remaining guidelines were applied after removing most methods, guaranteeing a refined output of the process.
The first question of the typological tree placed by guideline G1 is “What is the operational approach?”. This interrogation usually has one single answer depending on the DM preferences. However, the main objective of our work is the performance of a comparative analysis between different MCDM approaches. Examining the four possible operational approaches in the methods catalogue (see Annex A. ), we noted that the single synthesizing criterion approach and outranking synthesizing approach were the ones with more available options. Therefore the answers to the first question of the typological tree are the ones highlighted in Figure 4.1 to assure a broader and richer analysis.
Figure 4.1. First stage of the typological tree - Method selection Multicriterion
Aggregation Procedure
(MCAP)
28
The next questions on the tree are relative to the information involved in the DMS. The guideline G4 embodies those two questions, “What kind of information is considered?” and “What is the
nature of information?”. According to the data of the Case Study the answers are easily obtained,
since we are dealing with cardinal and deterministic information (Figure 4.2 and Figure 4.3).
By the end of this stage, we are still considering six methods from the single synthesizing criterion approach and nine from the outranking synthesizing approach. This means that at this point of the selection process we have already eliminated fourteen methods from the original twenty-nine.
The final step of the typological tree represents the guideline G3 and the question “Which decision problematic is addressed?”. The obvious answer is ranking, since the objective of our DMS is to find the best renovation scenario and understand the order of the following possibilities. At this point we present the possibilities found by using the typological tree for both approaches, single synthesizing criterion (Figure 4.4) and outranking synthesizing (Figure 4.5).
The application of the typological tree resulted in the elimination of twenty-one methods, leaving two methods from the single synthesizing criterion approach and six from the outranking synthesizing approach.
Figure 4.2. Second stage of the typological tree – Method selection A
What kind of information is
considered?
Cardinal
B
Ordinal
B
Mixed
29
Since we could not find the two unequivocal outputs we were looking for with the use of the first element of the methodology, the application of the four remaining guidelines is necessary.
We will start by considering the last guideline G7, since it is the easiest one to apply. This guideline evaluates the existence of a support system, more precisely a software tool. It represents an
Figure 4.3. Third stage of the typological tree - Method selection
Figure 4.4. Fourth stage of the typological tree - Method Selection (1) B
What is the nature of information?
Deterministic
C
Non Deterministic
C
Mixed
C
C
Which decision problematic is
addressed?
Choice Ranking
AHP EVAMIX
![Figure 2.1. Model of a Multicriteria Decision Process (Adapted from [25]) ________________ 12 Figure 2.2](https://thumb-eu.123doks.com/thumbv2/123dok_br/16570314.737986/15.892.144.768.164.836/figure-model-multicriteria-decision-process-adapted-figure.webp)
![Figure 2.1. Model of a Multicriteria Decision Process (Adapted from [25])](https://thumb-eu.123doks.com/thumbv2/123dok_br/16570314.737986/30.892.145.747.123.568/figure-model-multicriteria-decision-process-adapted.webp)