UNIVERSIDADE NOVA DE LISBOA
Faculdade de Ciências e Tecnologia
Filipe dos Santos Folgosa
Structural and Mechanistic Studies of
Iron Containing Proteins
Filipe dos Santos Folgosa
Structural and Mechanistic Studies of
Iron Containing Proteins
Lisboa
2008
Agradecimentos
A execução desta tese só foi possível com a colaboração de algumas pessoas.
Assim, em primeiro lugar gostaria de agradecer ao Prof. Pedro Tavares, meu orientador, não só por me ter recebido aquando do meu estágio de licenciatura mas principalmente por me ter guiado ao longo da realização deste trabalho. Muito obrigado pela dedicação. Muito obrigado por tudo!
Seguidamente gostaria de agradecer à Prof. Alice Pereira, não só pela enorme ajuda científica, mas principalmente pela amizade, disponibilidade e por todos os bons conselhos.
Aos Profs. José Moura e Isabel Moura agradeço o facto de me terem recebido nos seus laboratórios e facultado a utilização dos seus equipamentos, bem como pela amizade demonstrada.
Aos meus colegas Américo, Márcia e Cristina Timóteo gostaria de agradecer não só pela amizade e companheirismo demonstrado mas sobretudo pela ajuda importante para a realização do segundo capitulo desta tese.
Gostaria também de agradecer ao Prof. Boi Hanh (Vincent) Huynh, ao Doutor Sunil Naik e ao Doutor Danilo Ortillo pela forma de como fui recebido no Departamento de Física da Universidade de Emory e pela ajuda não só na obtenção de alguns dos dados desta tese como da discussão cientifica.
À Joana Santos gostaria de agradecer não só a ajuda (fantástica!) no plano cientifico mas sobretudo pela boa disposição e pelos momentos de “gargalhada” no laboratório.
Não posso também deixar de agradecer ao Rui Almeida pela amizade, companheirismo, disponibilidade e ajuda sempre prestada ao longo destes anos, em especial na revisão desta tese.
que já foram embora (Anders e Patrícia Raleiras), gostaria de agradecer a vossa ajuda, amizade e disponibilidade em alguns momentos ao longo destes anos.
Aos outros colegas “doutorandos” do DQ, António Nunes, Diogo Latino, Inês Gomes e Vítor Rosa gostaria de agradecer os grandes momentos de boa disposição e companheirismo.
Ao grande amigo Bruno Pedras gostaria de agradecer os todos os bons momentos passados ao longo destes anos e em especial por me fazer sempre lembrar que há outras coisas na vida para além da ciência!
À Margarida queria agradecer por, de uma forma ou de outra, ter estado sempre comigo quer nos momentos bons quer nos menos bons. Muito obrigado por estares “aqui”...
Aos todos os outros meus amigos, especialmente ao David, Inês, Marta, Miguel, Pedro, Ricardo, gostaria de agradecer o facto de terem estado sempre presentes, mesmo quando eu não podia estar! Prometo que um dia vos vou recompensar!
Aos meus pais e a toda a minha família (aos que estão e ao que já não podem assistir...) tenho de agradecer por todo o apoio demonstrado desde sempre, nunca dizendo que não a nada. Assim é bem mais fácil andar para a frente.
Resumo
Ao longo das últimas décadas tem-se assistido a um grande desenvolvimento no campo da bioquímica estrutural e funcional tendo por base o estudo de proteínas, especificamente enzimas, que possuem na sua constituição centros metálicos.
Nesta tese são abordadas diferentes proteínas com diferentes tipos de centros de ferro não-hémico. A relação destas quer com o oxigénio molecular quer com espécies reactivas de oxigénio encontra-se também em estudo.
Na realização deste trabalho foram utilizadas diversas técnicas de cinética rápida, acopladas a técnicas espectroscópicas como a Ressonância Paramagnética Electrónica (RPE), Espectroscopia de Mössbauer e UV-Visível.
Incorporação de ferro pela ferritina de Desulfovibrio vulgaris Hildenborough
As ferritinas são proteínas globulares compostas por 24 subunidades e que podem comportar no seu interior até 4500 átomos de ferro provenientes da sua actividade ferroxidática.
Este tipo de proteínas pode ser encontrado em praticamente todos os organismos e tem quase sempre como substrato, para além do ferro, o oxigénio molecular.
O objectivo deste trabalho visa a caracterização não só cinética mas também espectroscópica (espectroscopias de RPE e Mössbauer) da incorporação de ferro pela ferritina de Desulfovibrio vulgaris Hildenborough.
A redução do radical anião superóxido pelo redutase do superóxido
Os redutases do superóxido são enzimas não-hémicos, de pequena massa molecular, com centros metálicos de ferro coordenados por enxofre, normalmente associado à protecção contra o stress oxidativo.
Foi estudado o processo de transferência electrónica entre três diferentes formas deste enzima e o seu doador electrónico. Um estudo da transferência electrónica mediada pelo consumo de superóxido foi também realizado. O conjunto destes dados permitiu compreender a relevância de um dos centros desta proteína para a sua actividade.
Finalmente, foi efectuada uma caracterização por espectroscopia de Mössbauer de uma SOR, pertencente à classe II.
Estudo da incorporação de metais numa forma Apo da rubredoxina de Desulfovibrio gigas
A caracterização, bem como o estudo de metaloproteínas, envolve maioritariamente a utilização de técnicas espectroscópicas (espectroscopias de RPE, Mössbauer, Ressonância Raman, Fluorescência, entre outras). Contudo, a complexidade das proteínas e dos seus centros metálicos pode causar algumas dificuldades quer na escolha da técnica a usar, quer na análise dos dados obtidos.
O estudo de proteínas estruturalmente mais simples ou que possuam características espectroscópicas singulares pode torná-las modelos para proteínas mais complexas.
Neste caso, a proteína em estudo, a rubredoxina de Desulfovibrio gigas, foi utilizada não só como modelo para as espectroscopias de UV-Visível e Mössbauer mas também para a incorporação de metais em proteínas.
Abstract
Over the last few decades a large effort has been done in the structural biochemistry field. This effort is based on the study of some proteins, namely metalloproteins, that contain cofactors and/or active sites with metal ions in their constitution.
This thesis will focus on different studies performed in metalloproteins that contain non-heme iron centers. An important point is their relation to oxygen and reactive oxygen species.
To perform these studies, fast kinetic techniques were used coupled to spectroscopic techniques, such as Electronic Paramagnetic Resonance (EPR), Mössbauer and UV-Visible.
Metal incorporation by Desulfovibrio vulgaris Hildenborough ferritin
Ferritins are globular proteins composed by 24 subunits that are able to store about 4500 iron atoms in an inner central cavity. These iron atoms are rescued from solution and concomitantly oxidized from the ferrous to the ferric state using molecular oxygen as co-substrate. Such activity is, for fast ferritins, called ferroxidase activity.
These proteins are found in most organisms (including bacteria, plants and animals) and serve the dual purpose of regulating iron concentration and detoxification.
The metal incorporation process performed by Desulfovibrio vulgaris Hildenborough ferritin was studied by fast kinetic techniques coupled to spectroscopies like EPR and Mössbauer.
Superoxide reduction by superoxide reductase
Superoxide reductases (SOR) are small proteins with non-heme iron centers coordinated by sulfur, oxygen and nitrogen atoms. These proteins are usually associated with oxidative stress regulation.
Three different forms of a class I SOR were studied. The studies performed aimed the characterization of both direct and superoxide mediated electron transfer between SOR and it physiological donor, rubredoxin.
The results obtained were helpful in order to understand the relevance of center I of class I SOR to the enzyme’s activity.
Another study based on Mössbauer spectroscopy was also performed in a class II SOR.
Metal incorporation in an Apoprotein form of Desulfovibrio gigas rubredoxin
As mentioned before, the characterization of metalloproteins is directly connected to the use of spectroscopic techniques like EPR, Mössbauer, Resonance Raman, Fluorescence and others). However, some proteins have a complex assortment of several metallic centers making difficult a complete spectral analysis.
The use of smaller, less complex proteins and enzymes that contain in their structure features that simplify the spectroscopic analysis can be very helpful since they can be used as model to more complex systems.
In this thesis, a small electron transfer protein, rubredoxin from Desulfovibrio gigas, was used not only as a model for techniques like Mössbauer spectroscopy and UV-Visible, but also to study metal incorporation processes in this type of proteins.
Symbols and Abbreviations Symbols
ΔEQ Quadrupole Splitting
δ Isomer shift
Γ Mössbauer spectrum linewidth
v Reaction rate
k Kinetic rate constant
k’ Apparent kinetic rate constant
V Volt
Abbreviations
a.a Amino acid
Apo Apoprotein
BSA Bovine Serum Albumin
CcO Cytochrome c Oxidase (EC 1.9.3.1)
CcP Cytochrome c Peroxidase (EC 1.11.1.5)
CCR Closed-Cycle Refrigerator
D. Desulfovibrio
DEAE Diethylaminoethylethane
Dfx Desulfoferredoxin
Dg Desulfovibrio gigas
DNA Deoxyribonucleic acid
Dps DNA protection during starvation
Dv Desulfovibrio vulgaris Hildenborough
DTT Dithiothreitol
EDTA Ethylenediaminetetraacetic acid
EPR Electron Paramagnetic Resonance
E. coli Escherichia coli
Ftn Ferritin
FtnA Ferritin A from E. coli
HPLC High Performance Liquid Chromatography,
LB Luria-Bertani broth or medium
M. Methanobacterium
MES 4-Morpholineethanesulfonic acid
MMO Methane Monooxygenase (EC 1.14.13.25)
NADH Nicotinamide Adenine Dinucleotide
Nlr Neelaredoxin (EC 1.15.1.2)
NOS Nitric Oxide Synthase (EC 1.14.13.39)
O.D. Optical Density
PDB Protein Data Bank
RFQ Rapid Freeze-Quench
Rd Rubredoxin
RNR-R2 Ribonucleotide Reductase R2 (EC 1.17.4.1)
RO Rieske Oxygenase (EC 1.14.12.18)
SDS-PAGE Sodium Dodecyl Sulfate Polyacrylamide Gel Electrophoresis
SF Stopped-Flow
SOD Superoxide dismutase (EC 1.15.1.1)
SOR Superoxide reductases (EC 1.15.1.2)
TCA Trichloroacetic Acid
TPTZ Tripyridyl-s-triazine
Tris-HCl Tris(hydroxymethyl)aminomethane
Tyr Tyrosine
UV-Vis UV-Visible
Index Chapter I
General Introduction
I.1 – Biological Mechanisms of Oxygen Activation 3
I.1.1 – Heme monooxygenases 4
I.1.2 – Non-Heme monooxygenases 12
I.1.3 – Bacterial Ferritins 15
I.2 – Detoxification of Reaction Oxygen Species 18
I.2.1 – Superoxide Reductases 18
I.2.2 – SOR Electron Donor, Rubredoxin 23
I.3 – References 25
Chapter II
Structural and mechanistic features of Ferritin from Desulfovibrio vulgaris Hildenborough
II.1 – Overview 39
II.2. – Experimental 40
II.2.1 – Dv Ferritin, overexpression and isolation 40
II.2.2 – Stopped-Flow and Rapid Freeze-Quench EPR and Mössbauer
studies of pre-loaded wild type ferritin and E130A mutant 40
II.2.2.1 - Rapid Freeze-Quench EPR and Mössbauer studies 40
II.2.2.2 – Stopped-Flow studies 50
II.3 – Discussion 65
II.4 – References 68
Chapter III
Structural and mechanistic features of SORs from Desulfovibrio vulgaris Hildenborough and Desulfovibrio gigas
III.1 – Overview 73
III.2 - Experimental 73
III.2.1 – Dv SOR, overexpression and isolation 73
III.2.2 – Biochemical and spectroscopic characterization of the new “blue”
III.2.3 – Overexpression of Dv SORZn-Fe 83
III.2.4 – Direct electron transfer between recombinant SOR forms and
rubredoxin from Desulfovibrio vulgaris Hildenborough 84
III.2.5 – Superoxide Reductase Activity 96
III.2.6 – Desulfovibrio gigas SOR, Mössbauer studies 105
III.3 – Discussion 112
III.4 – References 116
Chapter IV
Structural and mechanistic studies of metal incorporation in rubredoxin from Desulfovibrio gigas
IV.1 – Overview 121
IV.2 - Experimental 122
IV.2.1 – Overexpression and purification of recombinant D. gigas
rubredoxin 122
IV.2.2 – Production of apoprotein of D. gigas rubredoxin 123
IV.2.3 – Co, Ni, Zn and Fe incorporation in apo rubredoxin. Stopped-flow
approach 125
IV.2.4 – Iron incorporation by apoprotein form of rubredoxin: Rapid
Freeze-Quench 57Fe Mössbauer spectroscopy 139
IV.3 - Discussion 143
IV.4 – References 146
Appendix A Methods
A.1 – E.coli BL21(DE3) transformation protocol 150
A.2 – SDS-PAGE electrophoresis: Solutions and methods 151
A.3 – Protein quantification: Lowry method 153
A.4 – Growth media description: LB, M9 and SOC 155
A.4.1 – Luria-Bertani broth 155
A.4.2 – M9 growth medium 156
A.5 – Buffer solutions 158
A.6.1 – Tris-HCl buffer 158
A.6.2 – Phosphate buffer 159
A.6.3 – MES Buffer 159
A.6 – References 160
Appendix B Equipment
B.1 – Stopped-Flow apparatus: aerobic and anaerobic setup 162
B.2 – Rapid Freeze-Quench apparatus: aerobic and anaerobic setup 164 B.3 – Closed-Cycle Refrigerator (CCR) Mössbauer spectrometer: a general
overview 166
Figures Index Chapter I
General Introduction
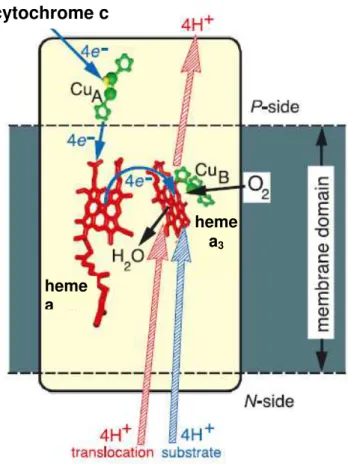
Figure I. 1 – Schematic representation of CcO function. The blue arrows
represent the O2 reduction to water. The red arrows represent the proton
translocation coupled to the enzymatic activity. Adapted from [10].
6
Figure I. 2 – Schematic representation of CcO enzymatic mechanism. Adapted
from[12]. 7
Figure I. 3 - Schematic representation of NOS enzymatic mechanism. Adapted
from[12]. 9
Figure I. 4 – Schematic representation of cytochrome P450 catalytic cycle.
Adapted from [17]. 10
Figure I. 5 – Schematic representation of sMMO catalytic cycle. Adapted from
[6, 24, 25]. 13
Figure I. 6 – Schematic representation of the three components of a Rieske
Oxygenase system. Adapted from [26]. 14
Figure I. 7 - A) 3D Structure of 24-mer FtnA from Escherichia coli (PDB Id.
1EUM). 2.05 Å resolution (Stillman, T.J., [41]). B) Subunit of the FtnA from Escherichia coli.
16
Figure I. 8 - Generic scheme of ferritin catalytic cycle. Adapted from [42-45]. 17 Figure I. 9 – A) 3D Structure of SOR from Desulfovibrio desulfuricans ATCC
27774 (PDB Id. 1DFX). 1.9 Å resolution (Coelho et al., [89]). B) Scheme of SOR’s center I. C) Scheme of SOR’s center II. The dark orange spheres represent the iron atom and the blue sphere represents the calcium atom.
21
Figure I. 10 – Schematic representation of a proposed catalytic mechanism of
SOR considering the following forms: (a) ferrous active state; (b) ferric peroxo intermediate; (c) ferric hydroperoxo intermediate; (d) an extra water molecule is recruited; (e) rearrangement leading to protonation; (f) ferric hydroxyl-bound resting state and (h) ferric carboxylate-bound resting state. Adapted from [82].
22
Figure I. 11 – A) 3D Structure of rubredoxin from Desulfovibrio vulgaris strain
Hildenborough (PDB Id. 1RB9). 0.92 Å resolution. (Dauter Z., et al.). B) Schematic representation of rubredoxin’s iron center. Iron atom coordinated by the four cysteine residues. The dark orange spheres represent the iron atom.
Chapter II
Structural and mechanistic features of Ferritin from Desulfovibrio vulgaris Hildenborough
Figure II. 1 – A) Ferroxidase center of human H-chain ferritin. B) Ferroxidase
center of E. coli FtnA. The glutamic acid at position 130 is marked in red. Adapted from [3].
39
Figure II. 2 - Time dependent Mössbauer spectra of the reaction of Dv ferritin,
62 irons/protein, with O2-saturated buffer. The solid lines over the experimental
data are simulations of a sum of a ferrous species, a peroxodiferric species and a ferric species. The Mössbauer spectra were recorded at 4.2 K in the presence of a weak magnetic field of 500 G parallel to the γ radiation beam.
42
Figure II. 3 -Time dependent Mössbauer spectra of the reaction of Dv ferritin,
62 irons/protein, with O2-saturated buffer. The Mössbauer spectra were
recorded at 4.2 K in the presence of a strong magnetic field of 80 kG parallel to the γ radiation beam.
43
Figure II. 4 - Time dependent EPR spectra of the reaction of Dv ferritin with
O2-saturated buffer. The experimental conditions used were: temperature 12 K;
microwave frequency 9.656 GHz; microwave power 2 mW; modulation amplitude 5 mT; receiver gain 1.26 x 10⁵ and attenuation of 30 dB.
46
Figure II. 5 – A) Time dependent Mössbauer spectra of the reaction of E130A
mutant, 62 irons/protein, with O2-saturated buffer. The solid lines over the
experimental data are simulations of a sum of a ferrous component and a peroxodiferric species. B) The experimental spectra are the same as in A) but the solid line represents only the simulation for the peroxodiferric species in each sample. The Mössbauer spectra were recorded at 4.2 K in the presence of a weak magnetic field of 500 G parallel to the γ radiation beam.
47
Figure II. 6 - Time dependent Mössbauer spectra of the reaction of E130A
mutant with O2-saturated buffer. The solid lines over the experimental data are
simulations of the peroxodiferric species present in each sample. The Mössbauer spectra were recorded at 4.2 K in the presence of a strong magnetic field of 80 kG parallel to the γ radiation beam.
48
Figure II. 7 - 2D Spectral evolution of Fe2+ incorporation in ferritin. The assay
was performed to a final concentration of 25 μM Ftn and 62 Fe/protein at pH 7.6 in 200 mM Tris-HCl plus 200 mM NaCl. The arrow points to the 412 nm peak.
Figure II. 8 - 3D Spectral evolution of Fe2+ incorporation in ferritin. The assay
was performed to a final concentration of 25 μM Ftn and 62 Fe/protein at pH 7.6 in 200 mM Tris-HCl plus 200 mM NaCl.
51
Figure II. 9 – Kinetic trace recorded at 412 nm of a 1:1 mixture (v/v) of 50 μM
Ftn incubated anaerobically with FeSO4 to a final ratio of 62 Fe/protein at pH 7.6
in 200 mM Tris-HCl plus 200mM NaCl. The green line represents the values obtained from fit of the theoretical modelto the experimental data.
53
Figure II. 10 - Kinetic trace recorded at 581 nm of a mixture 1:1 (v/v) of 50 μM
Ftn incubated anaerobically with FeSO4 to a final ratio of 62 Fe/protein at pH 7.6
in 200 mM Tris-HCl plus 200mM NaCl. The green line represents the values obtained from the fit of the theoretical model to the experimental data.
54
Figure II. 11 – Simulated species evolution through time of a 1:1 mixture (v/v) of
50 μM Ftn incubated anaerobically with FeSO4to a final ratio of 62 Fe/protein at
pH 7.6 and 200 mM Tris-HCl plus 200 mM NaCl. Red line corresponds to B species (peroxodiferric), green line corresponds to C species (tyrosyl radical), pink line corresponds to D species and orange line corresponds to E species (young mineral core).
55
Figure II. 12 – Visible spectra obtained for each species isolated according to
the kinetic model applied. Light gray stands for the peroxodiferric species, gray for tyrosyl radical species (B and C in the proposed mechanism, respectively), dark gray for D species and black for young mineral core (E in the proposed mechanism). These species were obtained from a 1:1 mixture (v/v) of 50 μM Ftn incubated anaerobically with FeSO4 to a final ratio of 62 Fe/protein at pH 7.6 in
200 mM Tris-HCl plus 200mM NaCl.
56
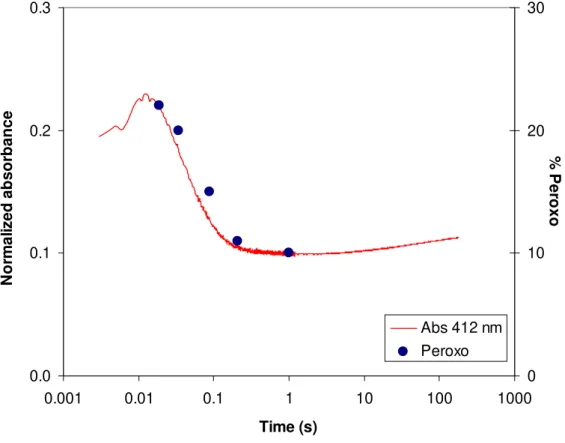
Figure II. 13 – Normalized absorbance at 412 nm superimposed with
percentages obtained from the Mössbauer spectra for peroxodiferric species. 57
Figure II. 14 -2D Spectral evolution of Fe2+ incorporation in E130A mutant. The
assay was performed to a final concentration of 28 μM E130A and 62 Fe/protein at pH 7.6 in 200 mM Tris-HCl plus 200 mM NaCl.
58
Figure II. 15 -3D Spectral evolution of Fe2+ incorporation in E130A mutant. The
assay was performed to a final concentration of 28 μM E130A and 62 Fe/protein at pH 7.6 in 200 mM Tris-HCl plus 200 mM NaCl.
Figure II. 16 –Kinetic trace recorded at 575 nm of a 1:1 mixture (v/v) of 56 μM
E130A mutant incubated anaerobically with FeSO4 to a final ratio of 62
Fe/protein at pH 7.6 in 200 mM Tris-HCl plus 200mM NaCl. The green line represents the values obtained from the fit of the theoretical model to the experimental data.
60
Figure II. 17 - Species evolution in time of a 1:1 mixture (v/v) of 56 μM E130A
mutant incubated anaerobically with FeSO4 to a final ratio of 62 Fe/protein at pH
7.6 in 200 mM Tris-HCl plus 200mM NaCl. Red line corresponds to A species, green line corresponds to B species (peroxodiferric), pink line corresponds to C species (peroxodiferric) and orange line corresponds to D species (young mineral core).
61
Figure II. 18 - Visible spectra obtained for each species isolated according the
kinetic model applied. Light gray stands for the peroxodiferric species, gray for the second peroxodiferric species (B and C in the proposed mechanism, respectively), black for young mineral core (D in the proposed mechanism). These species were obtained from a 1:1 mixture (v/v) of 56 μM E130A incubated anaerobically with FeSO4 to a final ratio of 62 Fe/protein at pH 7.6 in
200 mM Tris-HCl plus 200mM NaCl.
62
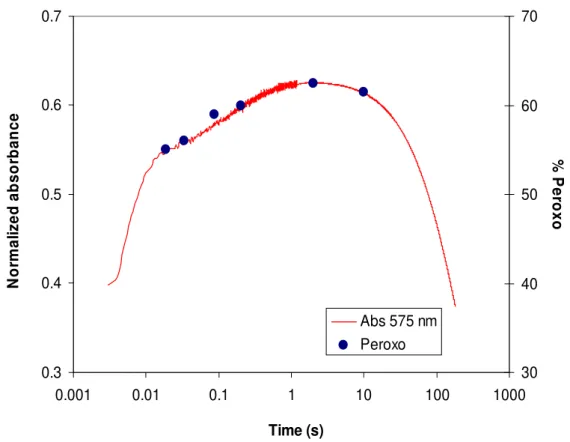
Figure II. 19 - Normalized absorbance at 575 nm superimposed with
percentages obtained from the Mössbauer spectra for peroxodiferric species. 63
Chapter III
Structural and mechanistic features of SORs from Desulfovibrio vulgaris Hildenborough and Desulfovibrio gigas
Figure III. 1 – Absorbance spectrum of the oxidized form of the new “blue” form
of Dv SOR. 76
Figure III. 2 – UV-Vis spectra of both gray form (A) and pink form (B) of Dv SOR
and a difference spectrum (C) between A and B showing the isolated center II. Adapted from Tavares and coworkers[4].
77
Figure III. 3 – UV-Vis spectrum of the oxidized form of Desulfovibrio gigas SOR.
The protein concentration was 40 μM. Adapted from Chen and coworkers[8]. 78 Figure III. 4 – Comparison between the NH2-terminal sequence of the new
“blue” form of Dv SOR and the deduced amino acid sequence predicted from the Dv SOR encoding gene.
Figure III. 5 – Schematic representation of class I SOR. A) SORFe-Fe, where the
orange dots represent the iron atoms in both centers. B) SORZn-Fe, where the
green dots represent the zinc atoms in center I and orange dots represent the iron atoms in center II.
80
Figure III. 6 – EPR spectra of A) as purified SORZn-Fe and B) Oxidized SORZn-Fe
(by incubation with sodium hexachloroiridate (IV)). The experimental conditions used were: temperature 4.1 K; microwave frequency 9.653 GHz; microwave power 2.002 mW; modulation amplitude 1 mT; receiver gain 1.26 x 10⁵.
81
Figure III. 7 – Temperature dependence of EPR spectra of as-purified SORZn-Fe.
A) T = 4.2 K; B) T = 10 K; C) T = 15 K; D) T = 20 K; E) T = 25 K. Other conditions used were: microwave frequency 9.653 GHz; microwave power 2.002 mW; modulation amplitude 1 mT; receiver gain 1.26 x 10⁵.
82
Figure III. 8 - Stopped-flow kinetics of the oxidation of reduced rubredoxin by
the pink form of SORFe-Fe. The variation was measured by the absorbance
changes at 500 nm and converted to concentration. The gray line represents the experimental data and the black line represents the theoretical fit. Solutions of 50 μM reduced rubredoxin were mixed (1:1) (v/v) with 50 μM oxidized SOR at 10 ºC.
86
Figure III. 9 - Stopped-flow kinetics of the oxidation of reduced rubredoxin by
the gray form of SORFe-Fe. The variation was measured by the absorbance
changes at 500 nm. The gray line represents the experimental data and the black line represents the theoretical fit. Solutions of 50 μM reduced rubredoxin were mixed (1:1) (v/v) with 50 μM oxidized SOR at 10 ºC.
87
Figure III. 10 - Stopped-flow kinetics of the reduction of gray form SORFe-Fe by
reduced rubredoxin. The variation was measured by the absorbance changes at 650 nm and converted to concentration. The gray line represents the experimental data and the black line represents the theoretical fit. Solutions of 50μM of reduced rubredoxin were mixed (1:1) (v/v) with 50 μM of oxidized SOR at 10ºC.
Figure III. 11 - Stopped-flow kinetics of the reduction of gray form SORFe-Fe by
reduced rubredoxin. The variation was measured by the absorbance changes at 500 nm and converted to concentration. The gray line represents the experimental data and the black line represents the theoretical fit. Solutions of 50 μM reduced rubredoxin were mixed (2:1) (v/v) with 50 μM oxidized SOR at 10 ºC.
89
Figure III. 12 - Stopped-flow kinetics of the reduction of gray form SORFe-Fe by
reduced rubredoxin. The variation was measured by the absorbance changes at 650 nm and converted to concentration. The gray line represents the experimental data and the black line represents the theoretical fit. Solutions of 50 μM reduced rubredoxin were mixed (2:1) (v/v) with 50 μM oxidized SOR at 10 ºC.
90
Figure III. 13 – Stopped-flow kinetics of the oxidation of reduced rubredoxin by
oxidized SORZn-Fe. The variation was measured by the absorbance changes at
500 nm and converted to concentration. The gray line represents the experimental data and the black line represents the theoretical fit. Solutions of 12 μM reduced rubredoxin were mixed (1:1) (v/v) with 12 μM oxidized SOR at 10ºC.
91
Figure III. 14 - Stopped-flow kinetics of the reduction of oxidized SORZn-Fe by
reduced rubredoxin. The variation was measured by the absorbance changes at 650 nm and converted to concentration. The gray line represents the experimental data and the black line represents the theoretical fit. Solutions of 25 μM reduced rubredoxin were mixed (1:1) (v/v) with 25 μM oxidized SOR at 10ºC.
92
Figure III. 15 - Comparison of stopped-flow kinetics of the reduction of oxidized
SORZn-Fe by reduced rubredoxin (A) and oxidized gray form of SORFe-Fe by
reduced rubredoxin (B). The variation was measured by the absorbance changes at 650 nm and converted to concentration.
93
Figure III. 16 – Rubredoxin oxidized by direct electron transfer to different
amounts of SOR. The experimental data are represented in gray dots for the gray form of SORFe-Fe; in pink for the pink form of SORFe-Fe and in blue for the
oxidized form of SORZn-Fe; the trend lines are the best fits for the experimental
data.
Figure III. 17 – Illustration of superoxide-mediated electron transfer assay.
Rubredoxin concentration was 15 μM and the SOR concentration ranged from 10 nM to 1 μM. All the assays were performed in 50 mM phosphate buffer pH 7.6 with 0.1 mM EDTA at 23 ºC. Sodium dithionite was used to perform the initial stoichiometric reduction of rubredoxin.
97
Figure III. 18 – Kinetic traces of superoxide-mediated electron transfer between
rubredoxin and the pink form of SORFe-Fe. The different traces represent
different amounts of SOR added, a) 0 μM; b) 0.04 μM; c) 0.08 μM; d) 0.2 μM and e) 0.4 μM. The assays were performed in 50 mM phosphate buffer pH 7.6 with 0.1 mM EDTA at 23ºC.
99
Figure III. 19 - Kinetic traces of superoxide-mediated electron transfer between
rubredoxin and the gray form of SORFe-Fe. The different traces represent
different amounts of SOR added, a) 0 μM; b) 0.08 μM; c) 0.2 μM; d) 0.4 μM and e) 1 μM. The assays were performed in 50 mM phosphate buffer pH 7.6 with 0.1 mM EDTA at 23ºC.
100
Figure III. 20 - Kinetic traces of superoxide-mediated electron transfer between
rubredoxin and the oxidized form of SORZn-Fe. The different traces represent
different amounts of SOR added, a) 0 μM; b) 0.02 μM; c) 0,2 μM; d) 0.6 μM and e) 1 μM. The assays were performed in 50 mM phosphate buffer pH 7.6 with 0.1 mM EDTA at 23ºC.
101
Figure III. 21 – Representation of rubredoxin oxidation rate by
superoxide-mediated electron transfer. The pink squares stand for the pink form of SORFe-Fe, gray triangles for the gray form of SORFe-Fe and blue dots for the
oxidized form of SORZn-Fe.
102
Figure III. 22 - Representation of rubredoxin oxidation rate by
superoxide-mediated electron transfer. The pink squares stand for the reduced SORFe-Fe,
and blue dots for the reduced SORZn-Fe.
103
Figure III. 23 – A) Mössbauer spectrum of the as-purified neelaredoxin recorded
at 4.5 K in the presence of a weak magnetic field of 600G parallel to the γ
radiation beam. B) Mössbauer spectrum of the as-purified neelaredoxin recorded at 4.5 K in the presence of a weak magnetic field of 600G perpendicular to the γ radiation beam. The solid lines represent the theoretical fits for the 47% of the reduced component of neelaredoxin.
Figure III. 24 – A) Mössbauer spectrum of the 53% oxidized component of
neelaredoxin recorded at 4.5 K in the presence of a weak magnetic field of 600 G parallel to the γ radiation beam. C) Mössbauer spectrum of the 53% oxidized component of neelaredoxin recorded at 4.5K in the presence of a weak magnetic field of 600 G perpendicular to the γ radiation beam. The solid lines B) and D) represent the theoretical fits for the oxidized component of neelaredoxin.
107
Figure III. 25 - Mössbauer spectrum of the as-purified neelaredoxin recorded at
200 K with no applied magnetic field. 109
Figure III. 26 – Mössbauer spectra of temperature dependence performed for
the dithionite reduced form of neelaredoxin. A) 4.5 K; B) 50 K; C) 100 K; D) 150 K; E) 200 K. The solid lines are fits of a single quadrupole doublet o the experimental data obtained for each temperature.
110
Figure III. 27 – Temperature dependence obtained for δ (gray squares) and ΔEQ
(black dots). The spectra of the dithionite reduced form of neelaredoxin were recorded between 4.5 K and 200 K, with no applied magnetic field.
111
Figure III. 28 – A) Superficial charge of Dv rubredoxin calculated by
Poisson-Boltzmann. B) Superficial charge of Dd SOR calculated by Poisson-Poisson-Boltzmann. The blue color stands for positive charges and the negative charges are represented by the red color. The calculations were performed using WebLab ViewerPro 3.7, molecular Simulations Inc. C) Top 50 docking solutions calculated for the interaction between rubredoxin and SOR, ranked according to the minimization of electrostatic repulsion energy upon formation of the complex. D) Top 50 docking solutions calculated for the interaction between rubredoxin and SOR, ranked according to the best side chain interaction upon formation of the complex. The rubredoxin molecules are represented by their geometric center only for clarification purposes. The calculations were performed using the Chemera 3.0 software (http://www.cqfb.fct.unl.pt/bioin/chemera/Chemera/Intro.html).
Chapter IV
Structural and mechanistic studies of metal incorporation in rubredoxin from Desulfovibrio gigas
Figure IV. 1 – UV-Vis spectrum of Dg rubredoxin apoprotein. 124
Figure IV. 2 – 2D Spectral evolution of a 1:1 mixture (v/v) of 30 μM ApoRd with
840 μM NiCl2, in 50 mM MES buffer pH 6.25. The arrow points the evolution of
the spectra with time.
126
Figure IV. 3 - 3D Spectral evolution of a 1:1 mixture (v/v) of 30 μM ApoRd with
840 μM NiCl2, in 50 mM MES buffer pH 6.25.
127
Figure IV. 4 – Kinetic trace of a 1:1 mixture (v/v) of 30 μM ApoRd with 840μM
NiCl2, in 50 mM MES buffer pH 6.25. The green line represents the theoretical
values obtained at this wavelength (459 nm). The inset represents the residuals for the fit of the overall data.
128
Figure IV. 5 – Metal concentration dependence for the calculated k’. The slope
of the trend line indicates the second order rate constant for the first step. 129
Figure IV. 6 – Species evolution with time of a 1:1 mixture (v/v) of 30 μM ApoRd
with 840 μM NiCl2, in 50 mM MES buffer pH 6.25. The concentration of the
species was determined using the calculated rate constants for this assay.
130
Figure IV. 7 - 2D Spectral evolution of a 1:1 mixture (v/v) of 30 μM ApoRd with
840 μM CoCl2, in 50 mM MES buffer pH 6.25.
131
Figure IV. 8 - 3D Spectral evolution of a 1:1 mixture (v/v) of 30 μM ApoRd with
840 μM CoCl2, in 50 mM MES buffer pH 6.25.
132
Figure IV. 9 - Kinetic trace of a 1:1 mixture (v/v) of 30 μM ApoRd with 840 μM
CoCl2, in 50 mM MES buffer pH 6.25. The green line represents the theoretical
values obtained at this wavelength (696 nm). The inset represents the residuals for the fit of the overall data.
133
Figure IV. 10 - Metal concentration dependence for the calculated k'. The slope
of the trend line indicates the second order rate constant for the first step. 134
Figure IV. 11 - Species evolution with time of a mixture 1:1 (v/v) of 30 μM
ApoRd with 840 μM CoCl2, in 50 mM MES buffer pH 6.25. The concentration of
the species was determined with the calculated rate constants for this assay.
Figure IV. 12 – Kinetic traces followed at 320 nm of several ratios of
protein/Fe2+ mixed 1:1 (v/v) in 50 mM MES buffer pH 6.25. The protein concentration was 30 μM and the iron varied from 0 to 700 μM; A) 0 μM, B) 175 μM, C) 263 μM, D) 350 μM, E) 467 μM and F) 700 μM.
136
Figure IV. 13 - Metal concentration dependence for the calculated k’. The slope
of the trend line indicates the second order rate constant for this step. 137
Figure IV. 14 – Mössbauer spectra of A) 700 μM 57Fe in 50 mM MES buffer,
pH 6.25 and B) 700 μM Dg rubredoxin reconstituted with 57Fe in the same buffer. The solid lines represent the best fits for the experimental data.
140
Figure IV. 15 – Mössbauer plot with the spectra obtained for the RFQ time
course. A) 10 ms; B) 16 ms; C) 80 ms; D) 125 ms; E) 500 ms; F) 5 s; G) 1 min 15 s; H) Intermediate 1; I) Intermediate 2; The overlapped solid lines represent the best fits to the experimental data.
141
Appendix A Methods
Figure A. 1 – Typical calibration curve obtained with the BSA standard for the
Lowry method. 154
Appendix B Equipment
Figure B. 1 – A) Scheme of Bio-Logic SFM300 module used for the
stopped-flow and rapid freeze-quench experiments. Adapted from [1]. B) Generic scheme of a rapid freeze -quench apparatus.
163
Figure B. 2 – A) Scheme of the Bio-Logic TC 100/10 cuvette, used for the
stopped-flow experiments. B) Vertical cut of the TC 100/10 cuvette. The dashed arrow represents the light path. Adapted from [1].
163
Figure B. 3 – Anaerobic stopped-flow apparatus (SFM-300 from Bio-Logic)
installed inside a UniLab glove box (from mBraun). The inset shows the custom made connectors designed to fit the equipment that is used for the anaerobic RFQ experiments.
Figure B. 4 – A) Weak field Mössbauer spectrometer installed in Chemistry
Department of Faculdade de Ciências e Tecnologia da Universidade Nova de Lisboa. B) Schematic figure of a Mössbauer spectrometer equipped with a CCR, adapted from[3].
167
Figure B. 5 – Generic scheme of the Gifford-McMahon principle used in
Tables Index Chapter II
Structural and mechanistic features of Ferritin from Desulfovibrio vulgaris Hildenborough
Table II. 1 - Mössbauer parameters of ferrous species, peroxodiferric species
and ferric species at weak magnetic field. 44
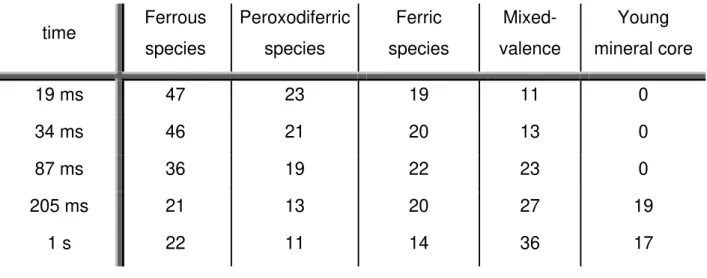
Table II. 2 - Mössbauer parameters of the mixed-valence species 44 Table II. 3 - Mössbauer percentage of the total Fe absorption of the different
species at various reaction times 45
Table II. 4 - Mössbauer parameters of ferrous and peroxodiferric species 48 Table II. 5 – Mössbauer percentage of the total Fe absorption of the different
species at various reaction times 49
Table II. 6 – Kinetic rate constants calculated from the fit of the stopped-flow
data 61
Table II. 7 – Extinction coefficient values published for different peroxodiferric
species[18]. The values for E130A are the ones obtained in this work. 64
Chapter III
Structural and mechanistic features of SORs from Desulfovibrio vulgaris Hildenborough and Desulfovibrio gigas
Table III. 1 – Plasma emission results obtained for the protein analysis 79 Table III. 2 – Second order rate constants of electron transfer between reduced
rubredoxin and SORs 94
Table III. 3 – Calculated stoichiometry for each rubredoxin/SOR pair 95 Table III. 4 – k’ values calculated for the superoxide-mediated electron transfer
between rubredoxin and the three SOR forms in study 102
Table III. 5 – k’ values calculated for the superoxide-mediated electron transfer
between rubredoxin and all SOR forms in study 104
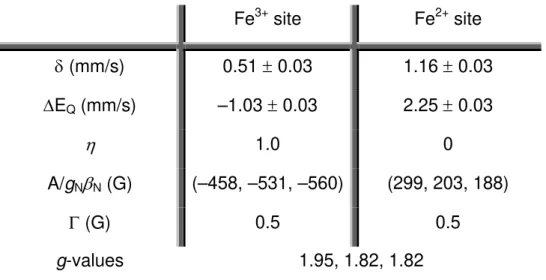
Table III. 6 – Parameters used to fit both components of Mössbauer spectra of
Chapter IV
Structural and mechanistic studies of metal incorporation in rubredoxin from Desulfovibrio gigas
Table IV. 1 – Values of the rate constants obtained for the metal incorporation in
the ApoRd 138
Table IV. 2 – Parameters used to fit the Mössbauer spectra of the samples
obtained in the rapid freeze-quench experiment. 142
Table IV. 3 – Percentage for species of table IV.2 in each sample studied 142
Appendix A Methods
Table A. 1 - Volumes used for transformation 150
Table A. 2 – Volumes of each solution used for the SDS-PAGE gel
electrophoresis. 151
Table A. 3 – Stock solutions used for the SDS-PAGE gel electrophoresis 152
Table A. 4 - Solutions used for Lowry method 153
Table A. 5 – Reagents used for LB medium preparation 155
Table A. 6 – Solutions used to supplement the M9 medium. 156
Table A. 7 - Reagents used for M9 medium preparation 157
Table A. 8 - Reagents used for SOC medium preparation 157
Table A. 4 – Volumes of HCl 37% (w/v) added to obtain the desired pH value 158 Table A. 5 – Volume ratios used to obtain a 1 M solution of phosphate buffer at
Index
Chapter I Introduction
I.1 – Biological Mechanisms of Oxygen Activation 3
I.1.1 – Heme monooxygenases 4
I.1.2 – Non-Heme monooxygenases 12
I.1.3 – Bacterial Ferritins 15
I.2 – Detoxification of Reaction Oxygen Species 18
I.2.1 – Superoxide Reductases 18
I.2.2 – SOR Electron Donor, Rubredoxin 23
I. – Introduction
Life, as we know it, is supported by several chemical elements. Two of them, iron and oxygen, are essential for all organisms. Despite that, iron and oxygen metabolisms are yet to be fully understood. This thesis aims to gather further understanding of iron and oxygen interplay in biology and reveal details related to iron and oxygen toxicity.
The first chapter of this thesis provides a brief description of several concepts important for the understanding of the presented work.
I.1 – Biological Mechanisms of Oxygen Activation
Oxygen was discovered in 1774 by the British chemist Joseph Priestley and, independently, by the Swedish pharmacist Carl Wilhelm Scheele. Scheele had produced oxygen gas by heating mercuric oxide and various nitrates. He called the gas “fire air” because it was the only known supporter of combustion[1, 2].
About the same time, the French chemist Antoine Laurent Lavoisier claimed the discovery of the new substance. However, Priestley visited Lavoisier in October 1774 and told him about his experiment and how he liberated the new gas. Scheele also posted a letter to Lavoisier on September 30, 1774 that described his own discovery of the previously-unknown substance, but Lavoisier never acknowledged receiving it (a copy of the letter was found in Scheele's belongings after his death)[2].
What Lavoisier undoubtedly did was to conduct the first adequate quantitative experiments on oxidation and give the first correct explanation of how combustion works.
Molecular oxygen also plays a key role in Nature as a powerful oxidant, reducing itself into species such as water or hydrogen peroxide. Although the oxidation of almost all biological molecules is a thermodynamically favorable process, it doesn’t occur spontaneously. This is due to the fact that, in its ground state, O2 is a triplet
while most of reactants are singlets leading to spin forbidden processes. Thus, reactions between molecular oxygen and other molecules should be kinetically unfavorable, requiring a large activation energy[3, 4]. Over the years, Nature overcame this problem by using transition metals for pairing electrons. This process is called “oxygen activation”.
This complementarity enables oxygen to participate in biological cycles but can lead also to the formation of reactive oxygen species (ROS). This behavior requires a large protection mechanism in order to overcome the possible lethal effects of the reactive species formed.
Thus, if we look inside a cell we will see a complementary system that involves groups of enzymes that use O2 for catalysis and another group that eliminates the
excess of hazardous metabolites formed.
In this subject several enzymes will be described. Since the main goal is to give introductory remarks on mechanisms of oxygen activation and ROS detoxification, only bacterial ferritin and superoxide reductases (SOR) will be described with detail. The description of all the other mentioned proteins will serve only as an overview/review of oxygen activation and as a guide to understand both ferritin and SOR unanswered questions, and will be based only in recently published reviews.
I.1.1 – Heme monooxygenases
Peroxidases
Peroxidases were the first enzymes in which high-valent iron intermediates were detected[5, 6]. These enzymes promote peroxides heterolysis, mainly hydrogen peroxide, in order to obtain a potent oxidizing agent used to react with the substrate.
Heterolysis is a two electron process where an oxidized intermediate is formed,
compound I, which is a ferryl heme complex (Fe4+=O)[3, 6]. Depending on the
organism, the second oxidizing equivalent can be stored either on the porphyrin ring as a porphyrin π–cation radical or on a tryptophan residue[6].
On the other hand, there are other peroxidases such as cytochrome c peroxidases (CcP) (EC 1.11.1.5), isolated from organisms like Pseudomonas stutzeri, that are able to reduce hydrogen peroxide to water. Formation of high-valent species such as a ferryl intermediate (Fe4+=O) also occurs in these type peroxidases[7].
Due to the relatively long half-life of peroxidases intermediate species and their similarities with the ones found in monooxygenases, they are commonly used as model for extrapolation.
Cytochrome c Oxidase
Cytochrome c Oxidase (CcO) (EC 1.9.3.1) is a membrane bound metalloprotein, involved in the respiratory chains of mitochondria and aerobic bacteria. It catalyzes
the 4e-/4H+ reduction of O2 to H2O without the formation of ROS as shown in Eq.
I.1[8, 9].
4CcO2+ + 8Hin +
+ O2 4CcO 3+
+ 4Hout +
+ 2H2O Eq.I. 1
Figure I. 1 – Schematic representation of CcO function. The blue arrows represent
the O2 reduction to water. The red arrows represent the proton translocation coupled
to the enzymatic activity. Adapted from [10].
Despite the biological importance of the mechanism of proton translocation, this subject will focus only on the oxygen activation mechanism performed by this enzyme.
CcO has two subunits, one inside of the membrane, where one CuB atom, one
heme a and one heme a3 (myoglobin-type iron center) is located. The 3D structures
demonstrate that the O2 activation site is formed by the CuB and heme a3 [8, 12].
The characterization of the enzymatic mechanism has been described essentially by Resonance Raman spectroscopy coupled with X-ray data, pointing to a first
heme a
cytochrome c
intermediate formed between O2 and Fea3 2+
, Fe2+-O2. The Cu 1+
B interaction is thought
to be weak due to the trigonal planar geometry[13].
The next step involves a conformational change consistent with the formation of a
hydrogen bond between a tyrosine (Tyr) residue and the Fe2+-O2 site, giving rise to a
hydroperoxy state Fe3+-O-OH. The covalent bond between the tyrosine and the histidine coordinated to CuB provides an effective electron transfer pathway from CuB
to the OH group of tyrosine[12, 13].
The reaction follows with the appearance of a ferryl intermediate, Fe4+=O2, formed
via two electron reduction. One electron is provided by Fea33+, which is converted to
Fea34+, and the other electron from Tyr-O- which is converted to a Tyr radical. This
third intermediate is finally converted into a ferric Fe3+-OH- (figure I.2)[8, 12, 13].
In order to clarify and thus provide additional data related with the CcO O2 activation
mechanism, several studies have been performed[8, 14].
Figure I. 2 – Schematic representation of CcO enzymatic mechanism. Adapted
from[12].
O2
4 e
Nitric Oxide Synthase
Nitric Oxide Synthase (NOS) (EC 1.14.13.39) is one of the most complex enzymes involved in oxygen activation. This is probably due to the fact that this enzyme is related to the production of a vital molecule in mammals, NO. Depending on the location, the NO produced is not only used as second messenger by activation of soluble guanylyl cyclase in the cardiovascular and nervous systems, but also as a cytotoxic agent in the immune system[15].
NOS produce NO from L-arginine in the presence of O2 and NADPH. The enzymatic
mechanism is very similar to other heme monooxygenases, exception being the presence of another redox cofactor called tetrahydrobiopterin, H4B, and a regulatory
protein, calmodulin (CaM)[12, 15].
The redox cofactor H4B is thought to have a main function which is related to the high
rigidity of NOS structure, which leads to the exposure of the catalytic site to solvent
that would cause the formation of Fe3+OOH-. This species, in turn, could be subjected to uncoupling by the solvent, with possible release of H2O2. Therefore, a fast and
coupled proton-electron transfer system is needed to ensure the formation of Fe3+-OOH2[16].
Besides the structural complexity of this enzyme compared to other heme monooxygenases, there is an additional issue for the overall mechanism. The final product, NO, is a heme diatomic ligand, like O2, which leads NOS to feedback
inhibition[15].
NOS mechanism presents a resting state Fe3+/H
4B, which is reduced to Fe2+/H4B to
be able to bind O2. The oxygen binding will set up an equilibrium between the
(Fe2+-O2)/H4B and (Fe3+-O2
-)/H4B forms. The iron-oxygen complex is then reduced by
H4B, forming (Fe3+-O2
2-)/H4B +
. It is assumed that the next step involves the
consecutive addition of two protons for O-O bond cleavage, giving (Fe3+-O-O-H
2)/H4B, resulting in a Fe3+-O or its electronic equivalent Fe4+=O state.
Figure I. 3 - Schematic representation of NOS enzymatic mechanism. Adapted
from[12].
P450
Cytochrome P450 is probably the most recognized of all heme monooxygenases. This is probably due to its presence in a large number of organisms from bacteria to humans. P450s are able to catalyze the hydroxylation and epoxidation of a wide range of organic compounds. These enzymes are involved in several metabolisms, like sexual hormones, vitamin D, bile acids, drugs and xenobiotics, among others. They are so important for the overall metabolism that one single organism can contain several dozens of different P450s. For instance a small flowering plant, Arabidopsis, has 273 sequences in the genome that codify to P450s (or homologues)[17].
One of the interesting features of this enzyme is its 3D structure. Contrary to NOS, P450 presents structural changes depending on the presence of substrate. These changes can be related to the control of enzyme activity. Like in NOS, it is important
to prevent the exposure to solvent and the consequent Fe3+-OOH- uncoupling, with formation of hydrogen peroxide[16].
e- + O2
e- + O 2
L-citrulline + NO.
e- OH
From the catalytic point of view P450, is not so different from other heme
monooxygenases like NOS. The catalytic cycle begins with a low-spin Fe3+ heme, coordinated to a water molecule. This water molecule will be displaced by the
substrate turning it into a high-spin Fe3+ heme. The following step comprises a one electron reduction coupled to the oxygenation process, forming the oxy intermediate
Fe3+-O2
-. A second electron will generate the peroxy species Fe3+-O2
2-. The capture
of two protons will drive the O-O cleavage via hydroperoxy (Fe3+-O-O-H-) and
dihydroperoxy (Fe3+-O-O-H2) leading to the formation of the ferryl intermediate
(Fe4+=O) the so called compound I (named due to the similarity to peroxidases’
reaction intermediates)[3, 16-18].
Figure I. 4 – Schematic representation of cytochrome P450 catalytic cycle. Adapted
For the past few years, the scientific community has performed several studies in order to isolate and characterize the catalytic intermediates. However, contrary to the results obtained for peroxidases, only the first intermediates could be trapped. This may mean that some steps, such as the addition of the second proton, occur too fast (little stability of the formed species), in the experimental timescale, and can only be assumed by comparison to similar mechanisms like peroxidases or based on density functional theory (DFT) calculations[16, 17].
From the examples given it is possible to conclude that oxygen activation processes will, in principle, undergo several intermediates like, oxy, peroxy, hydroperoxy, dihydroperoxy and ferryl.
Most of the studies performed, concern the understanding of electron pathways and proton delivery. These are the main steps for the heterolytic cleavage of O-O bond and subsequent formation of the ferryl species (active), which consists of an O atom with six valence electrons, a strong oxidant. Another important aspect is the uncoupling reaction, which can be promoted by the inappropriate protonation of the hydroperoxy species, leading to H2O2 release.
I.1.2 – Non-Heme monooxygenases
Like heme monooxygenases, non-heme monooxygenases are also involved in a variety of reactions that use molecular oxygen to metabolize a wide range of compounds. However, the fact that they have a binuclear iron center as cofactor instead of an heme group, make them a unique case study in terms of both spectroscopic and biochemical characterization.
Methane Monooxygenases
Soluble Methane Monooxygenases (sMMO) (EC 1.14.13.25) belong to a large group of bacterial oxygenases that are responsible for the oxidation of the highly stable methane molecule to methanol in a NADH-dependent reaction[19].
Like other non-heme oxygenases, sMMOs have been described as a multicomponent class of enzymes. Structural analysis shows that sMMO has 3 components, a hydroxylase subunit (MMOH), a reductase subunit (MMOR) and a regulatory protein subunit (MMOB)[19, 20].
The active site is composed of a carboxylate-bridge diiron center located at the MMOH component. The MMOR subunit transfers electrons from NADH through its FAD and [2Fe-2S] cofactors to the active site. MMOB is a small α/β protein related to putidaredoxin both in structure and genetics. Despite its function not being yet well understood, some studies point to its role in electron transfer and in substrate binding during catalysis[19, 20].
The catalytic cycle begins with a two-electron reduction of the diferric center with generation of the reactive all ferrous state. The existent oxo/hydroxo bridges are lost, presumably, by protonation upon reduction. The ferrous diiron species reacts rapidly
with molecular oxygen to form a peroxodiferric (Fe3+-O-O-Fe3+). This first
intermediate decays into a higher-valent species Q (Fe4+(μ-O2)Fe 4+
), similar to X species in ribonucleotide reductase R2 (RNR-R2). Both peroxodiferric and Q species are reactive with substrates, in a manner similar to the one observed in cytochrome P450[21, 22].
Studies with several substrates were performed in order to compare the reactivity of both intermediates. The results showed that the difference between these two species was related to the type of substrate used, since they have different ways to metabolize substrates. The peroxodiferric species reacts preferentially by two-electron or hydride abstraction, whereas the Q species follows one-two-electron oxidation[20, 21]. In order to understand the biochemical and spectroscopic characteristics of these systems, several synthetic compounds were used[20, 23].
Figure I. 5 – Schematic representation of sMMO catalytic cycle. Adapted from [6, 24,
25].
2 e- O2
H2O
Rieske Oxygenases
Rieske Oxygenases (RO) (EC 1.14.12.18) are part of the same group of bacterial oxygenases as sMMO, and are responsible for the generation of cis-dihydroxylated metabolites, the first step in bacterial degradation of many aromatic compounds[26].
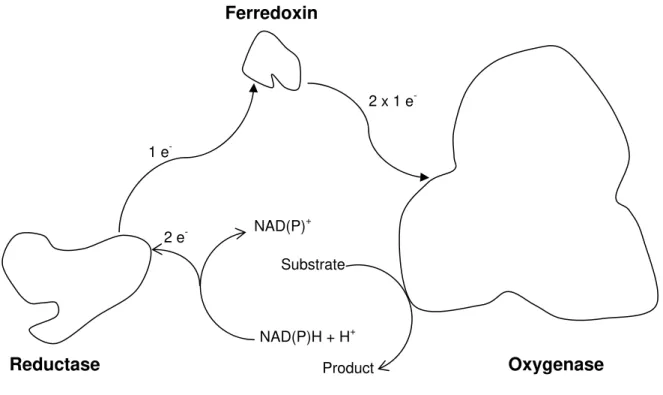
Like sMMOs, the ROs are multicomponent enzymes, formed usually by three components that use molecular oxygen for catalysis. They are similar to the ones found in sMMO, an oxygenase component, a reductase component and a ferredoxin component. The difference is the existence of a Rieske cluster located in the oxygenase component which is responsible for the main differences between the catalytic cycle of sMMO and RO. These are related with the electron transfer between the reductase and hydroxylase components[24, 26, 27].
Figure I. 6 – Schematic representation of the three components of a Rieske
Oxygenase system. Adapted from [26].
Ferredoxin
Oxygenase Reductase
NAD(P)+
NAD(P)H + H+ Substrate
Product 2 e
-1 e
-I.1.3 – Bacterial Ferritins
In the beginning of this chapter, the relationship between iron and oxygen was mentioned and some examples of enzymes that use molecular oxygen to perform their catalysis have been described.
In the examples mentioned above, iron was part of the catalytic site of the protein. There is, however, a class of enzymes that uses iron not only to build the catalytic site but also as one of the substrates for catalysis (the other being molecular oxygen). These enzymes are called ferritins.
Ferritins are large spherical protein cages (10-12 nm) that, depending on the type, can have 24 (maxi-ferritin) or 12 (mini-ferritin) subunits. Each subunit has about 20 kDa and is composed by four-helixes bundles with a fifth short helix in the C-terminal region. Depending on the organism (and sometimes the organ), ferritin can be either a homo or heteropolymer. In mammals for example, ferritin can appear with different proportions of H-chain and L-chain while in bacteria it will appear mostly as a homopolymer of H-chain homologue[28, 29]. The difference between these two chains is related to the presence of conserved binuclear iron site, known as ferroxidase center, responsible for the catalysis in the H-chain[30].
Ferritins are present in almost all living organisms, from humans to anaerobic bacteria. The absence of these proteins is incompatible with life in animals and very harmful for bacteria (increasing their oxygen sensitivity)[31-35]. This ability to protect the organism is related to ferritin’s catalytic mechanism.
Ferritins can use either molecular oxygen (for the majority of maxi-ferritins) or hydrogen peroxide (for the majority of mini-ferritins) as a co-substrate for iron storage. Iron storage capacity is particularly important if we consider that only Fe2+ is moderately soluble (10-4 M) in aqueous solutions at pH 7, while Fe3+ is extremely insoluble (10-18 M)[36, 37]. As such, ferritin becomes fundamental for cells both as an
Figure I. 7 - A) 3D Structure of 24-mer FtnA from Escherichia coli (PDB Id. 1EUM).
2.05 Å resolution (Stillman, T.J., [41]). B) Subunit of the FtnA from Escherichia coli.
From the mechanistic point of view, bacterial ferritins are similar to the previously described proteins involved in oxygen activation, presenting catalytic intermediates with comparable spectroscopic behaviour.
According to the published reports, iron oxidation proceeds via the formation of an
μ-1,2-peroxodiferric intermediate, with a characteristic blue colour (with maximum
absorption near 600 nm)[42-44]. This species will decay to a more stable
μ-1,2-oxodiferric species with the concomitant release of hydrogen peroxide. The amount of hydrogen peroxide produced is not always stoichiometric in relation to the amount of oxo intermediate produced[45, 46]. Mössbauer studies revealed that this
μ-1,2-oxodiferric species will decay spontaneously to a μ-1,2-hydroxo-bridged dimer[47]. The formation of the mineral core would be the last step.
Like in some monooxygenases such as RNR-R2, in ferritin it was also reported the formation of a tyrosyl radical during the ferroxidatic process[48-55].
Regarding the stoichiometry, these reactions show in general a 2:1 ratio between the iron and oxygen where two electrons from the iron oxidation will reduce the oxygen to hydrogen peroxide[56, 57]. However, the presence of a third site (site C) in some bacterial ferritins, like FtnA from E. coli, introduced some complexity to the mechanism, and so, in this cases a 3-4:1 iron-oxygen ratio is observed[58]. The possibility of a 4:1 stoichiometry instead of 3:1 that would be expected in this particular case can be related to the presence of a fourth iron binding site or an active amino acid residue. In this case, the oxygen would be reduced to water rather than to hydrogen peroxide.
Figure I. 8 - Generic scheme of ferritin catalytic cycle. Adapted from [42-45]. Ferritin
Ferritin-2Fe2+
Peroxodiferric species Oxodiferric species
Hydroxodiferric species Mineral core
2Fe2+
O2
I.2 – Detoxification of Reactive Oxygen Species
As mentioned in the beginning of this chapter, there is a complementarity between the enzymes that use oxygen for catalysis like ferritins and the enzymes that metabolize the ROS formed in the oxygen activation reactions.
ROS can be divided in two groups, radical (superoxide, hydroxyl, peroxyl, alkoxyl and hydroperoxyl) and nonradical (hydrogen peroxide, ozone, singlet oxygen, peroxynitrite and hypochlorous acid). When in excess, these species are usually involved in cellular destruction by different mechanisms like lipid oxidation and DNA and amino acid damage[59-64]. This thesis will focus on the superoxide degradation by SORs.
Superoxide radical can be generated by different sources through a variety of mechanisms. In an aqueous solution, at pH 7.0, superoxide will dismutate into hydrogen peroxide and O2 with a very high rate constant, about 5 x 10⁵ M-1.s-1. Thus,
once generated, superoxide can be harmful to the cell both directly, and indirectly via the formation of hydrogen peroxide[65, 66].
I.2.1 – Superoxide Reductases
Since the beginning of the 90’s several unusual non-heme iron proteins have been isolated and characterized [67-76]. Although the function of these proteins was partially unveiled in 1996 when Touati and coworkers reported that a protein from Desulfovibrio baarsii suppressed all the effects caused by the absence of superoxide dismutase (SOD) (EC 1.15.1.1) in E. coli, only in 1999 the real function of these
O2- + 2H+ + e- H2O2 (SOR) Eq.I.2
2O2- + 2H+ O2 + H2O2 (SOD) Eq.I.3
This ability has an enormous biological relevance if we consider that the major part of these SOR proteins were first purified from anaerobes, thus enabling them to survive when exposed to small amounts of oxygen[81].
SORs are usually divided in three classes according to both the number of iron centers (1Fe-SOR and 2Fe-SOR) and the presence in their primary structure of an N-terminal domain[82].
Class I SORs, historically called desulfoferrodoxins, were first isolated by Moura and coworkers and are characterized by the presence of two iron centers. Center I is very similar to the one found in desulforedoxin isolated from D. gigas (one iron atom coordinated by four cysteine residues) and center II (one iron atom coordinated by four histidine residues in the equatorial plane and one cysteine in the axial plane) [68, 70, 83, 84]. These class I SORs can attain three different oxidation states: fully-reduced (colorless, with both centers in the ferrous state), half-fully-reduced (“pink” form, due to the oxidized center I and reduced center II) and fully-oxidized (“gray” form, due to the both oxidized center I and II).
In the pink form the protein exhibits spectroscopic features of a high-spin ferric ion (S=5/2) with absorption maxima at 495, 368 and 279 nm. The EPR spectrum shows resonances at g=7.7, 5.7, 4.1 and 1.8 with E/D = 0.08, while the Mössbauer spectroscopy characterization indicates the presence of two high-spin iron centers, one ferric and one ferrous. The gray form shows additional absorption bands at 335 and 635 nm and the EPR spectrum has additional resonances at g = 4.3 and 9.6. The Mössbauer spectrum reveals another component characteristic of a high-spin ferric ion with E/D = 1/3 [70, 85, 86].
Contrary to class I and II, which were only found in anaerobic or microaerotolerant bacteria, a new class of SOR was isolated from a microaerophilic organism, the syphilis spirochete Treponema pallidum[69, 74, 87]. This new class, class III, is spectroscopicaly similar to class II, presenting only one iron center coordinated by four histidine residues in the equatorial plane and one cysteine residue in the axial plane. Gene sequence analysis showed that the gene product should be a 14 kDa protein with two domains, homologous to class I SOR. However, in this protein, three of the four cysteine residues of center I were not present. The crystal structure of this class III SOR shows a homodimeric protein, very similar to the structure obtained for class I SOR despite possessing only iron center[88].
Figure I. 9 – A) 3D Structure of SOR from Desulfovibrio desulfuricans ATCC 27774
(PDB Id. 1DFX). 1.9 Å resolution (Coelho et al., [89]). B) Scheme of SOR’s center I. C) Scheme of SOR’s center II. The dark orange spheres represent the iron atom and the blue sphere represents the calcium atom.
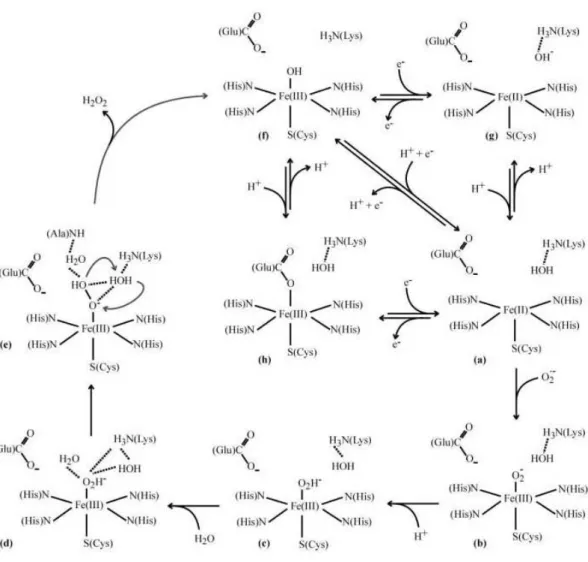
This ferric state can have either a hydroxide or a glutamate as the sixth ligand in a pH dependent equilibrium (high pH values favor the hydroxide binding). After substrate binding to the ferrous site a ferric peroxo species is formed with a rate constant close to 109 M-1.s-1. The presence of a second intermediate species is currently under
discussion, since some authors claim that the direct protonation of the ferric-peroxo species yields the final product, while others suggest the formation of a hydroperoxo species in a process dependent on the proton concentration of the solvent[90-93].
A) B)
Figure I. 10 – Schematic representation of a proposed catalytic mechanism of SOR
considering the following forms: (a) ferrous active state; (b) ferric peroxo intermediate; (c) ferric hydroperoxo intermediate; (d) an extra water molecule is recruited; (e) rearrangement leading to protonation; (f) ferric hydroxyl-bound resting state and (h) ferric carboxylate-bound resting state. Adapted from [82].
The protonation of this second intermediate leads to the formation of the product, hydrogen peroxide.
electron transfer. The reduction via center I could be an important way to prevent the formation of a glutamate-coordinated species[94].
On the other hand, there are evidences that prove that it is possible to reduce superoxide without the involvement of center I, like in the C13S mutant from D. vulgaris strain Hildenborough SOR. The resulting protein (lacking center I) revealed catalytic properties similar to the wild type protein[95]. Thus, this result could eliminate the biological relevance of center I. This subject will be studied and discussed later on in this thesis.
I.2.2 – SOR Electron Donor, Rubredoxin
Rubredoxins (Rd) are small (in average, just over 50 amino acids residues), monomeric, non-heme iron proteins with approximately 6 kDa molecular mass[96, 97]. These proteins contain a single iron center, coordinated by four cysteine residues very similar to the center I in the SORs[98-101].
Rds were first isolated from Clostridium pasteurianum by Lovenberg and coworkers more than forty years ago. Since then several other rubredoxins have been isolated and characterized both structurally and spectroscopically[96, 101-104]. A large number of X-Ray crystal structures can be found in the Protein Data Bank (PDB).
Rubredoxins are often associated with electron transfer processes in biological systems, working as an electron donor to proteins in many different pathways, like cellular detoxification[96, 105, 106]. Several electron transfer studies between rubredoxin and SORs were recently published[94, 107-109].
In the work presented in this thesis two different recombinant rubredoxins (from D. vulgaris Hildenborough and D. gigas) will be used. The first will be used as an electron donor to the D. vulgaris Hildenborough SOR. These studies will be based on rubredoxin’s ability to reduce SOR[82, 94, 107-109].
both metallochaperones and inorganic sulfide (or other cofactors) may indicate that rubredoxin doesn’t need specialized machinery to incorporate iron during its expression[97]. This information, combined with the previously published work concerning rubredoxin stability, makes it a perfect probe for understanding, from a biological point of view, the metal incorporation in these type of metallic centers[110, 111].
Figure I. 11 – A) 3D Structure of rubredoxin from Desulfovibrio vulgaris strain
Hildenborough (PDB Id. 1RB9). 0.92 Å resolution. (Dauter Z., et al.). B) Schematic representation of rubredoxin’s iron center. Iron atom coordinated by the four cysteine residues. The dark orange spheres represent the iron atom.
Recent studies also point to a flexible structure of apo rubredoxin which folds into the “native” structure upon the incorporation of iron. These studies also show that the metal incorporation follows a number of steps that are dependent from the iron binding to the protein. This incorporation is also dependent on the use of high concentrations of denaturating agents such as urea and guanidine hydrochloride[97].
![Figure I. 5 – Schematic representation of sMMO catalytic cycle. Adapted from [6, 24, 25]](https://thumb-eu.123doks.com/thumbv2/123dok_br/16536229.736538/43.892.128.837.698.941/figure-i-schematic-representation-smmo-catalytic-cycle-adapted.webp)