Universidade da Beira Interior Departamento de Ciências Aeroespaciais
Master Thesis
Experimental Study of
Twin Air Impinging Jets
Student:
Pedro M. S. Meireles
Supervisors:
Prof. Doutor Jorge M. M. Barata
Prof. Doutor André R. R. Silva
iii
Universidade da Beira Interior Departamento de Ciências Aeroespaciais
Master Thesis
Experimental Study of
Twin Air Impinging Jets
Pedro M. S. Meireles
Master Student of Aeronautical Engineering
iv
v
Abstract
This work is devoted to the visualization and characterization of twin air jet flow when impinging vertically to a solid surface, which is important to understand the phenomenon relevant to Vertical/Short Take-Of and Landing (V/STOL) type of aircraft when they are operating on short distances from the ground, landing or taking-off, and could be helpful to improve the performance and stability of this kind of aircrafts. The major concern of this work is characterizing the fountain upwash region, which is a distinctive fan-shape flow that is formed on the collision region. The parameters analysed on this work are the separation distance between the jets and the jet height. Have been observed significant changes in the flow pattern and properties in the fountain upwash region due to the changes in the parameter studied.
To be possible the realization of this work an experimental facility has been built. The facility supports an adjustable mechanical system which can accommodate twin stainless steel barrels with different diameters, which are the jets. Within this mechanical system, the barrels horizontal distance and height can be independently adjusted. The working fluid is the air, and to be possible the flow visualization a seeding generator have been projected and built. The flow visualization has been supported by an algorithm developed on the “Image Processing toolbox of Matlab” software, where have been made the post processing of the images.
vi
Resumo
Este trabalho baseia-se na visualização e caracterização do escoamento desenvolvido por dois jactos paralelos e verticalmente disposto em relação a uma superfície sólida. Estes fenómenos estão associados com aeronaves de descolagem e aterragem vertical ou curta (V/STOL – vertical/short take-of and landing). Particularmente, interessa a caracterização da região conhecida como “fountain upwash”, que é uma forma característica do escoamento que se forma na região da colisão. Os parâmetros analisados neste trabalho foram a distância horizontal entre os jactos e a altura destes à superfície de impacto. Foram observados diferenças significativas no padrão e propriedades do escoamento na região de “fountain upwash” devido à variação dos parâmetros em estudo.
Para a realização deste estudo foi construída uma instalação experimental. A instalação é ajustável mecanicamente, contendo dois tubos de aço, com diâmetro variável. O sistema mecânico permite o ajustamento, independentemente, a distância horizontal entre os jactos e a altura dos mesmos. Como neste trabalho se vai trabalhar com ar, para ser possível visualizar o escoamento é necessário marcar o escoamento. Nesse sentido foi desenvolvido um gerador de “seeding”. Para uma melhor e mais precisa visualização do escoamento foi desenvolvido um algoritmo no “Matlab” usando “Image Processing toolbox”, onde as imagens captadas foram pós processadas.
vii
Acknowledgment
Alone this work was not possible to do, have been many people that help, with his work, dedication patience or just a friendly word.
I would like to take this opportunity to express my thanks and appreciation to my supervisors Professor Doctor Jorge Manuel Martins Barata and Professor André Resende Rodrigues Silva, for their support guidance, encouragement and for all i learned with them.
I want to express my thanks to the “Departamento de Ciencias Aeroespaciais da Universidade da Beira Interior”, especially to laboratory technician Rui Paulo for his help and contribution in the construction of the experimental facility.
Thanks to my friends and colleagues who have made the last years spatial and for the support and good moments.
The last but not the least, i am very great full by the support and encouragement of the people that are always there on the best and warts days: Armando, Manuela, Adelaide, Susana, Eduarda, Germano, João, Fátima, Sónia, and for sure you Patrícia.
viii
Contents
Abstract ... v Resumo ... vi Acknowledgment ... vii Contents ... viii List of Figures ... ix List of Tables ... x List of Symbols ... xi 1 Introduction ... 1 1.1. Bibliographic revision ... 1 1.2. Research Objectives ... 3 1.3. Organization ... 3 2 Research methodology ... 4 2.1 Test Facility ... 5 2.2 Seeding Generator ... 5 2.2.1. Vaporizer ... 62.2.2. Smoke machine connected to the reservoir ... 7
2.3 Method and Calibration ... 7
2.3.1. Configuration ... 7
2.3.2. Flow visualization... 11
2.3.3. Image acquisition system... 12
3 Results ... 15
4 Conclusions ... 23
5 Future works ... 24
ix
List of Figures
Figure 1: Schematic of flow formed by two impinging jets.. ... 2 Figure 2: Test facility ... 4 Figure 3: Diagram of the experimental installation initially implemented. ... 5 Figure 4: Views of the vaporizer system ... 6 Figure 5: Diagram of the experimental installation finally implemented. ... 7 Figure 6: Velocity profile ... 9 Figure 7: Laser illumination. ... 11 Figure 8: Post‐processing evolution. ... 12 Figure 9: final image after the post‐processing ... 13 Figure 10: Final image. ... 14 Figure 11: Fountain upwash for each case in study ... 16 Figure 12: Fountain’s upwash height variation for height constant and distance variable.. ... 17 Figure 13: Fountain’s upwash height variation for height variable and distance constant.. ... 18 Figure 14: Fountain upwash length variation for height constant and distance variable.. ... 19 Figure 15: Fountain upwash length variation for height variable and distance constant.. ... 20x
List of Tables
Table 1: Calculation of Reynolds number from Sousa (9) ... 8 Table 2: Calculated pressure to ensure the dimensional similarity between water and air tests ... 9 Table 3: Velocity profile for pressure on entrance is 2,4 Bar ... 10 Table 4: Distances S/d and H/d utilized ... 10 Table 5: Height and length of the fountain upwash ... 22xi
List of Symbols
Roman Numbers A Area 1 H/d=4 A S/d=10 2 H/d=8 B S /d=12 3 H/d=12 C S /d=24 4 H/d=24d Diameter of the jet 5 H/d=48
D S /d=48
H Impinging height
mji Jet momenta
Mass flow
M Mass P Pressure
R Gas constant
Re Reynolds number
S Distance between jets T Temperature
V Absolute velocity
Greek
Ratio of specific heat
Dynamic viscosity
Density Subscripts
J Jet Abbreviations
NPR Nozzle pressure ratio
mwc Meter water column
VTOL Vertical Take Off and Landing
S/VTOL Short/Vertical Take Off and Landing IGE In Ground Effect
Experimental Study of Twin Air Impinging Jets
2008/2009
1
1
Introduction
1.1. Bibliographic revision
On this section is made a bibliographic revision on the works made about S/VTOL aircrafts. Is given more emphasis on the impinging jets, and in particular on the fountain upwash flow region, because the basic data are severely limited on this area (1).
On the S/VTOL aircrafts the propulsive jets can alter significantly the flowfield under the aircraft, these effects generally change the lift forces on the aircraft, cause an increase in the exhaust gas ingestion by the inlets, and raise fuselage skin temperatures (2).
Barche (3) have classified the jet interaction in three kinds of effects: Primary jet interaction, Secondary jet force interaction and the recirculation effects.
Primary jet force interaction, that are the direct actions of the jet momentum on solid surfaces; Secondary jet force interaction, that is defined as interference effects due to the jet induced flow field as a consequence of the jet entrainment, blockage and wake actions;
Recirculation effects that are defined as consequences of the temperature field generated by a jet. The study of the secondary jet force interaction is important in the design of VTOL aircraft. For Barche (3) the VTOL jets are understood as the combination of free jets, wall jets and jet fountain. Barche also define the properties of such jets by sucking action of free and especially wall jets; displacement of blockage effect; and wake effect.
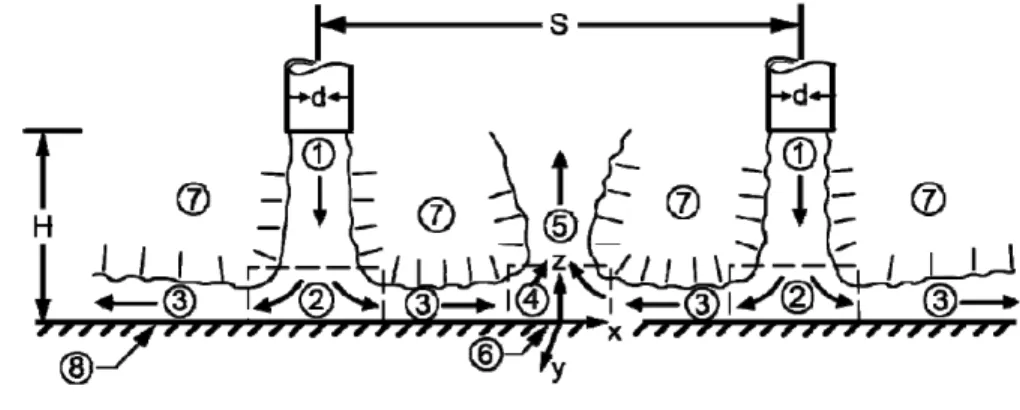
The figure 1 shows the important characteristics of the jet impingement flow. Saripalli (4) have observed that the fountain upwash (number 5 on the figure 1) is produced by the colliding wall jets and the entrainment (number 7 on the figure 1) of the ambient air into different regions of the flow. For equal jet diameters and jet momenta the fountain is located midway between the nozzles, moves upward and spreads spatially by the entraining the surrounding fluid.
Experimental Study of Twin Air Impinging Jets
2008/2009
2
Figure 1: Schematic of flow formed by two impinging jets: 1. free jet flow, 2. jet impingement region, 3. wall jet region, 4. fountain formation, 5. fountain upwash flow, 6. wall jet interaction stagnation line, 7. entrainment, 8.ground plane
(Saripalli 1987).
The distance between the jets, the momentum ratio, and the height of the jets will change flowfield on the impinging region. Saripalli (4; 2) have change the ratio S/d, and reported that the strength of the interaction increase with the decreasing of distance between jets because the entrainment requirements of the fountain and the free jet inward. As the height of the jets is increased the strength of the fountain also decreases (2). The interaction the twin jets can be categorized into three different types (5): far-distance impinging jets; distant impinging jets; adjacent impinging jets, depending on the distance between them. When the jets are far distance, the jump-profile remains almost unaltered. On the reduction of the intermediate distance, the individual jumps starts exhibiting non-circular profiles with clear stagnation line demarcating the flows emerging from each of the jets. This is a straight line in case of equal jets and a curved one for unequal jets. When the spacing between the jets is below a critical value, an upwash fountain is observed on a stagnation line. Again it is a straight for two equal jets and is bent towards the smaller jet when the two jets are not identical (5).
When the jet momentum ratio (mj1/mj2) is changed, as the momentum of one jet is increased relative to the other, the fountain inclines towards the jet with the lower momentum and included angle increases with increasing difference in jet momentum Saripalli (4; 2). Also the stagnation line will become curved, due to the jet momentum ratio, its position shifts toward the weaker jet and its curvature increases as the ratio of jet momenta is decreased (4).
Barata (6) have study fountain flow generation by impinging of two jets, but with cross flow on the floor surface, and have reported a large penetration of the impinging jets and the fountain upwash flow formed by the collision of the radial wall jets is deflected by the crossflow.
Different configurations for the nozzle pressure ratio (NPR) have been studied to ascertain the influence of the jet compressibility on the fountain development. The results indicate that the mixing
Experimental Study of Twin Air Impinging Jets
2008/2009
3 of the fountain is dependent on the NPR, leading to an increase in the fountain spreading rate with the increase of NPR (7).
The effects of multi-jet, with a hexagonal array of circular jets impinging normally on a plane wall have been studied by Geers et al (8). On the impinging region have been observed that the jet-to-jet interaction is caused mainly by the strong upwash flow resulting from collision of wall jets. This upwash augments the axial velocity gradient in the shear layer of the jet and, therefore, amplifies the conversion of mean flow momentum to turbulent stress.
Barata et all, (11) have realized some experiences varying the separation (S) height (H) and diameter (d) of the jet and find that these parameters have influence on the distinctive fan-shaped flow that is formed on the fountain formation zone. It have been also reported several cases where the upwash height grows and reaches a maximum then decreases and remain approximately constant, these phenomenon have been justified by a “critical mass”.
Some authors, as Saripalli (2), reported that use water as working medium is better than air, because the tracers suitable for use in water are more numerous then air and the aerodynamic phenomena can be observed at relatively slow speed in water for same Re number and model scale.
1.2. Research Objectives
The goal of this research project is to summarize the major characteristics of the fountain flow region, particular the fun shaped upwash and the entrainment phenomenon. Is also intention a comparative study between the water and air as working fluid.
1.3. Organization
This work is divided on five main chapters on the first is given an introduction to the theme and are described the relevant works that have been made on this area. On the second chapter is given a description of the experimental facility as well as the calibration and measurement methods. Is also described the design and construction of the seeding generator.
Below are presented and discussed the results obtained with this experimental work. Finally on the last two chapters some conclusions are discussed and are presented some suggestion about future works.
Experimental Study of Twin Air Impinging Jets
2008/2009
4
2
Research methodology
In this chapter is described the research methodology used to study the fountain upwash region of the twin air impinging jets. The chapter is divided in three sections, on the first section is described the test facility. Then is given an explanation about the seeding generator and is described the design and construction process of it. On the end of the chapter is explained the experimental process and also the installation calibration.
Experimental Study of Twin Air Impinging Jets
2008/2009
5
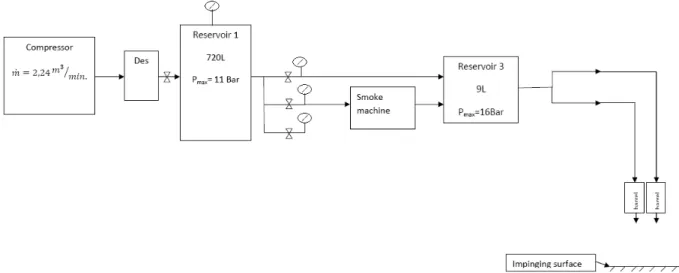
2.1 Test Facility
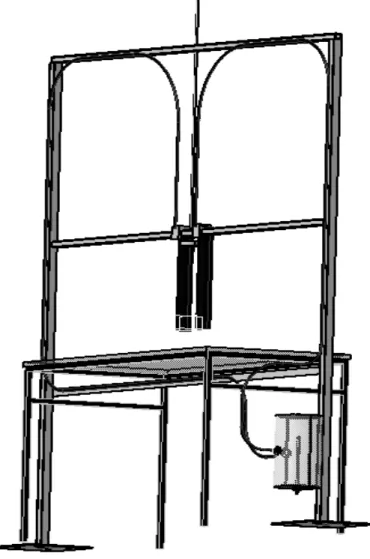
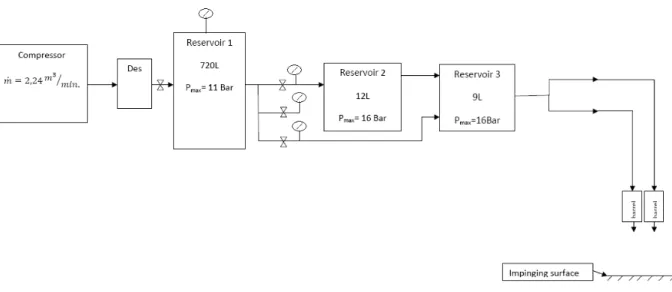
To realize the experimental work of this project a new facility has been built (figure 2). The design of this new facility has been based on the facility used by Sousa (9). The facility consists on a metal structure that supports an adjustable mechanical system which can accommodate twin stainless steel barrels with different diameters, which are the jets. Within this mechanical system, the barrels width and height can be independently adjusted.
The barrels are connected to a compressed air system that includes one or two pressure reservoirs. On these reservoirs is made the mixture between the air and the seeding particles, figure 3 and 5 experimental installation implemented. The compressed air system is supported by a compressor Boge Kompressonen Model S20, that have a flow of 2,24 , and a reservoir that have 720l of capacity and 11 Bar of maximum pressure, figure 3 and 5.
The impinging surface consist on a square glass cover (100 cm x 100 cm x 0,8 cm), supported by a metal structure.
2.2 Seeding Generator
To be possible the flow visualization is necessary add seeding particles to the flow. Because of the pressures evolved on this project (between 2 and 4 Bar), a seeding generator have been designed and built. Two ideas have been tested; first make a vaporizer and the second connect a smoke machine to one of the reservoirs.
Experimental Study of Twin Air Impinging Jets
2008/2009
6
2.2.1. Vaporizer
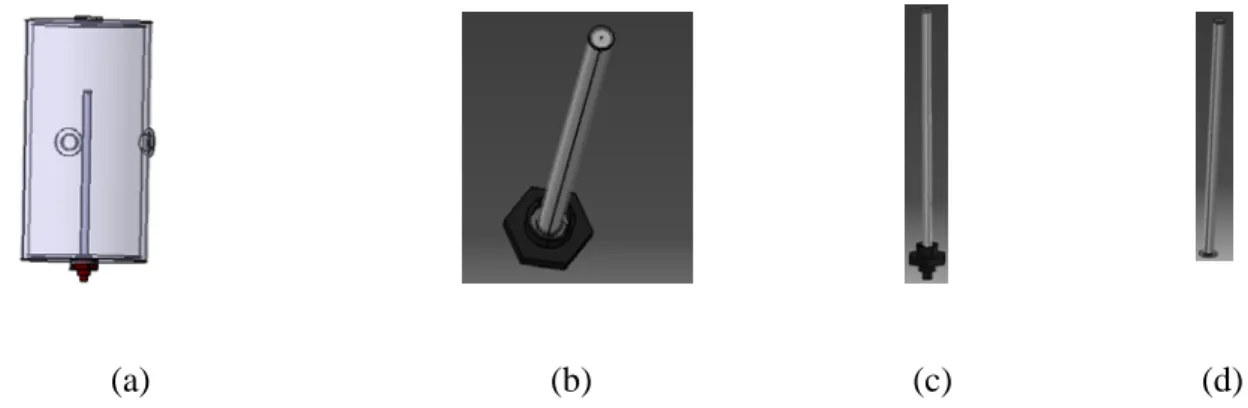
The vaporizer is inspired on one medical vaporizer, but built to operate with higher pressure. The system consists in a reservoir and two metal pipes, like in figure 4 (a). The two pipes are closed on the top and with a hole of 1 mm on the top. These pipes are working one inside of other, figure 4 (b). The inner pipe is connected to the air system and is used to don’t let the liquid inside of the reservoir get in the compressed air system, figure 4 (c). The outer pipe is working free just overlay on the first one. This system allows the liquid to fill the small space between both pipes, and the vibration of the second pipe that will bubbled the liquid inside of the reservoir.
With the vaporizer is possible to seeding the flow, but the pressure losses on the overlapping pipes is too high, and the pressure on the end of the system (on the jets) is too low, consequently the velocity and the Reynolds number was also to low to this project. To solve this problem have been connected a second air source to the reservoir (figure 3), but on this way, the seeding particles are not sufficiently to allow the flow visualization.
The liquid used on the vaporizer is glycerin with water, to try improve the augment of seeding have been tried some configurations, of this mixture: 30% water + 70% glycerin;
50% water + 50% glycerin;
70% water + 30% glycerin;
The better option is 30% water + 70% glycerin but with no one is possible to visualize the flow.
(a) (b) (c) (d)
Figure 4: Views of the vaporizer system: a) complete vaporizer system, b) two pipes of the vaporizer, c) inner pipe, d) outer pipe.
Experimental Study of Twin Air Impinging Jets
2008/2009
7
2.2.2. Smoke machine connected to the reservoir
On this concept the reservoir have entrances one was connected to the smoke machine and the other to the compressed air and inside of the reservoir is made the mixture.
The smoke machine, Techno-Fog Jem, converts a liquid in smoke, warming the liquid. This smoke is then injected on the compressed air system on around 2 Bar and connected to the reservoir. On the reservoir is also connected directly compressed air, between 2,4 and 4,4 Bar, figure 5.
With this method the visualization of the flow was possible and this method has been chosen to seeding the flow.
2.3 Method and Calibration
2.3.1. Configuration
To be possible a comparative study between water and air as working fluid the configuration set-up has been based on the work of Sousa (9). The jet diameter used in this work is the same of (9), as the ratio H/d and also the S/d (height diameter ratio and distance between jets respectively). Also has been given attention to the Reynolds Number (Re) on the jet exit to ensure the dimension similarity on the works.
Experimental Study of Twin Air Impinging Jets
2008/2009
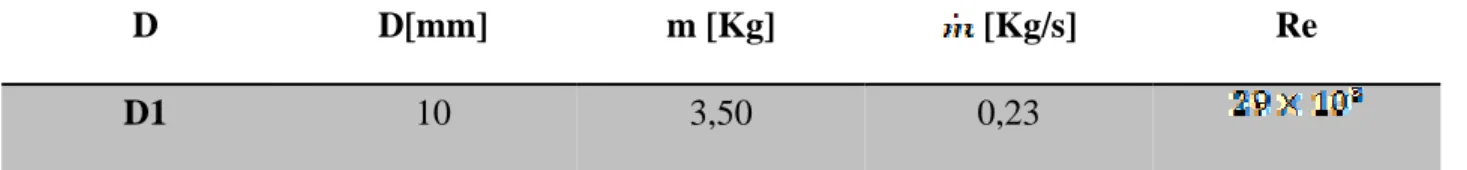
8 On this project is used one jet diameter (d= 10 mm), the pressure on the entrance of the compressed air system has been configured in order to achieve a similar Re on the jet exit with Sousa (9), table 1.
Starting from the mass of obtained on 15 seconds reported by Sousa (9), the mass flow have been computed by (1):
(1)
With the mass flow have been obtained the Re by (2):
(2)
The dynamic viscosity has been obtained for water at 20 , on the properties of water tables from (10).
D D[mm] m [Kg] [Kg/s] Re
D1 10 3,50 0,23
Table 1: Calculation of Reynolds number from Sousa (9)
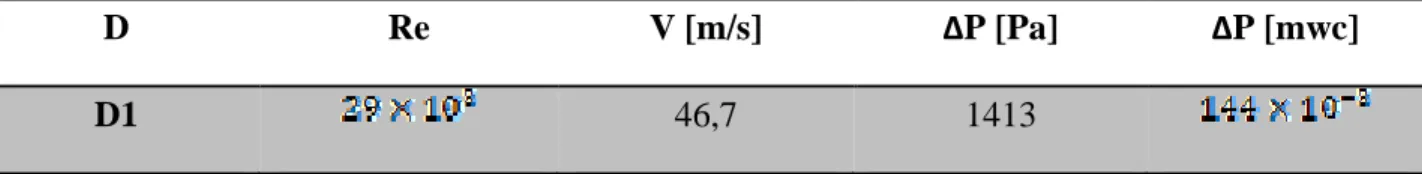
Achieved the values for the Re has been computed the pressure on the jet exit in order to achieve similar Re values. First have been computed the velocity desired:
(3)
The dynamic viscosity has been obtained for air at 20 , on the properties of air at atmospheric pressure tables from (10). The density has been computed by (4):
Experimental Study of Twin Air Impinging Jets
2008/2009
9 The atmospheric pressure and the temperature values were measured and it were 995 Pa and 295 respectively. The gas constant (R) value is 287,15 .
Assuming that the difference between the ambient pressure and the pressure on the jet exit is the dynamic pressure the Bernoulli (5) equation can be applied to find the desired pressure on the jet exit.
(5)
The calculated values are presented on the Table 2.
D Re V [m/s] ΔP [Pa] ΔP [mwc]
D1 46,7 1413
Table 2: Calculated pressure to ensure the dimensional similarity between water and air tests
The difference of pressure has been also calculated in meter of water column (mwc) to be easier to take the measurements.
To take the jet exit pressure has been used a Pitot pipe that have been collocated on the middle of the jet and the pressure on the system entrance have been regulated till the pretended pressure on the jet exit for both cases (pressure on the system entrance is 2,4Bar).
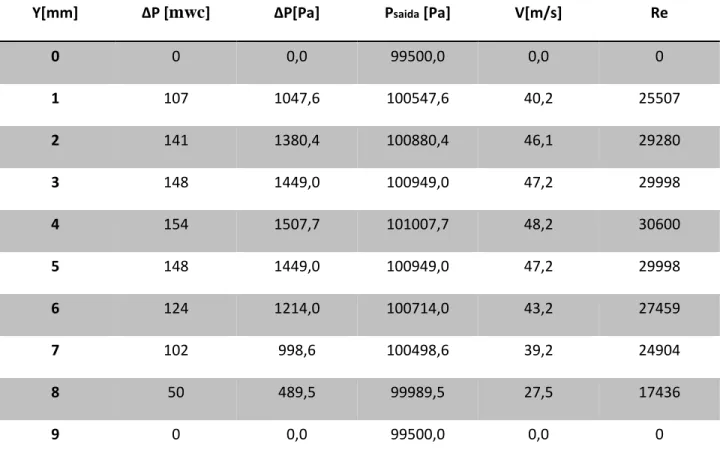
The same Pitot pipe has been used to take velocity profile on the jet exit that is shown on Table 3 and on figure 6.
Experimental Study of Twin Air Impinging Jets
2008/2009
10
Y[mm] ΔP [mwc] ΔP[Pa] Psaida [Pa] V[m/s] Re
0 0 0,0 99500,0 0,0 0 1 107 1047,6 100547,6 40,2 25507 2 141 1380,4 100880,4 46,1 29280 3 148 1449,0 100949,0 47,2 29998 4 154 1507,7 101007,7 48,2 30600 5 148 1449,0 100949,0 47,2 29998 6 124 1214,0 100714,0 43,2 27459 7 102 998,6 100498,6 39,2 24904 8 50 489,5 99989,5 27,5 17436 9 0 0,0 99500,0 0,0 0
Table 3: Velocity profile for pressure on entrance is 2,4 Bar
The visualization of the flowfield has been taken for different heights and jets distance. The points of variation chosen are always function of the diameter as in (9; 11), and are represented on Table 4. For an easy identification of different image have been given a number for the H/d from one to five for each H/d value, number one correspond to H/d=4 and five correspond to H/d=24. The same concept have been adopt for each S/d but with letters, from A to D (A corresponds to S/d=10 and D to S/d=48). With this concept for example the image 2C corresponds to H/d=8 and S/d = 24.
H/d 4 8 12 16 24
S/d 10 12 24 48 -
Experimental Study of Twin Air Impinging Jets
2008/2009
11
2.3.2. Flow visualization
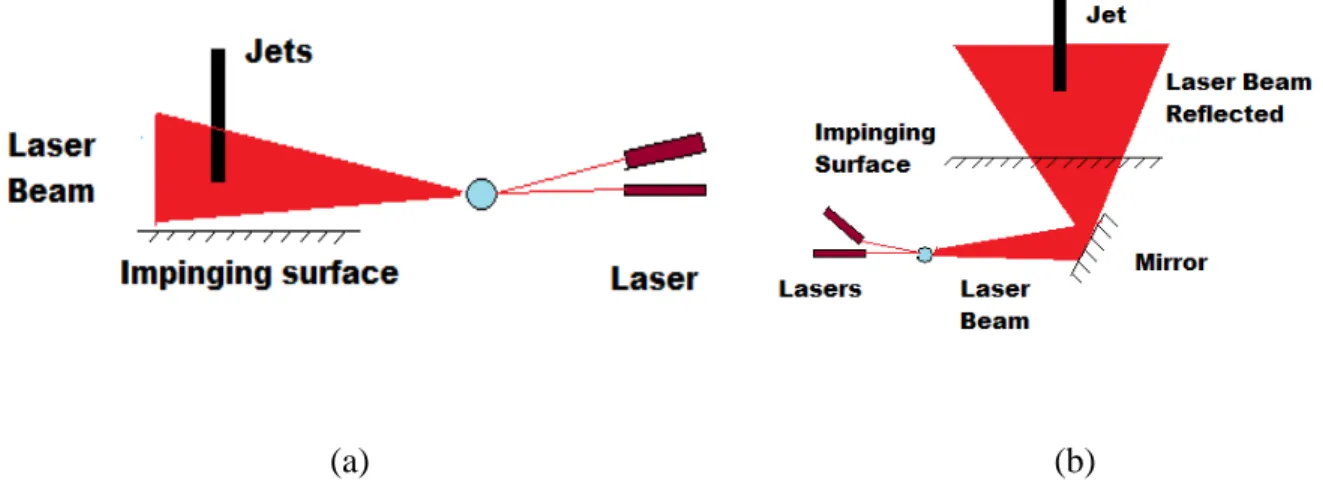
The flow visualization has been made by seeding the flow with small particles, illuminated by a laser sheet of light. The laser beam is obtained by two lasers light that are optical dispersed. Have been tested two configurations to illuminate the impinging region, figure 7. First illuminating directly the flow field, figure 7 (a), and the second one illuminating the fountain upwash region under the impinging glass surface by the reflection of the laser beam by a mirror, figure 7 (b). The first visualizations have been made with the laser light coming directly to the fountain upwash region, on the same height of the impinging surface, and the sheet of light was in the same direction of the fountain upwash, figure 7 (a).
(a) (b)
Figure 7: Laser illumination. a) laser direct to the flow; b)laser reflected by the mirror
This is not a good solution because is not possible to obtained photos perpendicular to the fountain upwash and just at 60 degrees to it. With the camera on this position become difficult to make the visualization because the light of the laser is making interference on the pictures, and the image process is quite more difficult.
On the second solution have been used a mirror to project the laser light from under the impinging glass surface figure 7 (b). On this solution have been possible to take the pictures just 90 degrees to the flowfield, and observe the fountain upwash region after some image processing made in “Matlab” and also take the measurements. A code has been implemented to convert pixel in distance, better described on the section 2.3.3.
Experimental Study of Twin Air Impinging Jets
2008/2009
12
2.3.3. Image acquisition system
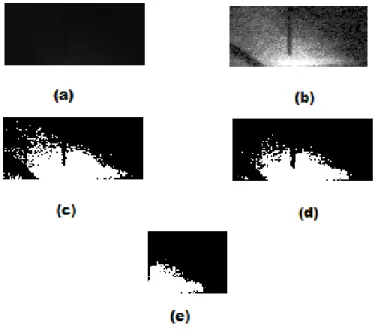
The fountain upwash region has been captured with a common video camera. The video of each test have been then post processed , four seconds of each video have been cut, and converted in one hundred images, using the program “Adobe premiere pro 2.0”. For the image post-processing were developed some algorithms using the Image Processing Toolbox of Matlab software.
The figure 8 shows the evolution of the image during the post processing. After read the images they are matrix of values, according to a 256 grayscale, where the minimum value corresponds to black and the maximum to white.
Then, is made the average value of the one hundred images figure 8 (a). Then to increase the contrast of the image, the image intensity values are adjusted to a new range, figure 8 (b).
Then the image is converted on a binary image, where the output binary image has value of 0 (black) for all pixels in the input image with luminance less than level and 1 (white) for all other pixels, figure 8 (c).
To clean the holes in the image, the isolated points have been converted. First the white points and then the black points figure 8 (d).
Figure 8: Post-processing evolution - (a) image in grayscale; (b) image intensity values readjusted; (c) binary image; (d) binary image cleaned; (e) half image.
Experimental Study of Twin Air Impinging Jets
2008/2009
13 After clean the image, and because the left side of the image presents big interference, the image has been cut in the middle, and has been made a mirror to project the image on the left side. Also with a mirror the image has been converted to upside down because of the coordinate system present in “Matlab” and the final image is presented on figure 9.
To be possible compute the height and length of the fountain upwash have been introduced a counter on the program that will count all the white points on each column of the image. With these values is built a curve that represents the fountain upwash showed on the figure 10 with blue circles. This curve is then represented by a polynomial approach, fourth degree, represented on figure 10 with the green line.
The height of the fountain upwash will be given by the maximum of the polynomial approach and the length is given by the two consecutives zeros of the polynomial approach.
To convert the pixels in distance have been filmed ruler on the same place and camera configuration that all the tests realized. That ruler, then give a height per pixel (HPP) and length per pixel (LPP) that is multiplied to the values achieved for the height and length respectively.
Experimental Study of Twin Air Impinging Jets
2008/2009
14
Experimental Study of Twin Air Impinging Jets
2008/2009
15
3
Results
On this chapter will be presented and analyzed the results of the tests realized. The chapter will be divided in two sections, firstly are analyzed the images of the tests realized and on the second section are presented the height and length computed for each case. In both section is always made a comparative analyze between the results of the present work and a similar work realized with water reported in (9; 11).
3.1 Visualization Study
To be possible the visualization of the fountain upwash region have been used the process described on 2.3.3, the final results of the image processing are presented on the figure 11. This is sub divided as described on section 2.3.1and just are present the image where have been possible to identify the fountain upwash region.
On the visualization study (figure 11) can be identify four different regimes for the fountain upwash region, as in the case of water as working fluid, (11).
On the figures 11 (1A and 2B) exist a regime where the fountain upwash is clearly defined, and there are almost no particles spreading out; on figures 11 (1B, 1C, 2B and 3C) is present a different regime where the upwash is also clearly defined, but there are several particles spreading out; on the figure 11 (2C, 3B, 3C, 4A, 5C) the upwash is not clearly defined and the spreading is dominant. On the other cases not present on the figure 1D, 2D, 3D, 4B, 4C, 4D, 5B, 5C, 5D is not possible to identify the fountain upwash, can be conclude that in this cases there are practically no interference between the jets.
Maintaining H/d constant, is possible to observe the influence of the horizontal spacing between tubes (S/d). If S/d increases, the interference between the jets decreases, resulting in a decrease of the upwash height.
To observe the effect of the impinging height, the parameter S/d is maintaining constant. Also the height of the fountain upwash decreases with the increasing of vertical distance between the jets and the impinging surface.
These results agree with the results presented with water as working fluid (11), the parametric variation will be very similar.
Experimental Study of Twin Air Impinging Jets
2008/2009
16 S/d=10 S/d=12 S/d=24 H/d=4 1A 1B 1C H/d=8 2A 2B 2C H/d=12 3A 3B 3C H/d=16 4A H/d=24 5A
Figure 11: Fountain upwash for each case in study – 1A: H/D=4 S/D=10; 1B: H/D=4 S/D=12; 1C: H/D=4 S/D=24; 2A: H/D=8 S/D=10; 2B: H/D=8 S/D=12;2C: H/D=8 S/D=24; 3A: H/D=12 S/D=10; 3B: H/D=12 S/D=12; 1C: H/D=12 S/D=24;
Experimental Study of Twin Air Impinging Jets
2008/2009
17
3.2 Measurements
From figure 12 to figure 15 are represented the graphics with the values of height (Hfountain upwash) and length (Lfountain upwash) of the fountain upwash. Are represented the values for the case studied in this work ,air as working fluid, and values taken from (9), water as working fluid.
The figure 12 shows the fountain’s upwash height variation for constant H/d and S/d variable. As was described on section 2.3.1 the curves 1, 2, 3, 4, 5 respectively to H/d=4, 8, 16, 24, 48. Analyzing the air curves can be conclude that as the ratio S/d is increased, the height of the fountain upwash will decrease until zero for the curves 1, 2 and 3 for H/d=48 and for the curves 4 and 5 for H/d=12. Can also be notice that the curves 1, 2 and 3 are very similar and that the curve slope from the first point to the second one is different than the curve slope from the second to the third point.
Figure 12: Fountain’s upwash height variation for height constant and distance variable. Are represented the values for air obtained on this work and for water from (9).
Experimental Study of Twin Air Impinging Jets
2008/2009
18 The water curves present a different pattern. From S/d=8 until S/d=12 they are increasing with the increasing of the S/d, from this point until S/d=24 it will decrease with the increasing of S/d ratio. Also can be notice that height variation for the air case is higher than the variation obtained for the water case. With air as working fluid is present the highest value for 1A (H/d=4 and S/d=10) and also starts to not be possible observe the fountain upwash sooner.
The figure 13 shows the fountain upwash height variation for S/d constant and H/d variable, for air case and water case (9). As was described on section 2.3.1 the curves A, B, C respectively to S/d=10, 12, 24. Analyzing air case can be conclude that as the ratio H/d is increased, the height of the fountain upwash will decrease, until zero in cases of curve B and C for values H/d=16. Can also be notice that the curves A the point 4 and 5 are very similar.
The water case presents a different variation. On the case C (S/d=24) the fountain upwash value is almost constant, very curious is the curve B (S/d=12) where from H/d=4 until H/d=12 the fountain upwash is increasing, then decreases from H/d=12 until H/d=16 and then stays constant. In both cases (air and water) from H/d=16 to H/d=24 the height of the fountain upwash tend to stay constant. One more time height variation is superior with air then with water.
Figure 13: Fountain’s upwash height variation for height variable and distance constant. Are represented the values for air obtained on this work and for water from (9).
Experimental Study of Twin Air Impinging Jets
2008/2009
19 On the figure 14 is shown the fountain upwash length variation for H/d constant and S/d variable. Analyzing the air curves is not possible find a relation between the length and the S/d ratio. The curve one is increasing as the S/d is increasing; the curve 2 increase from S/d=10 until S/d=12, but from S/d=12 until S/d=24 decreases; the curve 3 decreases from S/d=10 until S/d=12, but from S/d=12 until S/d=24 increases; the curves 4 and 5 decreases from S/d S/d=10 until S/d=12, where it is achieved zero and stay always zero.
On the water curves can be find a pattern. In the five water curves the length of the fountain upwash increases from S/d=8 until S/d=12 and decreases from S/D=12 until S/d=24.
Figure 14: Fountain upwash length variation for height constant and distance variable. Are represented the values for air obtained on this work and for water from
Experimental Study of Twin Air Impinging Jets
2008/2009
20 On the figure 15 is shown the fountain upwash length variation for S/d constant and H/d variable. On the air case is not possible to find a relation between the length and the H/d ratio. On the A curve from H/d=4 and H/d=8 the fountain upwash length is almost constant and from H/d=8 until H/d=24 is always decreasing. . The curve B, from H/d=4 until H/d=8 the curve is decreasing, from H/d=8 until H/d=12 the length is increasing and from H/d=12 until H/d=16 the length is decreasing and achieve zero on H/d=16 where is constant for H/d=24 and 48. On this case the length of the fountain upwash looks like tend to decrease with the increasing of the H/d ratio, but more cases should be studied to confirm this theory.
On the water case the curves are very similar and look to be almost constant. From H/d=4 until H/d=8 exists a little increasing length and from 8 until 24 the value in both curves are almost constant.
Figure 15: Fountain upwash length variation for height variable and distance constant. Are represented the values for air obtained on this work and for water from (9).
Experimental Study of Twin Air Impinging Jets
2008/2009
21 Comparatively to the work developed with water as working fluid (9;11) the values presents different magnitude. On the air case the values of H/d are varying between 9,16 and 0 (table 5), in the case of water the values are varying between 3,5 and 0,5 (9). With air the values of H/d are bigger and also the variation is higher. On the air case the wall jet is increasing since the impinging region until the upwash, this is the resting fluid being pulled.
When the length is analyzed has been difficult to find a pattern on both situations studied (for H/d constant and S/d variable and H/d variable and S/d constant). More tests should be realized to try find a pattern and to confirm the algorithm implemented to measure the length of the fountain upwash.
During the tests have been observed that the thickness of the fountain upwash is not constant along all the height of the upwash, this may be related with the entrainment phenomenon on the impinging region. Unfortunately there was not time to measure the thickness of the fountain upwash, but this is a interesting parameter to study in future works.
Experimental Study of Twin Air Impinging Jets
2008/2009
22 Height of the fountain upwash for H/d constant and S/d variable A: S/d=10 H/d Hupwash/d B: S/d= 12 H/d Hupwash/d C: S/d=24 H/d Hupwash/d 4 9,16 4 7,47 4 5,95 8 7,22 8 6,42 8 4,15 12 4,84 12 3,42 12 1,5 16 2,19 16 0 16 0 24 2,11 24 0 24 0 Length of the fountain upwash for H/d constant and S/d variable A: S/d=10 H/d Lupwash/d B: S/d=12 H/d Lupwash/d C: S/d=24 H/d Lupwash/d 4 38,29 4 39,21 4 43,06 8 38,84 8 33,03 8 39,87 12 32,37 12 38,38 12 39,38 16 24,5 16 0 16 0 24 21,07 24 0 24 0 Height of the fountain upwash for H/d variable and S/d constant 1: H/d=4 H/d Hupwash/d 2: H/d=8 H/d Hupwash/d 3: H/d=12 H/d Hupwash/d 10 9,16 10 7,22 10 4,84 12 7,47 12 6,42 12 3,42 24 5,95 24 4,15 24 1,5 Length of the fountain upwash for H/d variable and S/d constant 1: H/d=4 H/d Lupwash/d 2: H/d=8 H/d Lupwash/d 3: H/d=12 H/d Lupwash/d 10 38,29 10 38,84 10 32,37 12 39,21 12 33,03 12 38,38 24 43,06 24 39,87 24 39,38
Experimental Study of Twin Air Impinging Jets
2008/2009
23
4
Conclusions
A visualization study and characterization of a twin jet flow when impinging vertically to a solid surface is reported on the present work. The air has been utilized as working fluid.
The flow visualization has been difficult to execute, and during the work have been tried to improve this area. Have been given attention to the seeding generator process, to the illumination of the flow field and finally have been necessary to post process the images captured. In spite of being possible to take the pictures 90º to the fountain upwash region, the concentration of seeding particles should be superior for a more accurate visualization of the flow field.
The visualization results revealed the presence of a distinctive fan-shape flow that is formed on the fountain upwash region, which is influenced by the different parameters (height of the jets and horizontal distance between the jets). Four different regimes have been observed: the fountain upwash clearly defined, with almost no particles spreading out; fountain upwash clearly defined, with several particles spreading out; the fountain upwash not defined and the spreading is dominant; fountain upwash not present or imperceptible.
Have been also observed that when the ratio S/d or H/d is increasing, the height of the fountain upwash decreases, caused by a reduction on the interference between the jets. Have not been possible to understand which one of the parameter is more influent on the height of the fountain upwash, more tests should be run to try understanding it.
Using water and air as working fluid have been found different magnitudes of values and patterns. On the air case the values of H/d are varying between 9,16 and 0 (table 5), in the case of water the values are varying between 3,5 and 0,5 (9). The variation of values is higher when the working fluid is air than water. On the air case the wall jet is increasing since the impinging region until the upwash, this is the resting fluid being pulled.
About the length of the fountain upwash have been difficult to find a pattern on the situation studied (for H/d constant and S/d variable and H/d variable and S/d constant). More tests should be realized to try finding a pattern and to confirm the algorithm implemented to measure the length.
Experimental Study of Twin Air Impinging Jets
2008/2009
24
5
Future works
Regarding to the future work, there are several directions to follow to understand the twin impinging jets and better characterize the fountain upwash region.
It is interesting to improve the seeding generation process utilized on this work. The concentration of seeding particles should be adjustable and allow superior seeding particles concentrations on the system. This process can lead to a better flow visualization and more accurate flow visualization.
Should also be realized the same study for more horizontal jet distance (S/d) and jet height (H/d) to try find better understand how the upwash length is varying and find a pattern for it. Another characteristic of the fountain upwash region, which is interesting to measure, is the thickness of fountain upwash region, that looks like to be not constant along the all height of the upwash, which indicate the presence of the entrainment phenomenon.
During this work just one jet velocity have been utilized, and it was interesting know the effect of this parameter on the fountain upwash. The pressure on the entrance of the system and the diameter of the jet exit should be changed to observe the effects. Another parameter that may have an important role is the roughness of the solid surface; it is interesting to understand how it can alter the fountain upwash characteristics.
Experimental Study of Twin Air Impinging Jets
2008/2009
25
6
References
1. Siclari, M. J., et al. Development of Theorical Models for Jet-Induced Effects on V/STOL Aircraft. J. Aircraft. December 1976, Vol. 13 No. 12.
2. Saripalli, K. R. Visualization Studies of Jet Impingement Flow at Macdonnell Douglas
Research Laboratories. Univ. Michigon, Ann Arlor, Michigon, USA : 3rd Symp on Flow
Visualization; Ed. W.I. Young, Sep 6-9, 1983.
3. Barche, J. Jet Interactions With Neighbouring Surfaces.
4. Saripalli, K. R. Visualization of Multijet Impingement Flow. AIAA Journal. April 1983, Vol. 21 No. 4.
5. Kate, R. P., Das, P. K. and Chakraborty, Suman. An Experimental Investigation on the Interaction of Hydraulic Jumps Formed by Two Normal Impinging Circular Liquid Jets.
6. Barata, Jorge M. M. Ground Vortex Formation with Twin Impinging Jets. Jupiter, Florida : International Powered Lift Conference, November 18-20, 1996.
7. Cabrita, P. M., Saddington, A. J. and Knowles, K. PIV Measurements in a Twin-Jets STOVL Fountain Flow. The Aeronautical Journal of the Royal Aeronautical Society. October 2005.
8. Geers, Leon F. G., Tummers, Mark J. and Kemal, Hanjalic. Experimental Investigation of Impinging Jet Arrays. Experimental in Fluids. 36, 2004, Vols. 946-958.
9. Sousa, Nuno Miguel Costa Barros da Silva. Experimental Study of Multiple Water
Impingement Jets. Covilhã : Universidade da Beira Interior, 2007/2008.
10. Fox, Robert W., Mcdonald, Alan T. , Pritchard, Philip J.. Introduction to Fluid Mechanics.
Wiley 4th edition.
11. Barata, Jorge M. M., et al. Flow Characteristics of Twin Impinging Jets. 47th AIAA
Aerospace Sciences Meeting Including The New Horizons Forum and Aerospace Exposition. 5 - 8
Experimental Study of Twin Air Impinging Jets
2008/2009
26 12. Saddington, A. J., Lawson, N. J. and Knowles, K. An Experimental and Numerical Investigation of Under-Expanded Turbulent Jets. The Aeronautical Journal of Royal Aeronautical
Society. March 2004.
13. Saddington, A. J. and Knowles, K. A Review of Out-of-Ground-Effect propulsion-Induced Interference on STOVL Aircraft. Progress in Aerospace Sciences. 41, 2005, Vols. 175-191. 14. Bevnaqua, Paul M. Inventing the F-35 Joint Strike Fighter. Orlando, Florida : 47th AIAA Aerospace Sciences Meeting Including The New Horizons Forum and Aerospace Exposition, 5-8 January 2009. AIAA 2009-1650.