Immigration and pension system in
Portugal
Tânia Cristina Simões de Matos dos
Santos
Instituto Politécnico de Leiria
Inmaculada Domínguez Fabián
Universidad de Extremadura
2012
2
globADVANTAGE
Center of Research in International Business & Strategy
INDEA - Campus 5
Rua das Olhalvas
Instituto Politécnico de Leiria 2414 - 016 Leiria PORTUGAL Tel. (+351) 244 845 051 Fax. (+351) 244 845 059 E-mail: globadvantage@ipleiria.pt Webpage: www.globadvantage.ipleiria.pt WORKING PAPER Nº 84/2012 Janeiro 2012 Com o apoio
3
Immigration and pension system in Portugal
Tânia Cristina Simões de Matos dos Santos
School of Education and Social Sciences
globADVANTAGE – Center of Research in International Business & Strategy Polytechnic Institute of Leiria, Portugal
Rua Dr. João Soares Apartado 4045 2411-901 Leiria - Portugal
tania.santos@ipleiria.pt
Inmaculada Domínguez Fabián
University of Extremadura - Spain Faculty of Business Studies and Tourism Department of Financial Economy and Accounting
idomingu@unex.es
A preliminary version of this paper was presented at the VI Annual Meeting of REDGOB – Migration, Social Cohesion and Governability, Lisbon - Portugal, December 2008
4
Immigration and pension system in Portugal
Abstract
The Portuguese Pension System is submitted to two risks. Over the period 2005-2050, a decrease of the workforce and an increase of old-age persons are eminent, which provide a doubling of the dependency rate. So, the system is not financially sustainable in the medium and long terms and it is expected that the system will enter in a growing deficit in 2015, when expenditures will overcome the revenues. Hence, the system is subject to a demographic risk (associated with the reduction of the fertility rates, the augmentation of the life expectancy and the increase of the dependency rate) and to a financial insolvency risk (motivated by the lack of equatorial correspondence between expenditures and revenues).
Immigration could be a solution to the unsustainability of the pension systems. This paper examines the role of the immigration on resolving these two risks. We investigate, based on the European Economy (2006) projections about the impact of ageing on the public expenditure for the period 2005-50, the required immigrant flows that maintain the old-age dependency rate observed in 2004, and we calculate also the number of immigrants required to promote a null financial result for the Portuguese Pension System.
We conclude that the number of immigrants that guarantees a null financial result is much lower than one that eliminates the demographic risk. Compared with the European Economy forecasts (2006), the number of immigrants required to guarantee the solvency of the Portuguese pension system is substantially higher and show an upward trend during the period under review contrary to the expected trend announced by that European entity.
JEL: H55, J11, J26
Keywords: Portuguese Pension System, immigration, dependency rate,
5
Introduction
The Social Security Systems are necessary to ensure a fair and efficient development and they are essential factors to guarantee social cohesion and national and international stability. Included in Social Security, the pension schemes are probably the more complex institution on welfare state (Alonso and Conde-Ruiz 2007).
As in many of the countries with public Pension Systems that are based on Pay-As-You-Go (hereafter PAYG) schemes, the Portuguese Social Security System is on the brink of collapse. With a diminished ratio of contributors to pensioners, associated to a sharply population ageing, the financial base of PAYG Systems is expected to deteriorate.
In this context, the study of the current situation of the Portuguese Pension System and its previous evolution takes special pertinence. This paper intends to investigate the future evolution of the Portuguese Pension System and the contribution of immigration to solve its financial problems.
Actually the immigration phenomenon is known to have been a key element to the development of European and North-American societies. We underline the dimension assumed by immigration in Spain, namely the fact that this country has become in recent decades the main economic receptor of immigrants of the European Union. Also in Portugal, the importance of this phenomenon is increasing. Observing the statistics, we note that Portuguese population is ageing and that immigration contributes positively to Portuguese population size and to the population demographic structure (Branco and Gonçalves 2001; Rosa, Seabra and Santos 2003, 2004; Carrilho 2005). Motivated by this ageing, the Portuguese Pension System is with a solvency problem in the medium and long terms. Immigration could be a solution, even though it is transitory (Carrilho 2005).
In relation to the idea that pension schemes could place severe pressure on future public budgets, many authors defend the contribution of immigration to solve problems associated to population ageing. Several authors point out immigration as a possible measure to correct the fall of the demographic factor, and therefore, the financing of the Pension System. Although, there is no assurance that immigration is sufficient to offset
6 population ageing, it could prevent it, postponing therefore the resolution of the problem. Studies carried out by Alonso and Herce (2003), Conde-Ruiz, Jimeno Serrano and Valera Blannes (2006) and Rojas (2002) show this perspective. The United Nations (2000) also conclude that immigration could not rejuvenate age structure of the host countries population, for two reasons: migration couldn’t avoid the population decline and the migratory fluxes only gloss over the demographic ageing. The United Nations (2000) report examines eight countries (France, Germany, Italy, Japan, Republic of Korea, Russian Federation, United Kingdom, and the United States) and includes two regions (Europe and the European Union), over a time period which cover roughly half a century (1995 to 2050), and concludes that «the levels of migration needed to offset population ageing (i.e., maintain potential support ratios) are extremely large, and in all cases entail vastly more immigration than occurred in the past», although this conclusion had been subject to numerous criticism. The discussion continues until now. Nevertheless, it has dropped the concept of replacement migration in favour of the concept of complementary migration, according to which migration will complement and not replace demography (Brancós and Domingo 2000; Wattelar and Roumans 1991; Borjas 1994; Niessen and Schibel 2002; Haug 2002; Izquierdo and Jimeno 2005; Léon Salas 2005).
Section 1 briefly introduces the current data and projections for immigration in Portugal. In this Section, we show the increasing presence of immigrants in Portugal in recent decades, as its characteristics, and we will also present a projection of future entries in future decades, based on the European Economy (2006) projections, hereafter EU(2006), about the impact of ageing on public expenditure for the period 2005-50.
We intend to analyse, in Section 2, the Portuguese Pension System, putting in evidence its latest evolution in terms of expenditures and revenues. The increase of the dependency rate, the reduction of fertility rates and the decrease of birth rates are important elements to determine current and future difficulties of Portuguese Pension System. Martinho (2006) and Mendes (2006) consider that structural changes must go over the current reformulation of PAYG system and should move to a multidimensional social protection model.
7 Finally, we will find that the Portuguese Pension System will go into an increased deficit in 2015. The demographic risk could be eliminated by the maintenance of old-age dependency rate. Nevertheless, to promote the sustainability system in the long term, the system must be continually in financial balance. Therefore, in Sections 3 and 4, we analyse the impact of the presence of immigrants within the current PAYG framework, showing the number of immigrants that could eliminates demographic and solvency risks, respectively. Section 3 investigates entries of immigrants that guarantee until 2050 that the old-age dependency rate will not vary. Section 4 explores the required immigration to achieve in the next fifty decade the equality in revenues and expenditures of the Portuguese Pension System. These calculations will take into account age and wage structure of immigrant and Portuguese populations. Our main conclusions are presented in Section 5.
Immigration in Portugal Real data of immigration in Portugal
Portugal has become, in recent decades, an immigration country. The presence of foreigners in Portugal has increased significantly. Peixoto (2002) argues that the number of immigrants is growing as well as its source countries and verifies that the foreign population in Portugal has a clear impact on the economic, demographic and social areas.
According to the Aliens and Borders Service statistical information, the total number of foreigners with residence permits exceeded, in 2001, 350 thousand, which corresponds according to statistical information of Statistical National Institute (2006) to more than 3% of the population residing in Portugal in that census year. The Figure 1.1 presents the evolution of the percentage of foreigners in total population resident in Portugal in the period 1980-2005. We note that in this period the weight of foreigners in the total population tripled, the stronger growth occurring between 1998 and 2001.
8
Figure 1.1 Evolution of the percentage of foreigners in total population
resident, Portugal, 1980-2005. 1 0,0% 0,5% 1,0% 1,5% 2,0% 2,5% 3,0% 1980 1982 1984 1986 1988 1990 1992 1994 1996 1998 2000 2002 2004
Source: Authors calculations, based on Statistical National Institute information. 2
About the distribution of the foreign population resident in Portugal by socio-economic group, the Figure 1.2 shows that the occupation worker is dominant, the African citizen being the population that fills mostly this function. Thus, based on the terminology adopted by Cébrian Lopez et al. (2007), this activity is mostly filled by economic immigration (immigration from less developed countries). Seniors and intellectuals and scientific functions are occupied by citizens who come from European countries, so these activities are occupied by non-economic immigration. It is important to say that among the total of immigrants living in Portugal in 2001, 37% were inactive. However, we must integrate this 37% of inactive immigrants in Portuguese reality: based on the information available by the Statistical National Institute (2002), the inactivity rate was of about 49% in Portugal in 2001.3
1 The ratio between the foreign population with legal status of resident and the total population residing in Portugal.
2http://www.ine.pt/xportal/xmain?xpid=INE&xpgid=ine_princindic, 13/11/2007.
3 Inactive Population = 4.894.500; Total Population Total = 10.060.800. The inactivity rate was calculated by the authors.
9
Figure 1.2 Foreign population resident in Portugal by socio-economic
group, 2001.
Source: High Commissioner for Immigration and Ethnic Minorities (2005).
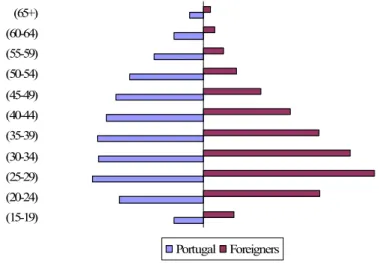
Figure 1.3 presents the percentage of distribution of active population by age group, in 2001, for the Portuguese and immigrant populations. We may see that immigrant population is younger than national population. Immigrants who come to Portugal are mostly young which promotes the rejuvenation of Portuguese population and contributes positively for the equilibrium of the Pension System.
We observe another important aspect in the Portuguese and immigrants population pyramid: the percentage of foreigners aged 55 and more (4,7%) is comparatively inferior to national (11,9%), which confirms the positive contribution of immigrants to Pension System.
Figure 1.3 Active population by age group, Portugal, 2001.
(15-19) (20-24) (25-29) (30-34) (35-39) (40-44) (45-49) (50-54) (55-59) (60-64) (65+) Portugal Foreigners
Source: High Commissioner for Immigration and Ethnic Minorities (2005).
0 5 10% 15 20% 25% 30% 35% 40% Entrepreune Indep Senio Middle Management Services Worker Other Inactives
10 Figure 1.4 shows a relatively higher number of immigrants without any academic degree, in comparison to the Portuguese population. However, the percentage of immigrants with basic education is lower than the Portuguese. Nevertheless, foreigners have a relatively higher number of persons who have secondary and higher education than Portuguese people. So, we find that Portuguese immigration is a complementary and not a substitutive productive factor, which promotes national productivity and, consequently, wages increase.
Figure 1.4 Portuguese and immigrant populations by education level,
Portugal, 2001. 0 10 20 30 40 50 60 70
None Basic Secundary High
Portugal Foreigners
Source: Statistical National Institute.
Projections for immigration in Portugal
The EU projections about the impact of ageing on public expenditure for the period 2005 to 2050 are presented in this subsection. Table 1.1 displays projections for size and structure of the Portuguese population and Figure 1.5 shows immigrants entries projections.
Table 1.1 demonstrates that dramatic changes will occur on the size and on the structure of the Portuguese population. In 2004, most of the population was active; in 2050, reflecting the baby-boomers entry on the reform, associated with the reduction of the fertility rates and the increase of the life expectancy, active population will decrease and the percentage of old-age population will increase. It is expected that, in the period 2005-50, the total population will decrease in Portugal of about 4%. Younger and
11 active population will suffer a reduction of 20% and on the contrary old-age will increase on 18%. We enhance the high variation percentage (181%) of more old-age people (age 80 and more). This situation will put a lot of pressure financial position of the Portuguese Pension System. Table 1.1 also shows that the percentage of immigrants on the total population will decline from 0,4 in 2004 to 0,1 in 2050.
Figure 1.5 shows a strong decrease in immigrants entries in Portugal. EU (2006) foresees that annual flows of immigrants will decline from 42 000 immigrants in 2004 to 15 000 in 2050.
Table 1.1 Projections of the size and the structure (of the) population and
of the immigrant percentage on the total population, Portugal, 2004-50.
Size and structure of population (in
millions) 2004 2050 Percentage change Total population 10,5 10,1 -4 Young population (0-14) 1,6 1,3 -21 Active population (15-64) 7,1 5,5 -22
Old-Age population (65 and more) 1,8 3,2 18
Very old-age population (80 and more) 0,4 1,1 181 Percentage of immigrants on the
total population 0,4 0,1
Source: EU (2006).
Figure 1.5 Immigrant population entries projections (thousands), Portugal,
2004-2050 0 5 10 15 20 25 30 35 40 45 2004 2010 2020 2030 2040 2050 Source: EU (2006).
12 In this Section we noticed that despite the increasing presence of immigrants in recent decades in Portugal, there is an expected decline of these entries in the next fifty years. We should note that Portuguese immigration is a complementary productive factor, which supports the economic wealth. Since immigration has promoted the rejuvenation of the Portuguese population, contributing positively for the sustainability of the Pension System, we will analyze in the next Section the evolution of the Portuguese Pension System in recent decades and later (in Sections 3 and 4) the contribution of immigrants for the sustainability of system.
PENSION SYSTEM IN PORTUGAL
In Portugal, the majority of the population is inserted essentially in two big systems: Solidarity System of Social Security, represented on National Centre of Pensions, and the System of Government Employees Social Protection, denominated Caixa Geral de Aposentações. The first system covers all employees of the private sector and independent workers; the second one includes civil servants. With different mechanisms and histories, these two institutions are in a convergence process. These schemes cover old-age, early retirement, disability, survivors (widows and orphans) pensions and other specific situations including those due to reduced capacity to work and those due to labour market reasons. In the present study, we will analyse the old-age pensions only.
In this Section we intend to analyse the recent evolution of the Portuguese Pension System, as statistical information available, in terms of expenditures and revenues. To understand the latest evolution of the Pension System expenditures, we will take a briefly exploration of past development as to the number of old-age pensioners and to the old-age pensions value. We look into the evolution of Social Security System total revenues, since there is no statistical information disaggregated only for old-age pensions.
Observing Figure 2.1, we find that the number of old-age pensioners has increased in the last 25 years. As Silva (2006) suggests, we verified in the period under review the extension of coverage of the pension scheme to a larger population, showed by the increase of the number of pensioners
13 from 1 310 375 in 1990 to 1 677 978 in 2005. We should note that increase is also due to the extension of eventualities covered in the system. It becomes evident in the Figure 2.1 a lower pick in 1996, associated to policies related to the uniformity of minimum age to retirement between men and women (age 65) and associated to the change of period of guarantee (from 10 to 15 years).
Portuguese National Institute of Statistic (2006) indicates that there was 2,6 millions of pensioners at the end of 2005, corresponding to a quarter of the resident population, 64% of these people being old-age pensioners.
Figure 2.1 Evolution of the total number of old-age pensioners (in
millions), Portugal, 1990-2005. 1,3 1,4 1,4 1,5 1,5 1,6 1,6 1,7 1,7 1990 1991 1992 1993 1994 1995 1996 1997 1998 1999 2000 2001 2002 2003 2004 2005
Source: Statistical National Institute (2006).
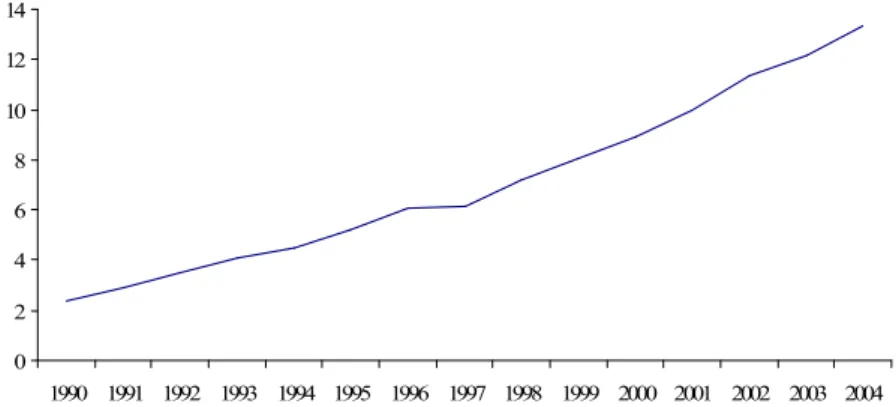
Figure 2.2 Evolution of the total value of old-age pensions (in million
euros), Portugal, 1990-2004. 0 2 4 6 8 10 12 14 1990 1991 1992 1993 1994 1995 1996 1997 1998 1999 2000 2001 2002 2003 2004
14 As Figure 2.2 demonstrates, the value of pensions has been increasing, due to the increase of the number of pensioners and because of the composition effect (this effect is associated to new pensioners entries, whose pension value, on average, is higher than the pensions value received by individuals who leave the system).
The Bank of Portugal (2007) believes that the evolution of the system expenditure results from two factors: the ageing of the population and the general scheme of Social Security based on a PAYG system which has reached a stage of maturity. According to this line of thought, there is a tendency for the number of new beneficiaries of the system (pensioners) to be seen as a growing burden for the number of new contributors (workers). Furthermore, the new pension relates to individuals with full contribution careers. These situations lead to the growth of the average value of new pensions.
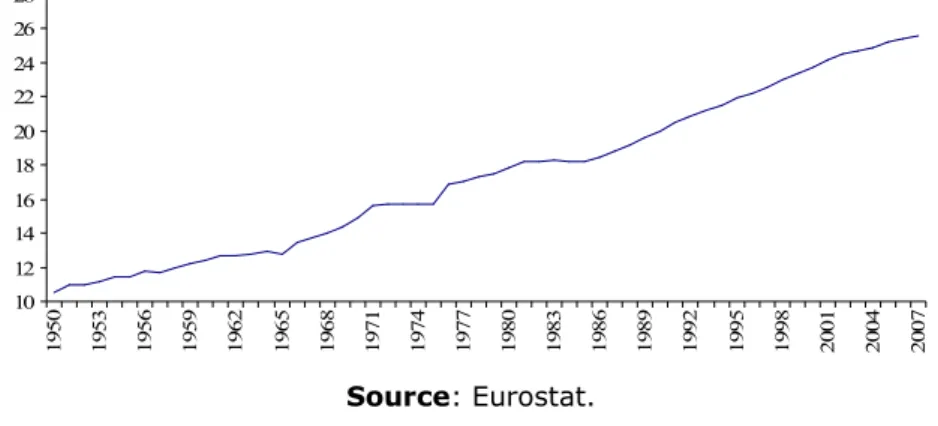
To our research, it is also important to analyse the evolution of the old-age dependency ratio which is measured as the number of people 65 years of age or older for every 100 people of working age (15 to 64 years of age). As availability statistical information, Figure 2.3 shows the deterioration of old-age dependency ratio in Portugal for the period 1950-2007. This decline should result from the strong decline of the youngest population (age 0-24) to almost a half, and from the slight increase of the population aged 25 years and more.
The increase of the ratio between old-age population and total population, indicative of an ageing process, has been worsened by the decrease of young people (caused by the birth rate decline). From the 80s, fertility rates remain well above the natural replacement rate of 2,1 children per woman needed to stabilise the population size and age structure. In Portugal, the Longevity Index (ratio between the population aged 75 and more and the population aged 65 and more) has increased from 39 to 41, in the 1991-2001 period.
15
Figure 2.3 Evolution of the old-age dependency ratio, Portugal, 1950-2007.
10 12 14 16 18 20 22 24 26 28 1 9 5 0 1 9 5 3 1 9 5 6 1 9 5 9 1 9 6 2 1 9 6 5 1 9 6 8 1 9 7 1 1 9 7 4 1 9 7 7 1 9 8 0 1 9 8 3 1 9 8 6 1 9 8 9 1 9 9 2 1 9 9 5 1 9 9 8 2 0 0 1 2 0 0 4 2 0 0 7 Source: Eurostat.
A smaller workforce creates serious difficulties on the sustainability of public finances, as there are fewer contributors to pay the retired people pensions, increasing thereby the relative weight of inactive retired population.
It is also important to analyse Social Security System revenues. There are no disaggregated data revenues for the social protection system associated with old-age from the revenues related to other social protection eventualities, such as unemployment and disability. So we analyse pension revenues as a whole. As Figure 2.4 shows, there is an upward trend in current revenues (which include contributions, transfers and other incomes). The major portion of welfare system revenues is occupied by the contributions and it presents a growing trend.
Figure 2.4 Evolution of current revenues, Portugal, 1960-2005.
0 2.000.000 4.000.000 6.000.000 8.000.000 10.000.000 12.000.000 1 9 9 0 1 9 9 1 1 9 9 2 1 9 9 3 1 9 9 4 1 9 9 5 1 9 9 6 1 9 9 7 1 9 9 8 1 9 9 9 2 0 0 0 2 0 0 1 2 0 0 2 2 0 0 3 2 0 0 4
Contributions Transfers Other Incomes
16 Since it is the employed population who pays the contributions for the system, it would be interesting to analyse its evolution. Figure 2.5 shows an uptrend of the number of the employed population in Portugal, over the period 1998-2007. There is some stability on the evolution of employed population, in the recent decades – this situation would not be favourable to the Social Security finances, since the lower the population growth is the weaker is the contributions growth (and the revenues) for the Portuguese Pension System.
Figure 2.5 Evolution of the employed population, Portugal, 4th quarter of
1998 to 4th quarter of 2007. 4.700 4.800 4.900 5.000 5.100 5.200 5.300 1998 1999 2000 2001 2002 2003 2004 2005 2006 2007
Source: Statistical National Institute (2008).
Therefore the Pension System in Portugal presents serious problems of solvency resulting from the increase in the old-age dependency rate, the low birth rates and the negative trend of fertility rates. In addition, the real economic activity slowdown in recent years, the economic, social and demographic effects of ageing and the maturation of Pension System have been contributing for the deterioration of the Portuguese Social Security financial sustainability. As presented by the Ministry of Labour and Social Solidarity (2006), the actual challenges of Social Security System, in the hypothesis of no policy changes, is to face to an unbalance which would occur in one decade, despite this projection takes into account the using the
17 Social Security Financial Stabilisation Trust Fund (FEFSS: Fundo de
Estabilização Financeira da Segurança Social).
One way to fight the rise of dependency rates could be by betting on the growth of the working population, through immigration. Similarly to the work carried out by Jimeno Serrano (2002a and 2002b) and by Conde-Ruiz, Jimeno Serrano and Valera Blannes (2006), we intend to study in the next Section the effect of immigration on sustainability Pension System in Portugal. For lack of statistical information on age structure of immigration, we decided to investigate what would be the immigration that would provide a solution for the problem of the insolvency of the Portuguese Pension System. So, the objective is to find the number of immigrants required to maintain the value of old-age dependency rate, during the period 2005-2050 (Section 3). Finally, based on the determined optimum flow of immigrants, we examine if these entries guarantee a null or positive Social Security deficit (Section 4).
IMMIGRATION AND OLD-AGE DEPENDENCY RATE
The unsustainability of the Social Security System will cause the inability of the system in responding to the population needs and in improving its benefits or in enlarging the population protection (Mckinnon 2007). So, in this Section, we intend to evaluate the demographic and financial insolvency risks of the Portuguese Pension System. We intend also determine the level of immigration that would be a solution to solve the increasing Portuguese Pension System demographic risk, one of the contributions of this investigation. With this research, we will demonstrate that the necessary immigration to solve the demographic risk in Portugal is well above the more optimistic migration projections, namely those delivered in the EU (2006) report.
We should note that for the benefits of immigrants to be materialised fully, it is important that these immigrants work in formal economy, contributing to the tax and the Social Security system. In addition, to integrate immigrants in the formal economy permits the pension scheme to be closer to the actuarial balance. Furthermore, this integration leads to the
18 use of immigrants´ skills to reduce/remove the needs of Portuguese labour market.
The demographic and financial insolvency risks of the Portuguese Pension System
The old-age dependency rate is the indicator we used to analyse the evolution of the demographic risk of the Portuguese Pension System. Table 3.1 illustrates the initial situation, without immigration. It shows the distribution of the resident population by the following age-groups: individuals aged between 15 and 64 (workforce) and individuals aged 65 and more (old-age). There is a forecast for a shrinking workforce and an increase in the number of old-age individuals over the period 2005 to 2050, which provides an increase of old-age dependency rate from 25% in 2004 to 58% in 2050 (Table 3.1).
Table 3.1 Expected evolution of the number of individuals (in millions)
residents in Portugal, by age-group, and expected evolution of old-age dependency rate, 2005-50. Initial situation 2005 2010 2015 2020 2025 2030 2035 2040 2045 2050 Age (65 and more) 1,8 1,9 2 2,2 2,4 2,6 2,8 3,0 3,2 3,2 (15-64) 7,1 7,1 7,1 7,0 6,8 6,7 6,4 6,1 5,8 5,5 Dependency Rate 25% 27% 29% 32% 35% 39% 44% 49% 55% 58% Source: EU (2006).
To understand the financial consequences of the demographic trends presented on Table 3.1, we will calculate the financial result of the Portuguese Pension System for the period 2005-2050, taking into account the Portuguese population, with the absence of immigration. This financial result reflects the difference between Social Security revenues and expenditures on pensions. We based our research in the following hypothesis:
19 1) We consider, as in the Devesa, Lejárraga and Vidal (1999) study, the conditions of general scheme of Social Security System in Portugal, because it integrates the generality of the people who contributes to the System. According to the Statistical National Institute (2006) about 73% of the Social Protection System pensioners were included in the general scheme.
2) Demographic changes are provided in the EU (2006) report, as shown in Table 3.1.
3) Participation rates by age group will maintain, over the period 2005-2050 at the 2003 level, provided in the EU (2006) report, as shown in Table 3.2.
Table 3.2 Participation rate by age group, Portugal, 2003.
Age Participation rate
(15-24) 45,2% (25-54) 86% (55-64) 53,7%
Source: EU (2006).
4) The likelihoods of survival, presented in Table 3.3, are derived from tables of the evolution of population structure of the EU (2006) report. The likelihood of survival between the moment N and the moment N-1 is calculated as follows: 1 ] 1 , [ − − = N N N N A P PS [1.] : ] 1 , [NN−
PS Likelihood of survival between N and N-1; :
N
P Population aged 65 years and over (pensioners) in N; :
1 −
N
20
Table 3.3 Projections for the likelihood of survival, Portugal, 2010-2050.
Period Likelihood of survival 2010-15 0,29 2015-20 0,31 2020-25 0,34 2025-30 0,38 2030-35 0,42 2035-40 0,47 2040-45 0,52 2045-50 0,56
Source: Authors calculations, based on EU (2006).
5) We assume the youth of immigrant population (Table 3.4): - Population (15-24): 25%; will retire on average within 45 years. - Population (25-40): 40%; will retire on average within 32 years. - Population (40-54): 20%; will retire on average within 18 years. - Population (55-64): 15%; will retire on average within 5 years.
Table 3.4 Immigrant population demographic structure, Portugal, 2005-50
(Hypothesis).
Age Percentage by age group Pensioner in
(15-24) 25% 45 years (25-39) 40% 32 years (40-54) 20% 18 years (55-64) 15% 5 years
Source: Authors calculations.
6) Immigrants will be beneficiaries of the Portuguese Pension System. This hypothesis will result an even higher burden on the system, which would be resolved with the entry of a relatively greater number of active immigrants to finance the increased system difficulties.
7) The monthly remuneration is 909,17euros. According to Ministry of Labour and Social Solidarity (2005), average monthly remuneration for employees was, in 2005, 909,17euros. Employees represented in this year 92,4 % of workers.
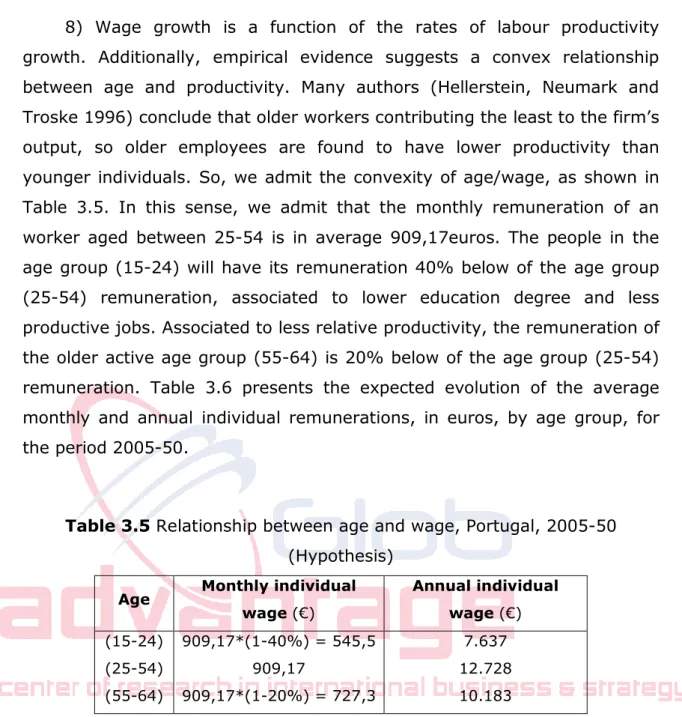
21 8) Wage growth is a function of the rates of labour productivity growth. Additionally, empirical evidence suggests a convex relationship between age and productivity. Many authors (Hellerstein, Neumark and Troske 1996) conclude that older workers contributing the least to the firm’s output, so older employees are found to have lower productivity than younger individuals. So, we admit the convexity of age/wage, as shown in Table 3.5. In this sense, we admit that the monthly remuneration of an worker aged between 25-54 is in average 909,17euros. The people in the age group (15-24) will have its remuneration 40% below of the age group (25-54) remuneration, associated to lower education degree and less productive jobs. Associated to less relative productivity, the remuneration of the older active age group (55-64) is 20% below of the age group (25-54) remuneration. Table 3.6 presents the expected evolution of the average monthly and annual individual remunerations, in euros, by age group, for the period 2005-50.
Table 3.5 Relationship between age and wage, Portugal, 2005-50
(Hypothesis)
Age Monthly individual
wage (€) Annual individual wage (€) (15-24) 909,17*(1-40%) = 545,5 7.637 (25-54) 909,17 12.728 (55-64) 909,17*(1-20%) = 727,3 10.183
Source: Authors calculations, based on Ministry of Labour and Social Solidarity (2005).
9) Following the methodology adopted by Devesa, Lejárraga and Vidal (1999) and by Domínguez-Fabián and Encinas-Goenechea (2007), 15,17% is the value determined for the contribution rate for the Pension System, calculated by the ratio between expenditures and revenues associated to the old-age pensions, provided by the Statistical National Institute (2006).
We adopted the total contribution rate of 34,75%, that corresponds to the contribution rate applied to employees, who as provided by Ministry of Labour and Social Solidarity (2005) in October 2005 represented 92,4% of people at work.
22 Since there is not a value legally established, we suppose that from the total contribution rate for all different eventualities applied to general scheme (sickness, disability, old-age, survival, family, unemployment, housing and social exclusion) of 34,75%, 15,17% is to old-age pensions. We suppose also that this rate is constant in the period. Devesa, Lejárraga and Vidal (1999) use the contribution rate of 14%, Jimeno and Licandro (1999) use 15% and Durán (1995) uses 24,8%, even though this latest study includes old age pension and disability and survival pensions.
10) Pension System revenue is obtained each year by the product of the contribution rate to the Pension System for the total salary for each year.
11) Pensions grow with the index of consumer prices without housing (2%).
12) The financial result of the Pension System reflects the difference between its revenues and its expenditures for each five years (Equation 2).
∑
∑
− = j j i i C W P R T A RES [2] :RES Financial Result of the Pension System at the moment N; :
A Number of persons in active age (contributors for the system);
C
T : Contribution Rate for the Pension System;
i
W : Monthly Remuneration for each active person i; P: Number of Pensioners (beneficiaries for the system);
j
R
: Average Annual Old-Age Pension for each Pensioner j.Considering the hypothesis assumed, we will calculate the financial result of the Pension System in each of five of the period 2005 to 2050. We present Table 3.6 which illustrates the projections for the financial results of Portuguese Pension System for the period 2005-2050, taking into account only Portuguese population. As provided by Ministry of Labour and Social Solidarity (June 2006), the financial disequilibrium of the system will occur in 2015, when expected revenues (contributions) will become insufficient to deal with the expected expenditures (pensions). It is foreseen that by 2015
23 and by the end of the period under review, the system will remain in deficit, which in 2050 would exceed 10 million euros.
Table 3.6 Expected evolution of the financial result of the Pension System
in Portugal, nationals, 2005-2050.
2005 2010 2015 2020 2025 2030 2035 2040 2045 2050 National population by age group
(15-24) 0,9 0,9 0,9 0,9 0,9 1,0 0,9 1,1 1,0 1,0
(25-54) 3,9 4,0 4,0 3,8 3,6 3,4 3,2 3,1 3,0 2,9
(55-64) 0,3 0,3 0,3 0,3 0,3 0,3 0,3 0,0 0,0 0,0
Total
(millions) 5,1 5,2 5,1 5,0 4,8 4,7 4,5 4,2 4,0 3,9
Nationals average annual remuneration by age group
(15-24) 7.637 7.683 7.797 7.828 7.828 7.828 7.767 7.767 7.767 7.767 (25-54) 12.728 12.805 12.996 13.047 13.047 13.047 12.945 12.945 12.945 12.945 (55-64) 10.183 10.244 10.397 10.437 10.437 10.437 10.356 10.356 10.356 10.356 Total remuneration (million €) 59.672 61.136 61.175 59.594 57.288 55.199 52.134 48.827 46.830 45.451 Revenues in contributions (million €) 9.049 9.271 9.277 9.038 8.688 8.371 7.906 7.405 7.102 6.893 Number of Pensioners (millions) 1,8 1,9 2,0 2,2 2,4 2,6 2,8 3,0 3,2 3,2 Average annual pension value by pensioner (€) 4.380 4.468 4.557 4.648 4.741 4.836 4.933 5.031 5.132 5.235 Pension expenditures (million €) 7.818 8.461 9.302 10.241 11.262 12.625 13.803 15.109 16.280 16.971 Nationals financial result (million €) 1.231 810 -24 -1.203 -2.574 -4.255 -5.897 -7.704 -9.179 -10.078
Source: Authors calculations, based on EU (2006).
Immigration that eliminates the demographic risk
We intend to define the number of immigrants required to ensure the maintenance of dependency rate observed in 2004 (25%) over the period 2005-2050, based on the projections made by EU (2006) about the number and the structure of population in that period. So, the objective is to determine the immigration flows which guarantee that, on average, the contributions of each active person can pay the pensions of four old-age persons.
24 Table 3.7 presents the required changes of Portuguese population age structure and the necessary increase of population to maintain the dependency rate at the 2004 level.
It seems that to maintain dependency rate it will be necessary to nearly double the workforce in the period of 2005-2025, that is, from 7,1 to 15,5 million individuals. Between 2025 and 2050, it will be necessary to have about 700 million of individuals entering the country. It should be noted that these numbers for the immigrants entries are social, demographic and economically impossible to realize, especially those presented in the last decades of the period under review.
Table 3.7 Expected evolution of the number of individuals (in millions)
residents in Portugal, by age-group, constant old-age dependency rate, 2005-50.
Constant dependency rate
2005 2010 2015 2020 2025 2030 2035 2040 2045 2050 Age (65 and more) 1,8 1,9 2,2 2,7 3,9 6,6 12,5 27,2 66,7 178,7 (15-64) 7,1 7,5 8,6 10,9 15,5 26 49,6 107,6 263,9 707,6 Dependency ratio 25% 25% 25% 25% 25% 25% 25% 25% 25% 25% Change of the populations to maintain dependency rate 0,4 1,5 3,9 8,7 19,4 43,2 101,5 258,1 702
Source: Authors calculations, based on EU (2006).
Comparing these results with the projections for immigration made by EU (2006), there is an evident and significant gap in the required number of immigrants, highlighting the fact that the expected immigration is well below requirement to solve the demographic risk that the Portuguese Pension System is subject to.
Since we have determined, for the period 2005-50, the level of immigrant fluxes that could eliminate the demographic risk, we will in the next Section evaluate if this volume of population could solve the financial
25 insolvency problem of the Portuguese Pension System, and if not, what number of immigrants should enter in Portugal to guarantee the actuarial balance between expenditures and revenues.
Optimal flows of immigration
In this Section, the objective is to determine the level of immigration that would eliminate the financial insolvency risk, over the period 2005-2050, based on the projections made by EU (2006). We present the financial situation of the system with migratory flows.
If we control the dependency rate, we eliminate the demographic risk of the system. Nevertheless, to promote the sustainability of the Pension System it is necessary to have financial balance, what means a null deficit, since there is a PAYG System in Portugal. Thus, we looked into the optimum number of immigrants that will ensure until 2050 a null result of the Pension System, considering the hypothesis assumed that immigrants wages corresponds to 60% of the Portuguese wages. The combination of contributions and benefits by national and immigrants will reflect the financial result of the Portuguese Pension System, over the period 2005-2050.
Table 4.1 shows the projections about the evolution of result of Pension System in Portugal provided by national residents and by the integration of the migrants that ensure the maintenance of dependency rate in the system, in the period 2005-2050, and shows the final result, for each 5 years. Analysing the results, we conclude that immigrants are net taxpayers for the system and that their entries will reverse the negative results associated to nationals. Otherwise the contributions of migrants would be insufficient to cover their future pension entitlements, promoting the funding of Pension System potentially not sustainable. We realize also that the number of migrants that permit to eliminate the demographic risk would cause high surplus. Thus, these results are not relevant to the Portuguese economy as we have a PAYG System whose objective is financial balance between revenues and expenditures.
26 As we do not have yet an optimum number of immigrants to solve the unsustainability system, the next step is to investigate the number of immigrants that determine a null result for the system, until 2050.
Table 4.2 presents the expected evolution of the financial result of the Pension System in Portugal provided by nationals and by the integration of the number of immigrants, that ensure at each five years a null financial result, over the period 2005-2050. Comparing the entries calculated when the dependency rate remains constant (Table 4.1) with the contributions of immigrants presented in Table 4.2, in the latter scenario migration flows throughout the period under review are much lower. Still, despite the entries being in smaller number, immigration continues to contribute positively to the system and to counteract the deficits caused by nationals. We should note that, although the immigration is now much reduced, the number of immigrants needed to achieve the sustainability of the system is growing with time. Nevertheless, the required immigrants that guarantee the solvency continue to be well over the immigration projections made by the EU (2006).
27
Table 4.1 Expected evolution of the financial result of the Pension System
in Portugal, nationals and immigrants, constant dependency rate, 2005-2050.
2005 2010 2015 2020 2025 2030 2035 2040 2045 2050 Immigrant population by age group
(15-24) 0,1 0,4 1,0 2,2 4,8 10,8 25,4 64,5 175,5 (25-54) 0,2 0,9 2,3 5,2 11,6 25,9 60,9 154,8 421,2 (55-64) 0,1 0,2 0,6 1,3 2,9 6,5 15,2 38,7 105,3 (65+) 0,0 0,0 0,1 0,2 0,6 1,6 3,9 10,9 30,4 Total (millions) 0,0 0,4 1,5 3,9 8,7 19,4 43,2 101,5 258,1 702,0
Immigrants average annual remuneration by age group
(15-24) 0 4.610 4.678 4.697 4.697 4.697 4.660 4.660 4.660 4.660 (25-54) 0 7.683 7.797 7.828 7.828 7.828 7.767 7.767 7.767 7.767 (55-64) 0 6.146 6.238 6.262 6.262 6.262 6.213 6.213 6.213 6.213 Total remuneration (million €) 0 2.483 10.115 26.492 59.438 131.802 292.139 685.606 1.744.189 4.743.715 Revenues in contributions (million €) 0 376 1.534 4.018 9.014 19.988 44.303 103.974 264.510 719.395 Number of immigrant pensioners (millions) 0,02 0,07 0,22 0,62 1,60 3,93 10,90 30,40 Pension expenditures (million €) 0 0 7,27 37,00 119,27 330,67 865,73 2.287,1326.485,4617.953,36 Immigrants financial result (million €) 0 376 1.527 3.981 8.895 19.657 43.438 101.686 238.025 701.441 Nationals result + Immigrants result (million €) 1.231 1.187 1.502 2.777 6.321 15.403 37.541 93.982 228.846 691.363
28
Table 4.2 Expected evolution of the financial Result of the Pension System
in Portugal, nationals and immigrants, null result, 2005-2050.
S 2005 2010 2015 2020 2025 2030 2035 2040 2045 2050
National population by age group
(65 and more) 1,8 1,9 2,0 2,2 2,8 3,7 4,9 6,4 8,4 10,5 (15-64) 7,1 7,1 7,1 8,1 9,3 10,9 12,3 14,0 15,3 16,4 Dependency rate 25% 27% 29% 27% 30% 34% 40% 46% 55% 64% Change of the populations to financial result = 0 (million €) 0,0 0,0 0,0 1,2 2,5 4,2 5,9 7,8 9,5 10,8
Immigrants average annual remuneration by age group
(15-24) 4.582,2 4.609,7 4.678,4 4.696,8 4.696,8 4.696,8 4.660,1 4.660,1 4.660,1 4.660,1 (25-54) 7.637,0 7.682,9 7.797,4 7.828,0 7.828,0 7.828,0 7.766,9 7.766,9 7.766,9 7.766,9 (55-64) 9.164,4 6.146,3 6.237,9 6.262,4 6.262,4 6.262,4 6.213,5 6.213,5 6.213,5 6.213,5 Total remuneration (million €) 0,0 0,0 158,5 7.934,4 16.997,8 28.572,0 40.039,0 52.983,2 64.270,7 73.236,6 Revenues in Contributions (million €) 0,0 0,0 24,0 1.203,3 2.577,8 4.333,0 6.072,0 8.035,0 9.746,8 11.106,5 Number of Immigrant Pensioners (millions) 0,0 0,0 0,0 0,0 0,1 0,2 0,3 0,6 1,2 1,9 Pension Expenditures (million €) 0,0 0,0 0,0 0,4 3,2 78,5 175,3 330,9 568,4 1.028,4 Immigrants Financial Result (million €) 0,0 0,0 24,0 1.202,8 2.574,6 4.254,5 5.896,7 7.704,1 9.178,3 10.078,1 Financial Result (Nationals + Immigrants) (million €) 1.231 810 0 0 0 0 0 0 0 0
Source: Authors calculations, based on EU (2006).
Conclusions
From the foregoing it appears that in Portugal, over the period 2005-2050, a decrease of workforce and an increase of old-age persons are
29 eminent, which provides for the doubling of the dependency rate. As a result the system is not financially sustainable in the medium and long terms and it is expected that the system will slip into a growing deficit in 2015, when expenditures will overcome its revenues. Hence, the system is subject to a demographic risk and to a financial insolvency risk.
Immigration could be a solution to the unsustainability of Pension System. The maintenance of the dependency rate at the 2004 level (25%) would imply an immigrant flux of approximately 9 millions in 2025 and 702 millions in 2050. It should be noted that these numbers for the immigrants entries are social, demographic and economically impossible to realize.
Nevertheless, if on the one hand the immigration eliminates the demographic risk it also leads to the existence of overly high positive results of the system as Portugal has a PAYG System. We conclude that to combat the insolvency risk there will have to 0,1 million immigrant in 2025 and 1,9 millions in 2050. So, the number of immigrants that guarantees a null financial result is much lower than one that eliminates the demographic risk. Still, compared with the EU (2006) projections, these figures are quite a lot higher and show an upward trend during the period under review, therefore, contrary to the expected trend by that European entity.
Despite the fact that the findings are interesting and confirm the empirical evidence, we should enhance a possible sensibility from the results due to a lack of statistical data. In this sense, it would be interesting to explore the sensibility of the hypothesis took. It would also be interesting to quantify the insolvency risk with the help of other methodologies such as Internal Rate Return.
We should note that for the benefits of immigrants to be realised, it is important that migrants work in formal economy, contributing therefore to the host country Social Security system. However, in practice, in many countries, immigrants tend to have lower employment rates than EU nationals, and their unemployment rates are approximately three times higher than average. «Therefore, a key the challenge is to better integrate immigrants in the society» (EU 2006).
30
References
Alonso Meseguer, J., and J. A. Herce (2003). «Balance del sistema de pensiones y boom migratorio en España. Nuevas proyecciones del modelo MODPENS a 2050». In FEDEA DT, n. 2003-02, Madrid.
Alonso Meseguer, J., and J. I. Conde-Ruiz (2007). «Reforma de las pensiones: la experiencia internacional». In FEDEA DT, n. 2007-18, Madrid.
Alto Comissariado para a Imigração e as Minorias Étnicas (2005).
«Estatísticas da imigração».
http://www.ieei.pt/files/Estatisticas_GEE_2005.pdf, obtido em 7 de
Outubro de 2007.
Bank of Portugal (2007). «Relatório do Conselho de Administração 2006».
http://www.bportugal.pt, obtido em 5 de Maio de 2008.
Borjas, G. (1994). «The economic benefits from immigration». In NBER
Working Paper Series, n. 4955.
Branco, R., and C. Gonçalves (2001). «Demographic, social and economic aspects of older persons in Portugal». Communication presented in European Population Conference 2001, Helsinki, 7-9 June 2001.
Brancós, I., and A. Domingo (2000). «Migracions, de reemplaçament o complementaries?». Quaderns de Serveis Socials, n. 17: 18-23.
Carrilho, M. J. (2005). «A situação demográfica recente em Portugal».
Revista de Estudos Demográficos, n. 38.
Cebrián Lopez, I., et al. (2007). «Análisis comparativo de las trayectorias laborales de las mujeres nacionales e inmigrantes: un análisis sobre los movimientos de las vidas laborales». Communication presented in VII Jornadas de Economía Laboral, Las Palmas de Gran Canaria, Universidad de las Palmas de Gran Canaria, 12-13 July 2007.
Conde-Ruiz, J. I., J. Jimeno Serrano and G. Valera Blanes (2006). «Inmigración y pensiones: qué sabemos?». Fundación BBVA, n. 2.
Devesa, J. E., A. Lejárraga and C. Vidal (1999). «La viabilidad financiera del sistema de pensiones de reparto: aplicación a la contingencia de
31 jubilación del régimen general de la Seguridad Social española». In Instituto Valenciano de Investigaciones Económicas, S.A. Working Paper-EC 99-16, First Edition.
Domínguez-Fabián, I., and B. Encinas-Goenechea (2007). «Inmigración y solvencia financiera del sistema público de pensiones español». Communication presented in Jornadas de Usuarios de la Muestra Continua de Vidas Laborales (Jornadas MCVL), Madrid, FEDEA, 4-5 October 2007.
http://www.fedea.es/pub/otros/MCVL-inmigracion.pdf, 23/10/2007.
Durán, A. (1995). «Rentabilidad de lo cotizado para pensiones».
Economistas, n. 68: 10-18.
European Commission (2004). «How the Sustainability of Public Finances was Assessed on the Basis of the 2003 Updates of the Stability and Convergence Programmes». Note for the Attention of the Economic Policy Committee, ECFIN/155/04-EN, March 15.
European Economy (2006). «The impact of ageing on public expenditure: projections for the EU25 member states on pensions, health care, long-term care, education and unemployment transfers (2004-2050)». Brussels: European Commission, Special Report n. 1/2006.
http://ec.europa.eu/economy_finance/publications/european_economy/200
6/eespecialreport0106_en.htm, 16/10/2007.
Haug, W. (2002). «The demography of immigrant population in Europe». In
European Population Papers Series, 8, Estrasburgo: Council of Europe,
European Population Comité.
Hellerstein, J. K., D. Neumark and K. R. Troske (1996). «Wages, productivity and worker characteristics: evidence from plant level production function and wage equations». In NBER Working Paper Series, 5626.
Instituto Nacional de Estatística (2006). «Anuário Estatístico 2005», volume I.
32
http://www.ine.pt/xportal/xmain?xpid=INE&xpgid=ine_publicacoes&PUBLIC
ACOESpub_boui=375507&PUBLICACOESmodo=2 obtido em 7 de
Novembro de 2007.
International Monetary Fund (2004). «Pension Reform Issues in Portugal» Chapter IV in Portugal: Selected Issues, IMF Country Report No. 04/81, 42-62, March.
Izquierdo, M., and J. F. Jimeno (2005) «Inmigración: Desarrollos Recientes y Consecuencias Económicas». Boletín Económico del Banco de España, 2005-2: 39-50.
Jimeno Serrano, J. F. (2002a). «Demografía, empleo, salarios y pensiones». In FEDEA DT 2002-2004, Madrid.
Jimeno Serrano, J. F. (2002b). «Incentivos y desigualdad en el sistema español de pensiones contributivas de jubilación». In FEDEA DT
2002-2013, Madrid.
Jimeno Serrano, J. F., and O. Licandro (1999). «La Tasa Interna de Rentabilidad y el Equilibrio Financiero del Sistema Español de Pensiones de Jubilación». Investigaciones Económicas. XXIII, n. 1: 129-143.
Léon Salas, B. (2005). «La Contribución Demográfica de la Inmigración: el caso de España». Política y Cultura, Primavera, n. 23: 121-143.
Martinho, R. (2006). «Os Riscos da Longevidade». Cadernos de Economia, n. 74: 20-25.
Mckinnon, R. (2007). «Pensiones de vejez financiadas con cargo a los impuestos en países de ingresos bajos». In Evolución y Tendencias: Una
Seguridad Social Dinámica, Chapter 5, Asociación Internacional de la
Seguridad Social, Foro Mundial de la Seguridad Social, 29ª Asamblea General de la AISS, 2007, 33-40.
Mendes, F. (2006). «Pensões sem Ilusões». Cadernos de Economia, n. 74: 32-36.
Ministério do Trabalho e da Solidariedade Social (2005). «Quadros de pessoal - 2005».
33 Ministério do Trabalho e da Solidariedade Social (2006). «Medidas de
reforma da Segurança Social».
http://www.portugal.gov.pt/NR/rdonlyres/232EE9AD-530F-4D0D-A2E0-0A08CCDFF9BF/0/Analise_SustentabilidadeSegSoc_Longo_Prazo.pdf,
9/10/2007.
Niessen, J., and Y. Schibel (2002). «Demographic changes and the consequences for Europe’s future - Is immigration an option?». MPG – Migration Policy Group.
Peixoto, J. (2002). «A Imigração em Portugal».
http://www.apdemografia.pt/boletim3.pdf, 6/10/2007.
OECD (2004) Economic Survey – Portugal 2004.
Organização das Nações Unidas (2000). «Replacement migration: Is it a solution to declining and ageing populations?», New York, ONU, Department of Economic and Social Affairs, Population Division.
http://www.un.org/esa/population/publications/migration/execsum.pdf,
2/10/2008.
Rojas, J. A. (2002). «Immigration and the pension system in Spain». In
Economics Series Universidad Carlos III de Madrid, n. 16, WP 02-39.
http://docubib.uc3m.es/WORKINGPAPERS/WE/we023916.pdf, 2/10/2008.
Rosa, M. J., H. Seabra and T. Santos (2003). Contributos dos “Imigrantes”
na Demografia Portuguesa – O Papel das Populações de Nacionalidade Estrangeira. Lisboa: ACIME.
Rosa, M. J., H. Seabra and T. Santos (2004). Contributos dos Imigrantes
para a Demografia Portuguesa. Lisboa: ACIME.
Silva, A. (2006). «A Segurança Social e as suas Sustentabilidades»
Cadernos de Economia, n. 74: 26-30.
Statistical National Institute (2002). «Anuário estatístico de Portugal 2001».
http://www.ine.pt/xportal/xmain?xpid=INE&xpgid=ine_publicacoes&PUBLIC
34 Statistical National Institute (2006). «Anuário estatístico 2005». Volume I.
http://www.ine.pt/xportal/xmain?xpid=INE&xpgid=ine_publicacoes&PUBLIC
ACOESpub_boui=375507&PUBLICACOESmodo=2, 7/11/2007.
Statistical National Institute (2008). «Estatísticas do emprego».
http://www.ine.pt/xportal/xmain?xpid=INE&xpgid=ine_publicacoes&PUBLIC ACOESpub_boui=12646031&PUBLICACOEStema=55574&PUBLICACOES
modo=2, 7/11/2007.
Wattelar, C., and G. Roumans (1991). «Objectifs démographiques et migrations: quelques simulations». In Les Migrations. Aspects
35
Os autores
Tânia Cristina Simões de Matos dos Santos
Doutorada em Economia Financeira e Contabilidade pela Universidad de Extremadura, Espanha e mestre pela Universidade de Coimbra. É Assistente no Instituto politécnico de Leira, desde 2005. Tem publicado artigos e participado em conferências relacionadas com a temática dos sistemas de pensões. É investigadora no Centro de Investigação GlobAdvantage do Instituto Politécnico de Leiria.
E-mail: tania.santos@ipleiria.pt
Inmaculada Domínguez Fabián
Professora titular da Universidade de Extrematura – Espanha. E-mail: idomingu@unex.es