___________________________
1This paper is part of the second author’s Masters Thesis financed by CNPq. 2 Universidade Federal de Viçosa - UFV
3 Universidade Federal da Grande Dourados - UFGD 4 Universidade Federal de Viçosa - UFV
5 Universidade Federal de Viçosa - UFV
Recebido pelo Conselho Editorial em: 9-9-2013
INTENSITY, DURATION AND FREQUENCY IN THE MATO GROSSO DO SUL STATE
SILVIO B. PEREIRA1, CARLOS P. Z. NÓIA2, RAFAEL A. ALMEIDA3,
CLÍVIA D. COELHO4
ABSTRACT: Due to the lack of information concerning maximum rainfall equations for most locations in Mato Grosso do Sul State, the alternative for carrying out hydraulic work projects has been information from meteorological stations closest to the location in which the project is carried out. Alternative methods, such as 24 hours rain disaggregation method from rainfall data due to greater availability of stations and longer observations can work. Based on this approach, the objective of this study was to estimate maximum rainfall equations for Mato Grosso do Sul State by adjusting the 24 hours rain disaggregation method, depending on data obtained from rain gauge stations from Dourado and Campo Grande. For this purpose, data consisting of 105 rainfall stations were used, which are available in the ANA (Water Resources Management National Agency) database. Based on the results we concluded: the intense rainfall equations obtained by pluviogram analysis showed determination coefficient above 99%; and the performance of 24 hours rain disaggregation method was classified as excellent, based on relative average error WILMOTT concordance index (1982).
KEYWORDS: intense rainfall, rainfall disaggregation, weather stations.
AJUSTE DE METODOLOGIA E DETERMINAÇÃO DAS EQUAÇÕES DE
INTENSIDADE, DURAÇÃO E FREQUÊNCIA DA PRECIPITAÇÃO PLUVIAL MÁXIMA PARA O ESTADO DE MATO GROSSO DO SUL
RESUMO: Devido à carência de informações relativas às equações de precipitação máxima para a maioria das localidades do Estado de Mato Grosso do Sul, a alternativa para a realização de projetos de obras hidráulicas tem sido utilizar informações de postos meteorológicos mais próximos da localidade na qual o projeto é realizado ou fazer uso de metodologias alternativas, tal como o método de desagregação de chuvas de 24 horas, a partir de dados pluviométricos em função da maior disponibilidade de estações e maior tempo de observações. Com base nesse enfoque, o objetivo do trabalho foi estimar as equações de precipitação máxima para o Estado de Mato Grosso do Sul por meio do ajuste da metodologia de desagregação de chuvas de 24 horas, em função dos dados obtidos das estações pluviográficas de Dourados e de Campo Grande. Para tanto, foram utilizados dados consistidos em 105 estações pluviométricos, disponíveis no banco de dados da ANA. Com base nos resultados, foi possível concluir: as equações de chuvas intensas obtidas pela análise de pluviogramas apresentaram coeficiente de determinação acima de 99%; e o desempenho do ajuste da metodologia de desagregação de chuvas de 24 horas foi classificado como ótimo, com base no erro médio relativo ao índice de concordância de WILMOTT (1982).
INTRODUCTION
Knowledge of the quantities characterizing a rainfall that relates the intensity, duration and frequency (IDF), also known as intense rainfalls equation, shows great technical interest in hydraulic structures projects, such as weir dimensioning, watercourse rectification, sewers, drainage systems, among others (PRUSKI et al., 2006; SANTOS et al., 2009).
A research, performed under an agreement between the Sanitation Company of Minas Gerais (COPASA) and the Federal University of Viçosa (UFV), under the Support Foundation of UFV (FUNARBE), set theoretical models of probability distribution to the intense rainfall data for 193 rain gauge stations in Minas Gerais State and at boundaries between Bahia and Espírito Santo States. The adjusted parameters of intensity, duration and frequency equations showed high variability; thus, demonstrating the importance of obtaining intense rain equation for each location (FREITAS et al., 2001).
Due to the lack of information concerning intense rain equations for most Brazilian locations, an alternative to perform hydraulic structure projects has been using information from weather stations nearest the location in which the project is carried out. This procedure, however, can lead to unreliable estimates (PEREIRA et al., 2007; SILVA et al., 2003; SILVA et al., 2002).
Some methods have been developed in Brazil to obtain shorter rains from daily rainfall records, due to existence of a vast rainfall network installed, mainly to serve power generation sector. The methods use multiplicative coefficients, among which the 24 hours rain disaggregation method stands out (CETESB, 1986; OLIVEIRA et al., 2008).
Studies conducted based on annual pluviometric and rain gauge data series, observed simultaneously in São Paulo, showed that average rain heights, of one or two days, can be considered a fairly representative estimate of 24-hour-rainfall of same frequency. They also observed that regardless of return period, there is a constant relationship between 24-hour-rainfalls and one-day-rainfalls, whose value was 1.14 (PINTO et al., 1996).
GENOVEZ & ZUFFO (2000), cited by SANTOS et al. (2009), however, concluded that the methods based on the relationship among intense rainfall of different durations have regional validity. According to the authors, it is convenient to establish new coefficients that are related to local microclimates, for local estimates.
Besides the intense rainfall equation method, it is of fundamental importance to adjust methods that enable equation estimations from daily rainfall data due to greater availability of pluviometric stations and longer observations, so that maximum average rainfall intensity for locations out of rain gauge stations can estimated accurately. However, there are several works with direct application of alternative methods, such as FIETZ et al. (2010); FIETZ & COMUNELLO (2007); GARCIA (2010); OLIVEIRA et al. (2008); and SANTOS et al. (2009).
Based on this approach, the objectives of this work were to obtain the maximum rainfall equations for the cities of Dourado and Campo Grande, located in Mato Grosso do Sul State. In addition, determine intensity, duration and frequency equations by fitting 24-hour rain disaggregation method into data obtained by Dourados and Campo Grande.
MATERIAL AND METHODS
TABLE 1. Geographical coordinates of the weather stations and collection period of rainfall data used in the estimation of maximum average rainfall for Dourados-MS and Campo Grande-MS, Brazil.
City Weather station Latitude Longitude Period
Dourados: Embrapa (CPAO) 22º16’S 54º49’W
1979-1990 1991-2004
Universidade Federal da Grande Dourados (UFGD) 22º11’S 54º55’W 2004-2010
Campo Grande: Instituto Nacional de Meteorologia (INMET) 20º27’S 54º38’W 1973-1985 1993-1998
2000-2009
The equation used to relate rainfall intensity, duration and frequency showed the form described by VILLELA & MATTOS (1975).
The phase of the rainfall data acquisition started with the selection of pluviograms containing the most torrential rains by each year. Maximum annual rainfalls were determined for durations of 10, 30, 60, 120, 360 and 1440 min. By dividing the maximum rainfall heights with the corresponding duration, we obtained maximum annual rainfall intensity for each duration.
Annual maximum intensity series for each duration were adjusted to the Gumbel extreme value distribution. The distribution parameters were estimated by maximum likelihood method and data adherence to the theoretical distribution assessed by Kolmogorov-Smirnov test at 20% probability.
Using non-linear adjustment technique based on maximum annual rainfall intensity values, in return periods 2, 5, 10, 20, 50 and 100 years and the different studied durations, we obtained IDF equation parameters.
To compare the 24-hour rainfall disaggregation method with the pluviogram analysis method (standard method); primary the first method was used without changing multiplicative coefficients, as proposed by the Department of Electricity and Water / Basic Sanitation and Technology Center (DAEE / CETESB 1980), in the cities of Dourados and Campo Grande. This method adopts an average factor of 1.14 to convert maximum rainfall into 1 day, that is, from Gumbel distribution method into 24 hour-rainfall; for the remaining rainfall duration times, coefficients are employed according to the aforementioned method, allowing to generate enough points to define IDF equation related to different return periods.
Settings of probability distributions, such as completion of adhesion test, were made similarly to data obtained by pluviogram analysis method, as described by PEREIRA et al. (2007).
Results obtained by intense rainfall equations adjusted by 24-hour rainfall disaggregation method were compared with those obtained by the pluviogram analysis. Method performance was evaluated by relative error and concordance index proposed by WILLMOTT (1981). We also used performance analysis criterion proposed by CAMARGO & SENTELHAS (1997).
For adjusting the 24-hour rainfall disaggregation, and therefore obtaining the relationship between rainfall heights by each duration, rainfall height values in different durations were divided by maximum 24-hour rainfall height. Therefore, coefficients, which allowed conversion of the local 24-hour rainfall height with durations of 10, 30, 60, 120, 360 and 1440 min, were obtained. Multiplicative coefficients representing each duration were obtained by geometric mean of the analyzed period.
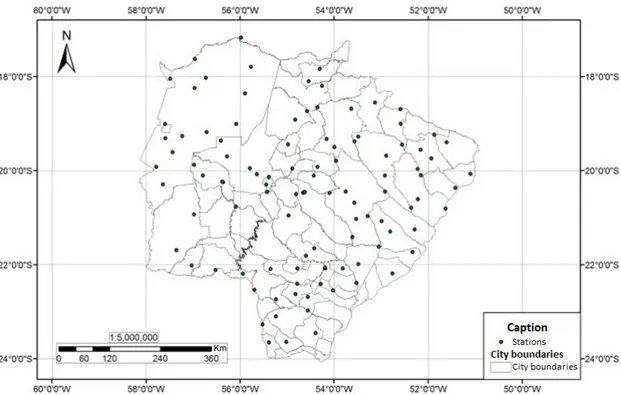
After adjusting alternative method, we proceeded to implementation. Then, we selected historical data series of daily rainfall from pluviometric stations located in the State, which were obtained from Hydrological Information System of the National Water Agency (Hidroweb) (ANA, 2013). Subsequently, data were subjected to a consistency analysis and locations whose series had less than 12 years of complete observations were eliminated, resulting in 105 pluviometric stations (Figure 1).
FIGURE 1. Spatial distribution of rainfall stations used in the study, in Mato Grosso do Sul State, Brazil.
For each pluviometric station the historical series of maximum annual values were set by applying multiplicative coefficients adjusted for the 24-hour rainfall disaggregation method and, after the procedure described above, obtaining the IDF equations of rainfall for each pluviometric station.
For spatial distribution of rainfall intensity data expected in Mato Grosso do Sul, we used ArcGIS software with the inverse interpolation of power distance (IPD), considering a 20-year return period, with 30 and 1440 min durations. Although agricultural projects often make hydrological predictions with a 10-year return period (SCHWAB et al., 1966, citado por PRUSKI, 2009; CRUCIANI, 1980), in studies in Southern Minas Gerais, the most advisable return period to implement hydroagricultural projects was 20 years (EUCLYDES, 1987).
RESULTS AND DISCUSSION
Figure 2 shows the frequency distribution of maximum annual rainfall observed and estimated using Gumbel model for Dourados-MS and Campo Grande, respectively. We might see that Gumbel distribution in the studied areas was adequate to estimate maximum rainfall, where there is good adhesion between observed and theoretical distribution.
FIGURE 2. Frequency distribution of observed and estimated maximum rainfall by Gumbel model, wherein: a) Dourados-MS, Brazil; and b) Campo Grande-MS, Brazil.
Analyzing determination coefficient (r2) in Table 2, we observed that generated equations allow calculating maximum rainfall intensity at different durations and return periods, with great accuracy.
TABLE 2. Intensity maximum average rainfall equations (im), in mm h-1; depending on the return period (T), in years; and rainfall duration (t), in minutes; for Dourados-MS and Campo Grande-MS, in Brazil.
Station Equation r2 Analyzed period
Dourados 0.88
18 . 0 ) 14 . 28 ( 13 . 2455 + = t T
im 0.992 1979 - 1990
1992 - 2010
Campo Grande 0.93
16 . 0 ) 87 . 19 ( 12 . 2575 + = t T
im 0.997
1973-1985 1993-1998 2000-2009
Table 3 presents maximum rainfall intensities for 10, 30, 60, 120, 360 and 1440 minute durations within return periods of 2, 5, 10, 20, 50 and 100 years; which were obtained through pluviogram analysis (standard method), 24-hour rainfall disaggregation as proposed by DAEE/CETESB (1980), and multiplicative coefficients of the 24-hour method adjustment. They were applied to evaluate rainfall disaggregation method performance compared with standard method by means of relative mean error (EMR) and concordance index proposed by WILMOTT (1982).
The standard method achieved excellent performance with respect to Gumbel estimation, with average concordance index of 0.97 for Dourados, and amplitude from 0.94 (duration 1440 min) to 0.99 (durations of 10 and 30 min); and for Campo Grande, average of 0.99, and amplitude from 0.97 (duration 1440 min) to 0.99 (other durations).
TABLE 3. Analysis of rainfall intensities calculated by the ratio between intensity, duration and frequency, obtained by standard method (pluviograms analysis)-(IDF1); 24-hour rainfall disaggregation proposed by DAEE/CETESB (1980)-(IDF2); 24-hour rainfall disaggregation with coefficients - (IDF3); Relative Mean Error (RME) compared with Gumbel method; and concordance index (d), for stations in Dourados-MS and Campo Grande-MS, Brazil.
DOURADOS
Duration RP GUMBEL IDF1 RME1 d IDF2 RME2 d IDF3 RME3 d
(min) (years) (mm/h) (mm/h) (%) (mm/h) (%) (mm/h) (%)
10 2 106.48 111.29 4.52 85.47 -23.20 116.81 4.96
10 5 137.58 131.22 -4.63 105.53 -19.57 142.50 8.60
10 10 158.18 148.63 -6.04 0.99 123.78 -16.72 0.93 165.62 11.43 0.91
10 20 177.93 168.35 -5.39 Great 145.18 -13.76 Great 192.50 14.34 Great
10 50 203.50 198.49 -2.46 179.26 -9.69 234.83 18.31
10 100 222.67 224.83 0.97 210.25 -6.48 272.94 21.40
30 2 70.08 76.67 9.40 51.52 -32.80 77.78 1.45
30 5 91.37 90.40 -1.06 63.61 -29.63 94.89 4.96
30 10 105.47 102.39 -2.91 0.99 74.61 -27.13 0.79 110.28 7.71 0.94
30 20 118.99 115.98 -2.53 Great 87.51 -24.54 Very 128.18 10.52 Great
30 50 136.49 136.74 0.19 108.05 -20.98 good 156.37 14.35
30 100 149.60 154.89 3.54 126.74 -18.18 181.74 17.34
60 2 45.77 53.08 15.97 34.32 -35.34 51.62 -2.75
60 5 64.84 62.58 -3.49 42.37 -32.29 62.97 0.63
60 10 77.47 70.89 -8.50 0.96 49.70 -29.89 0.75 73.19 3.26 0.97
60 20 89.58 80.29 -10.37 Great 58.29 -27.40 Good 85.07 5.95 Great
60 50 105.26 94.67 -10.07 71.98 -23.97 103.78 9.63
60 100 117.01 107.23 -8.36 84.42 -21.27 120.62 12.49
120 2 26.65 33.54 25.88 21.92 -34.64 30.70 -8.47
120 5 38.29 39.55 3.30 27.07 -31.56 37.46 -5.29
120 10 45.99 44.80 -2.60 0.98 31.75 -29.13 0.76 43.54 -2.82 0.99
120 20 53.39 50.74 -4.95 Great 37.24 -26.61 Very 50.60 -0.28 Great
120 50 62.95 59.83 -4.97 45.98 -23.15 Good 61.73 3.18
120 100 70.12 67.76 -3.36 53.93 -20.42 71.74 5.87
360 2 10.56 14.32 35.58 10.30 -28.08 11.56 -19.27
360 5 15.33 16.88 10.11 12.71 -24.69 14.10 -16.47
360 10 18.49 19.12 3.42 0.98 14.91 -22.01 0,87 16.39 -14.29 0.94
360 20 21.52 21.66 0.65 Great 17.49 -19.24 Ótimo 19.05 -12.05 Great
360 50 25.44 25.54 0.37 21.60 -15.43 23.24 -9.00
360 100 28.38 28.92 1.92 25.33 -12.43 27.01 -6.62
1440 2 2.94 4.42 50.44 3.84 -13.01 3.12 -29.42
1440 5 4.37 5.21 19.11 4.74 -8.91 3.80 -26.98
1440 10 5.32 5.90 10.81 0.94 5.57 -5.67 0,99 4.42 -25.07 0.80
1440 20 6.24 6.68 7.15 Great 6.53 -2.32 Ótimo 5.14 -23.11 Very
1440 50 7.42 7.88 6.22 8.06 2.29 6.27 -20.44 good
1440 100 8.30 8.92 7.49 9.45 5.92 7.29 -18.37
CAMPO GRANDE
Duration RP GUMBEL IDF1 RME1 d IDF2 RME2 d IDF3 RME3 d
(min) (years) (mm/h) (mm/h) (%) (mm/h) (%) (mm/h) (%)
10 2 108.54 123.25 13.55 88.07 -28.55 130.05 5.52
10 5 140.34 142.56 1.58 101.76 -28.62 148.39 4.09
10 10 161.39 159.15 -1.39 0.99 113.51 -28.68 0.65 163.97 3.03 0.99
10 20 181.59 177.68 -2.15 Great 126.62 -28.74 Medium 181.18 1.97 Great
10 50 207.73 205.51 -1.06 146.30 -28.81 206.73 0.59
10 100 227.31 229.43 0.93 163.20 -28.87 228.43 -0.44
30 2 75.20 76.63 1.91 53.08 -30.73 86.31 12.63
30 5 92.59 88.64 -4.26 61.33 -30.81 98.48 11.11
30 10 104.10 98.96 -4.94 0.99 68.42 -30.86 0.63 108.82 9.97 0.96
30 20 115.14 110.47 -4.05 Great 76.32 -30.92 Medium 120.24 8.84 Great
30 50 129.43 127.78 -1.28 88.18 -30.99 137.20 7.37
30 100 140.15 142.65 1.79 98.36 -31.05 151.60 6.27
60 2 48.14 49.52 2.87 35.35 -28.61 57.03 15.16
60 5 58.69 57.28 -2.40 40.85 -28.68 65.07 13.61
60 10 65.67 63.95 -2.63 0.99 45.57 -28.74 0.65 71.90 12.44 0.93
60 20 72.37 71.39 -1.36 Great 50.83 -28.80 Medium 79.45 11.29 Great
60 50 81.05 82.57 1.88 58.73 -28.87 90.66 9.79
60 100 87.54 92.18 5.30 65.51 -28.93 100.17 8.67
120 2 28.30 29.46 4.07 22.58 -23.34 33.70 14.40
120 5 34.97 34.07 -2.56 26.09 -23.42 38.45 12.85
120 10 39.38 38.04 -3.41 0.99 29.10 -23.49 0.72 42.49 11.70 0.94
120 20 43.61 42.46 -2.63 Great 32.46 -23.55 Good 46.94 10.55 Great
120 50 49.09 49.12 0.06 37.51 -23.63 53.57 9.06
120 100 53.19 54.83 3.09 41.84 -23.69 59.19 7.94
360 2 11.22 11.66 3.93 10.60 -9.11 12.51 7.23
360 5 14.17 13.49 -4.76 12.25 -9.21 14.27 5.78
360 10 16.12 15.06 -6.54 0.99 13.66 -9.28 0.95 15.77 4.70 0.99
360 20 17.99 16.82 -6.50 Great 15.24 -9.35 Great 17.43 3.62 Great
360 50 20.40 19.45 -4.68 17.61 -9.45 19.88 2.22
360 100 22.22 21.71 -2.27 19.65 -9.52 21.97 1.18
1440 2 3.35 3.35 -0.06 3.95 18.12 3.14 -6.25
1440 5 4.20 3.87 -7.83 4.57 17.99 3.58 -7.52
1440 10 4.77 4.32 -9.28 0.97 5.10 17.90 0.86 3.96 -8.46 0.94
1440 20 5.31 4.83 -9.04 Great 5.69 17.80 Great 4.37 -9.40 Great
1440 50 6.01 5.58 -7.05 6.57 17.68 4.99 -10.62
Table 4 lists multiplicative coefficients adjusted for application of the 24-hour rainfall disaggregation method to be practiced in Mato Grosso do Sul. The results obtained showed great performance based on relative mean error (RME), concordance index, and model performance analysis criterion (Table 3).
TABLE 4. Proposition of rainfall disaggregation coefficients of rain data for Mato Grosso do Sul State, Brazil.
Duration 1440min/24h 720min/24h 360min/24h 240min/24h 180min/24h 120min/24h
Coefficient 1.14 0.94 0.88 0.82 0.79 0.74
Duration 60min/24h 50min/24h 40min/24h 30min/24h 20min/24h 10min/24h
Coefficient 0.63 0.60 0.55 0.49 0.39 0.24
The 24-hour rainfall disaggregation method proposed by DAEE/CETESB (1980) resulted, in general, in an underestimation of maximum rainfall intensity for both locations, except for 1440 min duration, which showed a differentiated behavior. This fact provides less security for hydro-agricultural projects but, on the other hand, it decreases cost on project implementation.
The adjusted coefficients were used to estimate equation parameters that relate intensity, duration and frequency for various locations in Mato Grosso do Sul State (Table 5). There was good adjustment of intense rainfalls equations, with r2 values above 0.98.
We found a significant variation within the fitted equation parameters. K parameter presented
a variation of 84.5%, ranging from 4905.22, in Ribas do Rio Pardo town (Code: 2153002), to 9048.45 in Cassilândia town (Code: 1951004). A values showed a 133% variation, with values from
0.13 (Chapadão do Sul, Code: 1852002) to 0.31 (Cassilândia, Code: 1951004).
Parameters b and c of the IDF adjusted equation presented the smallest variations, which were
3.6% and 1.7%, with amplitudes from 32.21 (Coxim, Code: 1855000) to 33.37 (Camapuã, Code: 1954006), and from 1.05 (Ribas do Rio Pardo, Code: 2153002) to 1.07 (Camapuã, Code: 1954006), respectively.
Parameters of rainfall intensity equation had great variability what highlights the need for local information attainment to perform studies and hydraulic projects. This fact shows that neighboring station use, for places that do not have the adjusted equation, interferes with the dimensioning safety and cost of projects (PEREIRA et al., 2007; SILVA et al., 2002;).
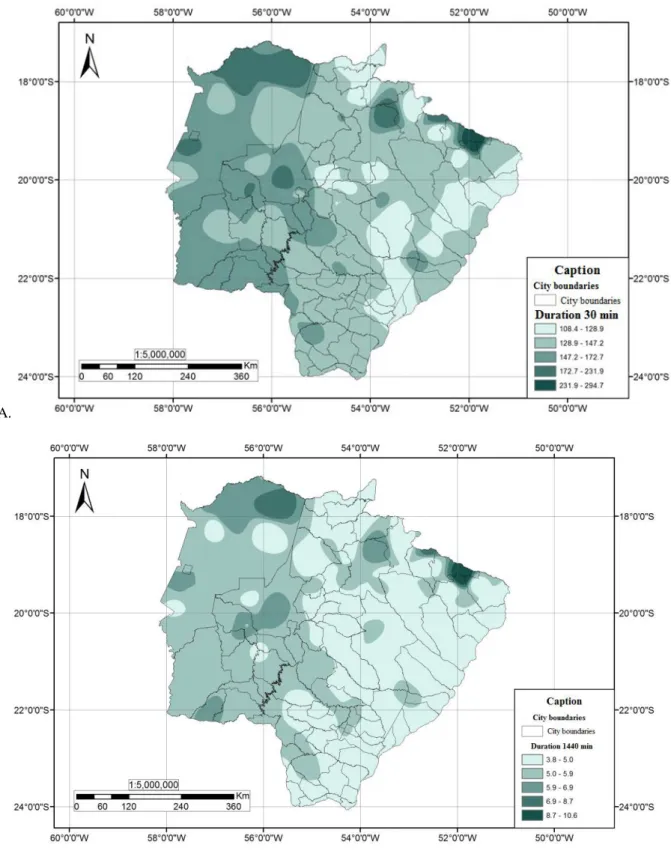
The results obtained with the spatial distribution of intense rainfall (Figure 3) were made only for the 20-year-return period, with durations of 30 and 1440 min, because according to EUCLYDES (1987), this period is the most recommended for hydro-agricultural project implementation. Thus, the longer the return period, the greater the values of maximum intensities found and, therefore, the greater the safety and cost of the project.
The decrease in the values of annual maximum intensities with increase in rainfall duration is also evident in Figure 3, which is typical for rains, since rainfall intensity tends to decrease with increased durations.
A.
B.
CONCLUSIONS
Intense rainfall equations obtained through pluviogram analysis present great adjustments with determination coefficients above 99%;
The 24-hour rainfall disaggregation method with adjusted coefficients presented excellent performance when compared to pluviogram analysis;
The 24-hour rainfall disaggregation method with original coefficients tends to underestimate maximum rainfall intensities in Mato Grosso do Sul State, Brazil; and
The highest rainfall intensities foreseen for Mato Grosso do Sul occur in Western State and the lowest ones in Eastern area.
ACKNOWLEDGEMENTS
We thank CNPq for the financial support, as well as INMET, by disposing of the data series.
REFERENCES
ANA - Agência Nacional de Águas. HidroWeb: sistemas de Informações Hidrológicas. Disponível
em: <http://hidroweb.ana.gov.br/HidroWeb>. Acesso em 15 mar. 2013.
ARAI, F.K.; PEREIRA, S.B.; GONÇALVES, G.G.G. Characterization of water availability in a hydrographic basin. Engenharia Agrícola, Jaboticabal, v.32, n.3, p.591-601, 2012.
ASSIS, F.N.; ARRUDA, H.V.; PEREIRA, A.R. Aplicações de estatística à climatologia. Pelotas:
Editora Universitária, Universidade Federal de Pelotas, 1996. 161p.
CAMARGO, A.P.; SENTELHAS, P.C. Avaliação do desempenho de diferentes métodos de estimativa da evapotranspiração potencial no Estado de São Paulo. Revista Brasileira de Agrometeorologia, Santa Maria, v. 5, n. 1, p. 89-97, 1997.
CETESB - Companhia de Tecnologia de Saneamento Ambiental. Drenagem urbana: manual de
projeto. São Paulo, 1986. 494p.
CRUCIANI, D.E. A drenagem na agricultura. São Paulo: Nobel, 1980. 333p.
DAEE; CETESB - Departamento de Água e Energia Elétrica; Companhia de Tecnologia de Saneamento Ambiental. Drenagem urbana: manual de projeto. São Paulo, SP. 1980. 466p.
EUCLYDES, H.P. Saneamento agrícola: atenuação das cheias; metodologia e projeto. 2.ed. Belo
Horizonte: Ruralminas, 1987. 320p.
FIETZ, C.R.; COMUNELLO, E. Chuvas intensas em Mato Grosso do Sul. Dourados: Embrapa
Agropecuária Oeste, 2007. 86p. (Documentos, 90).
FIETZ, C.R.; COMUNELLO, E; CREMON, C.; DALLACORT, R. PEREIRA, S.B. Chuvas intensas no Estado de Mato Grosso. Dourados, MS: Embrapa Agropecuária Oeste, 2010. 117p.
(Documentos, 104).
FREITAS, A.J., SILVA, D.D., PRUSKI, F.F., PINTO, F.A., PEREIRA, S.B., GOMES FILHO, R.R., TEIXEIRA, A.F., BAENA, L.G.N., MELLO, L.T.A., NOVAES, L.F. Equações de chuvas intensas no Estado de Minas Gerais. Belo Horizonte: Companhia de Saneamento de Minas Gerais;
Viçosa: Universidade Federal de Viçosa, 2001. 65p.
GARCIA, S.S. Determinação da equação de intensidade-duração-frequência da precipitação pluvial para sete estações meteorológicas da região Centro Sul do Estado de Mato Grosso. 2010.
OLIVEIRA, L.F.C.; ANTONINI, J.C.A.; FIOREZE, A.P.; SILVA, M.A.S. Métodos de estimativa de precipitação máxima para o Estado de Goiás. Revista Brasileira de Engenharia Agrícola e Ambiental, Campina Grande, UAEAg/UFCG, v.12, n.6, p.620-625, 2008.
PEREIRA, S.B.; FIETZ, C.R.; PEIXOTO, P.P.P.; ALVES SOBRINHO, T.; SANTOS, F.M.
Equação de intensidade, duração e frequência da precipitação para a região de Dourados, MS,
Dourados, MS: Embrapa Agropecuária Oeste, 2007. 18p. (Documentos, 44). Disponível em: <http://www.cpao. embrapa.br/publicacoes>. Acesso em: 1 de jun. 2012.
PINTO, F.A.; FERREIRA, P.A.; PRUSKI, F.F.; ALVES, A.R.; CECON, P.R. Estimativa de chuvas intensas no Estado de Minas Gerais utilizando registros diários. Engenharia Agrícola, Jaboticabal,
v.16, n.2, p.8-21, 1996.
PRUSKI, F.F. Conservação do solo e água: práticas mecânicas para o controle da erosão hídrica.
2.ed. Viçosa: Editora UFV, 2009. 279p.
PRUSKI, F.F.; SILVA, D.D.; TEIXEIRA, A.F.; CECÍLIO, R.A.; SILVA, J.M.A.; GRIEBELER, N.P. Hidros: dimensionamento de sistemas hidroagrícolas. Viçosa: Editora UFV, 2006. 259p.
SANTOS, G.G.; FIGUEIREDO, C.C.; OLIVEIRA, L.F.C.; GRIEBELER, N.P. Intensidade-duração-frequência de chuvas para o Estado de Mato Grosso do Sul. Revista Brasileira de Engenharia Agrícola e Ambiental, Campina Grande, PB, UAEA/UFCG, v.13, p.899-905, 2009.
Suplemento.
SILVA, D.D.; GOMES FILHO, R.R.; PRUSKI, F.F.; PEREIRA, S.B; NOVAES, L.F. Chuvas intensas para o Estado da Bahia. Revista Brasileira de Engenharia Agrícola e Ambiental, Campina
Grande, v.6, n.2, p.362-367, 2002.
SILVA, D.D.; PEREIRA, S.B; PRUSKI, F.F.; GOMES FILHO, R.R.; LANA, A.M.Q.; BAENA, L.G.N. Equações de intensidade-duração-frequência da precipitação pluvial para o Estado de Tocantins. Engenharia na Agricultura, Viçosa, MG, v.11, n.1/4, p.7-14, 2003.
VILLELA, S., MATTOS, A. Hidrologia aplicada. São Paulo: McGraw-Hill do Brasil. 1975. 245p.
WILLMOTT, C.J. On the validation on models. Physical Geography,Norwich, v.2, n.2, p.184-194,
1981.