RBRH, Porto Alegre, v. 23, e46, 2018 Scientific/Technical Article
https://doi.org/10.1590/2318-0331.231820180076
This is an Open Access article distributed under the terms of the Creative Commons Attribution License, which permits unrestricted use, distribution,
Sub-hourly rainfall patterns by hyetograph type under distinct climate conditions in
Northeast of Brazil: a comparative inference of their key properties
Padrões sub-horários da precipitação por tipo de hietograma em condições climáticas distintas no Nordeste do Brasil: uma inferência comparativa das suas principais propriedades
Luís Romero Barbosa1,2, Cristiano das Neves Almeida2, Victor Hugo Rabelo Coelho2, Emerson da Silva Freitas2,
Carlos de Oliveira Galvão3, José Carlos de Araújo4
1Universität Potsdam, Potsdam, BB, Alemanha 2Universidade Federal da Paraíba, João Pessoa, PB, Brasil 3Universidade Federal de Campina Grande, Campina Grande, PB, Brasil
4Universidade Federal do Ceará, Fortaleza, CE, Brasil
E-mails: [email protected] (LRB), [email protected] (CNA), [email protected] (VHRC), [email protected] (ESF), [email protected] (COG), [email protected] (JCA)
Received: May 13, 2018 - Revised: August 14, 2018 - Accepted: September 04, 2018
ABSTRACT
The lack of process-based classification procedures may lead to unrealistic hyetograph design due to complex oscillation of rainfall depths when assimilated at high temporal resolutions. Four consecutive years of sub-hourly rainfall data were assimilated in three study areas (Guaraíra, GEB, São João do Cariri, CEB, and Aiuaba, AEB) under distinct climates (very hot semi-arid and tropical wet). This study aimed to define rainfall events (for Minimum Inter-event Time, MIT, and Minimum Rainfall Depth, MRD, equal to 30 min and 1.016 mm, respectively), classify their hyetograph types (rectangular, R, unimodal with left-skewed, UL, right-skewed, UR, and centred peaks, UC, bimodal, B, and shapeless, SL), and compare their key rainfall properties (frequency, duration, depth, rate and peak). A rain pulse aggregation process allowed for reshaping SL-events for six different time spans varying from 2 to 30 min. The results revealed that the coastal area held predominantly R-events (64% events and 49% rainfall depth), in western semi-arid prevailed UL-events (57% events and 63% rainfall depth), whereas in eastern semi-arid mostly were R-events (61% events and 30% rainfall depth) similar to coastal area. It is concluded that each cloud formation type had important effects on hyetograph properties, differentiating them even within the same climate.
Keywords: Rainfall event; MIT; MRD; Hyetograph classification; Northeast of Brazil.
RESUMO
A falta de procedimentos de classificação baseados em processos pode levar a uma projeção irreal de hietogramas devido à complexa oscilação das lâminas precipitadas quando assimiladas em altas resoluções temporais. Quatro anos consecutivos de dados pluviográficos sub-horários foram assimilados em três áreas de estudo (Guaraíra, GEB, São João do Cariri, CEB, e Aiuaba, AEB) sob climas distintos (semiárido muito quente e tropical úmido). O objetivo deste estudo foi definir os eventos chuvosos (para Tempo Mínimo entre Eventos, MIT, e Altura Mínima de Precipitação, MRD, iguais a 30 min e 1.016 mm, respectivamente), classificar seus tipos de hietograma (retangular, R, unimodal com pico oblíquo à esquerda, UL, oblíquo à direita, UR, e centrado, UC, bimodal, B, e disforme, SL), e comparar suas principais propriedades de precipitação (frequência, duração, altura, taxa e pico). Um processo de agregação de pulsos de precipitação permitiu remodelar os eventos SL para seis períodos de tempo variando de 2 a 30 min. Os resultados revelaram que a área costeira possuía predominantemente eventos R (64% de eventos e 49% de lâmina precipitada), no semiárido ocidental prevaleceram os eventos UL (57% de eventos e 63% de lâmina precipitada), enquanto no semiárido oriental a maioria foram os eventos R (61% de eventos e 30% de lâmina precipitada) semelhante à área costeira. Conclui-se que cada tipo de formação de nuvens teve efeitos importantes sobre as propriedades dos hietogramas, diferenciando-os até dentro do mesmo clima.
INTRODUCTION
Rainfall event is the primary variable for predicting the hydrological response to extreme storms worldwide. Nevertheless, continuous and reliable rainfall data measurements still remains a great challenge (PUI et al., 2012; ROUILLARD et al., 2015) and often conveys great uncertainties in hydrological model outcomes (DUAN; BASTIAANSSEN, 2013; YANG; LUO, 2014). Currently, one of the research foci addressed in hydrology science is the analysis of rainfall event properties and temporal patterns impelling the water cycle (FIGUEIREDO et al., 2016; DUNKERLEY, 2008a,b, 2010, 2015; HAILE et al., 2011; NOJUMUDDIN; YUSOF; YUSOP, 2016; PASCHALIS et al., 2014). Such topic of study was validated for extreme storms over large areas, showing important environmental implications (JENA et al., 2014). Moreover, the spatiotemporal impact of rainfall event features were widely evaluated in others phases of the hydrological cycle, such as: soil moisture (LOZANO-PARRA et al., 2016; ZHU et al., 2014), flood analysis (SORDO-WARD et al., 2016), infiltration estimation (DUNKERLEY, 2010; FANELLI; PRESTEGAARD; PALMER, 2017), flow generation and soil erosion (PASCHALIS et al., 2014; TODISCO, 2014), and sediments yield (MEDEIROS; ARAÚJO, 2014; RICKENMANN; BADOUX; HUNZINGER, 2016).
Rainfall time series at high temporal resolution, along with suitable defining criteria, leads to a detailed quantification of rainfall events. The criteria commonly addressed to define rainfall events is the Minimum Inter-event Time (MIT) associated with Minimum Rainfall Depth (MRD) (DUNKERLEY, 2008b, 2010). The choice of the MIT values should be habitually based on previous knowledge of the weather conditions and geomorphological features for each specific study case purpose, but frequently it is performed arbitrarily and vaguely (WYNN, 1994). Some studies showed that a higher MIT above 30 min would decrease the number of events but increase its complexity (DUNKERLEY, 2008a,b, 2010). Other studies found optimum MIT equals to 1 h in semi-arid regions due to the period required for the water to drain into the soil and consequently to change the antecedent soil moisture (MEDINA-COBO et al., 2016; MOLINA-SANCHIS et al., 2016). Additionally, the application of the rain pulse aggregation process for different MIT criterion is also useful for rainfall event definition due to their effects over the rainfall property magnitudes and hyetograph type (HAILE et al., 2011).
The analysis of the storm temporal distribution allows for classifying the hyetograph type and understanding their implications in distinct climate conditions. While the arid zones present minimal change in hyetograph type by increasing the overall rainfall depth, the temperate zones display hyetograph peak increasing at greater intensities (WASKO; SHARMA; WESTRA, 2016). Changes in rainfall distribution affect the highest fraction positively and the lowest fraction of individual storms negatively, especially under higher temperatures (WASKO; SHARMA, 2015). Also, Back (2011) showed that rainfall events concentred in the first and second hyetograph quartiles are more frequent along summer season in the tropical wet regions of Brazil. As a result, a unimodal (triangular) hyetograph type influences the time-to-peak and shape of runoff hydrographs (BALL, 1994); meanwhile, a
rectangular hyetograph affects the infiltration and runoff generation processes (DUNKERLEY, 2012). For example, Medeiros and Araújo (2014) showed that the strong temporal concentration of rainfall yields events with high intensity and erosive power in the Brazilian semi-arid region irrespective of low annual rainfall depths.
Although the hyetograph type has significant implications depending on the rain pulse temporal distribution, none process-based procedure of hyetograph classification is widely accepted. For this purpose, Coutinho et al. (2014) proposed a hyetograph classification framework by assessing their key rainfall properties in two regions in different climate conditions; they categorised rainfall events in six hyetograph types. They showed that most of the rainfall events were classified into hyetograph types with a recognizable shape in both regions, but pinpointed that few rainfall events remained unclassified due to their complex hyetograph shape, although they represented a large parcel of annual rainfall depth. However, neither they provided a reclassification of these unclassified (shapeless) events, nor comparative inferences over their key rainfall properties, nor in-deep discussion about weather phenomena effects, such as cloud formation, over the results. Thus, it is hypothesised that comparative inferences over the key rainfall properties allow for revealing whether there are storm similarities between distinct climate conditions, or differences within each one, from data sets of different categories of rainfall events: short and large, light and heavy, simple and complex; at a high temporal (sub-hourly) resolution.
Accordingly, this study aims to compare the sub-hourly rainfall patterns of three sites located in distinct climate areas of the tropical Northeast region of Brazil, from the key rainfall properties of different hyetograph types, in order to infer about their storm differences and similarities. As such, a simple hyetograph classification procedure able to distinguish the rain pulse temporal distribution and reclassify the complex-shaped (and extreme) rainfall events was proposed to allow for comparisons between rainfall patterns. Thus, the rainfall event defining criteria by Dunkerley (2008a), the hyetograph type framework by Coutinho et al. (2014) and a rain pulse aggregation process similar to the Haile et al. (2011) were used to define, classify and reclassify the rainfall events, respectively. Multiple analyses and inferences over the rainfall event properties (rainfall frequency, depth, duration, rate and peak) for six hyetograph types, and a discussion about the effects of precipitating cloud formation, were carried out, in order to compare the rainfall patterns between distinct climate regions (hot semi-arid and tropical wet) and biomes (Caatinga and Atlantic Forest) in the tropical Northeast region of Brazil.
MATERIAL AND METHODS
Study sites
(coastal zone). The Caatinga biome embeds a mixing vegetation of tree, shrubs, and cacti with complex leaf area index variation throughout the year, where much of the natural vegetation in the biome has been cleared for extensive farming, cattle-raising, and dryland family farming (COELHO et al., 2017; PINHEIRO; COSTA; ARAÚJO, 2013). Meanwhile, the Atlantic Forest biome includes tropical rainforest vegetation that was mostly replaced over the years by sugarcane and pineapples crops (SALES et al., 2014).
The GEB has a drainage area of ~6 km2 between the
coordinates 7º27´–7º32´S and 35º02´–34º04´W. Its mean annual rainfall depth is 1700 mm, mostly concentrated from March to
July (~70%) and modulated by shallow convective precipitating clouds (PALHARINI; VILA, 2017). In addition, the mean annual potential evapotranspiration in GEB reaches approximately 1500 mm. On the other hand, the CEB covers ~14 km2 between
the coordinates 7º20´–7º23´S and 36º31´–36º33´, whereas AEB is located between the coordinates 6º42´–6º44´S and 40º16´–40º19´W, and holds a drainage area of ~12 km2. The mean annual rainfall
depths of both experimental basins located in the Caatinga biome are 460 (in CEB) and 560 mm (in AEB), most of which registered from January to May (~70%) and from January to April (~80%), respectively. The rainfall in CEB and AEB are modulated by stratiform and deep convective precipitating clouds (PALHARINI; VILA, 2017). The mean annual potential evapotranspiration in both semi-arid areas are high, many times exceeding 2000 mm (FIGUEIREDO et al., 2016; PINHEIRO; COSTA; ARAÚJO, 2013).
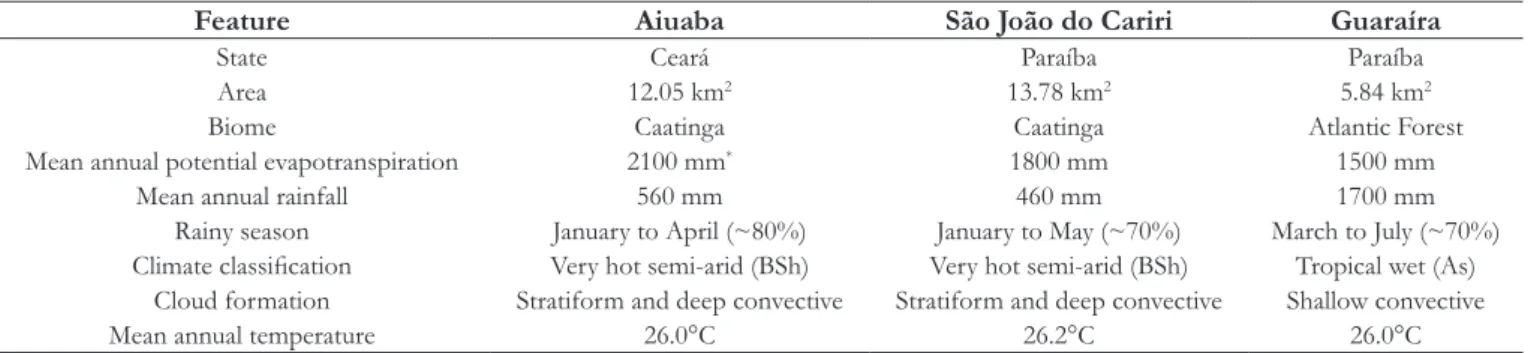
The weather features suggest that the two biomes hold different climate conditions. According to Köppen’s classification developed specifically for Brazil by Alvares et al. (2013), the Atlantic Forest biome is affected by a tropical wet climate with dry summer (As) and the Caatinga biome presents a very hot semi-arid climate with low latitude and altitude (BSh). Additionally, all experimental basins hold the same mean annual temperature of ~26°C, which interferes smoothly on rainfall regimes due to their roughly similar latitude positions (WASKO; SHARMA, 2015; WASKO; SHARMA; WESTRA, 2016). All features of the study sites are summarized in Table 1 to facilitate the understanding of the site comparisons along the next sections.
Data monitoring
All experimental basins were equipped in 2003 with automatic rainfall devices of TB4 (Tipping Bucket rainfall gauge) type, measuring with 0.254-mm increments. The temporal resolution of measurement was 1 min in GEB and CEB when it rained, whereas, in AEB, the temporal resolution was 5 min, measured continuously. To equate the temporal resolutions for the subsequent analyses, a routine programmed in VBA language aggregated the rain pulses at a 5-min time step in CEB and GEB. The data collected in this study cover four flawless continuous years, assimilated from January 2005 to December 2008, comprising dry, moderate, and rainy years, as shown in Table 2.
Table 1. Main characteristics of the study sites.
Feature Aiuaba São João do Cariri Guaraíra
State Ceará Paraíba Paraíba
Area 12.05 km2 13.78 km2 5.84 km2
Biome Caatinga Caatinga Atlantic Forest
Mean annual potential evapotranspiration 2100 mm* 1800 mm 1500 mm
Mean annual rainfall 560 mm 460 mm 1700 mm
Rainy season January to April (~80%) January to May (~70%) March to July (~70%)
Climate classification Very hot semi-arid (BSh) Very hot semi-arid (BSh) Tropical wet (As) Cloud formation Stratiform and deep convective Stratiform and deep convective Shallow convective
Mean annual temperature 26.0°C 26.2°C 26.0°C
*Potential evapotranspiration estimated by class-A pan method with Kp coefficient of 0.81.
Definition and classification of rainfall events
Rainfall events were defined according to the criteria set forth by Dunkerley (2008a), i.e. using the MIT and MRD. He explained that MIT criterion is a fixed rainless period to be reached or exceeded before and after each rainfall event, whereas the MRD criterion is the minimum rainfall depth of a rainfall event selected according to MIT criteria. In this study, it was used the same set of MIT and MRD values adopted by Dunkerley (2008b), varying from 3 min to 24 h, and from 0.2 to 13 mm, respectively. These intervals were used due to twofold purposes: (1) defining the quantity and variety of rainfall events necessary for comprehending the broad range of properties by hydrograph type; and (2) disregarding the isolated rain pulses unable of yielding significant hydrological responses. Therefore, the rainfall
event in this study was defined for MRD equals to 1.016 mm (i.e. four bucket-tips) and MIT equals to 30 min. Figure 2 shows a hypothetical example of this classification process. As such, a routine programmed in VBA language was run to provide a rapid and systematic definition.
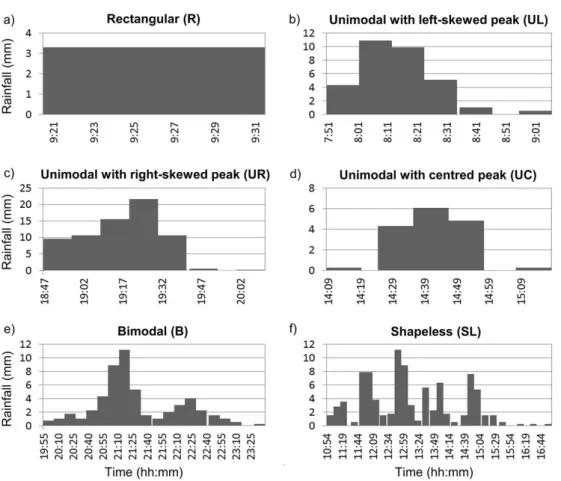
Once defined the aforementioned criteria, the rainfall event classification process could be carried out, according to the six hyetograph types categorised by Coutinho et al. (2014) (Figure 3): (1) rectangular (R), when constant rainfall rates are more evident
Table 2. Annual rainfall depth by study sites from 2005 to 2008.
Year
Rainfall depth (mm)
Aiuaba São João do
Cariri Guaraíra
2005 518 636 1206
2006 560 462 1518
2007 740 254 1661
2008 733 762 1760
Mean 638 528 1536
Figure 2. Criteria for rainfall event definition: minimum rainfall
depth (MRD) higher than 1.016 mm, and minimum inter-event time (MIT) equals or longer than 30 min.
than any no-relevant peaks; (2) unimodal with left-skewed peak (UL), when one single prominent rainfall peak is located on the left side of the unimodal distribution; (3) unimodal with right-skewed peak (UR), when one single prominent rainfall peak is located on the right side of the unimodal distribution; (4) unimodal with centred peak (UC), when one single prominent rainfall peak is located near the centre of the event; (5) bimodal (B), when the hyetograph displays two remarkable steep peaks; and (6) shapeless (SL), when the hyetograph has multiple prominent peaks. The shape of each hyetograph was subjectively classified through a double-blind procedure, followed by the confrontation of the results. For such purpose, threefold assumptions were used for detecting the hyetograph type: (1) the relative position of the peak regarding the rainfall event mid-time point; (2) the concentration of rain pulses; and (3) the negligence of minor isolated and insignificant peaks. Before this hyetograph classification procedure, a plotting correction of the 5-min rain pulses of AEB was performed, by replicating its value for every antecedent 4 min, to avoid the gaps by plotting the rainfall events, and making the visual inspection feasible during the classification.
Reclassification of complex-shaped rainfall events
The SL-events were reclassified through a rain pulse aggregation process using constant time spans (Δt) longer than the temporal resolution of storage provided by the automatic rainfall device, similar to the Haile et al. (2011) procedure. The Δt is the parcel of time added right after the prior registered time (t1) to accumulate the rain pulses (d1) to subsequent time step (tΔt+1 = t1 + Δt), computing a cumulative rainfall depth (dΔt+1 = ∑di , from i = 1 to Δt+1), as exemplified in Table 3. Accordingly, the rainfall depths of each SL-event were progressively accumulated for Δt equals to 2, 5, 7, 10, 15 and 30 min in order to reclassified them into a recognizable hyetograph type, i.e. R, UL, UR, UC or B. For the AEB study site, the rainfall events started to be reclassified for Δt equals to 5 min due to its temporal resolution of measurement.
Detailed analyses of rainfall events
The first analysis of this study intended to quantify the proportions of rainfall events for each study site before the reclassification process. For this purpose, the key rainfall properties were addressed, similar to Nojumuddin, Yusof and Yusop (2016) study, including rainfall frequency, duration, depth, rate and peak.
At this stage, the main descriptive statistics were averaged, i.e. count, mode, median, mean, standard deviation (SD), coefficient of variation (CV), maximum and minimum values.
During the reclassification process, the proportions of SL-events being reclassified were displayed for Δt equals to 5, 10 and 30 min, to show in which hyetograph types the SL-events were reclassified. Next, an appropriated value of Δt was chosen to compare the hyetograph classification scenarios before and after the reclassification, by assessing the proportions and rainfall depths of hyetograph types between the study sites. In this case, the increasing and decreasing of the relative percentages of hyetograph types were analysed to find out the impact of the SL-events reclassification between them.
The rainfall peaks, durations and rates were analysed through exploratory data analysis to distinguish significant differences within and between study sites. Initially, the SL-events reclassification by rainfall property was assessed by analysing the changes of their magnitude when reclassified in other hyetograph types. Next, similar analyses over every hyetograph types were performed before and after the reclassification, along with comparative pair-wise inferences by hyetograph type. The one-way ANOVA was firstly used to check the overall similarity among study sites, then the Tukey’s test was applied to infer about pair-wise hyetograph type differences (for each key rainfall property) between study sites. Threefold alternative hypotheses were chosen to assess their significant differences: p < 0.05, p < 0.001 and p < 0.0001.
Lastly, the relative frequency and rainfall depth of the heavier, longer, and more intense SL-events were quantified and analysed, before and after their reclassification. In this analysis, the rainfall rate values higher than 10 mm h-1 were considered
as very heavy and extreme events, according to the thresholds proposed by Tokay and Short (1996), henceforth termed as extreme events. The durations longer than 120 min and peaks higher than 3 mm 5 min-1 also represented extreme events in
this study, both defined by data discretization owing to the high temporal resolution of the measurement.
RESULTS AND DISCUSSION
Descriptive statistics of sub-hourly rainfall event properties
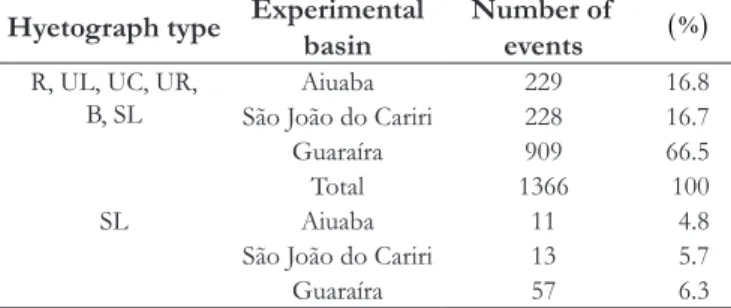
In total, 1366 rainfall events were defined in AEB, CEB and GEB over the study years (Table 4). Both AEB and CEB displayed ~228 rainfall events, whereas GEB registered 909 events, i.e. four times higher than the other two study sites located in the semi-arid region.
Table 3. Exemplification of rain pulse aggregation process for
Δt set equals to 2 min.
ti (hh:mm)
di (mm)
Δt = ti-t1
(min)
tΔt+1 (hh:mm)
dΔt+1 (mm)
t1 – (14:11) 0.254 0.0 - -t2 – (14:12) 0.508 1.0 - -t3 – (14:13) 0.254 2.0 t3 – (14:13) 1.016 t1 – (14:14) 0.762 0.0 - -t2 – (14:15) 0.254 1.0 - -t3 – (14:16) 0.254 2.0 t3 – (14:16) 1.270
Table 4. Proportions of known-shape and shapeless rainfall events.
Hyetograph type Experimental basin
Number of events ( )
%
R, UL, UC, UR, B, SL
Aiuaba 229 16.8
São João do Cariri 228 16.7 Guaraíra 909 66.5
Total 1366 100
SL Aiuaba 11 4.8
São João do Cariri 13 5.7
This fact was expected because the Brazilian coastal region owns high rainfall depths distributed along the year (MELO et al., 2015), which implies in a high number of rainfall events with a wide range of magnitudes. Additionally, the rainfall depth in GEB during the study period was (on average) two and a half and three times higher than in AEB and CEB, respectively (Table 2). The SL-events proportions remained roughly similar, around 5.5% (on average), in the three study sites, but the AEB and CEB featured similar absolute numbers (11 and 13, respectively). In contrast, the GEB presented 57 SL-events, i.e. roughly five times more than the study sites affected by semi-arid climate conditions. As such, the rainfall events in AEB and CEB showed high energy and low frequency, typical behaviour of the semi-arid environment where the critical parameter is the rainfall rate rather than rainfall depth (CAMARASA-BELMONTE; SORIANO, 2014).
The descriptive statistic of the key rainfall properties for each experimental basin is shown in Table 5. GEB featured the shortest mean values of rainfall properties and high CV of rainfall rate (1.21) and peak (1.32), whereas AEB and CEB presented more similar mean and SD values of the rainfall properties. The GEB variation is likely explained by the high frequency of events mostly yielded by shallow convective clouds, comprehending from 45% (February) to 95% (August) of the total monthly events (PALHARINI; VILA, 2017). Conversely, the AEB and CEB holds the stratiform precipitating clouds, with small rainfall depth but frequency ranging from 20% (July) to 60% (February), and the deep convective clouds, with large rainfall depth but frequency from 5% (July) to 20% (September) (PALHARINI; VILA, 2017).
The study sites displayed maximum durations up to 9.5 (in AEB), 7.8 (in CEB) and 11.5 h (in GEB), but with a mean duration of ~1 h for all the investigated sites. The maximum rainfall depth (~183 mm) and peak (~15 mm 5 min-1) were registered in CEB,
corresponding to the SL-event occurred on 26 April 2008, which represented ~24% of the total depth registered in this year. It allows for suggesting that in Brazilian semi-arid, the precipitating cloud formation has a strong influence in the hyetograph complexity by yielding SL-events similar to those of wet areas, even when low annual rainfall depths are registered (MEDEIROS; ARAÚJO, 2014). From the mean values of rainfall peak and duration, the CEB and AEB seem to own short convective events with high peaks, whereas GEB has convective features that include continuous
events only, i.e. without embedded dry periods (BRINGI et al., 2003; DILMI et al., 2016). The rainfall rate in AEB and CEB was high (~11.6 and ~9.5 mm h-1, respectively), typical of semi-arid
regions, whereas the GEB displayed the lower value (~8.5 mm h-1).
Hyetograph type proportions before and after the
SL-events reclassification
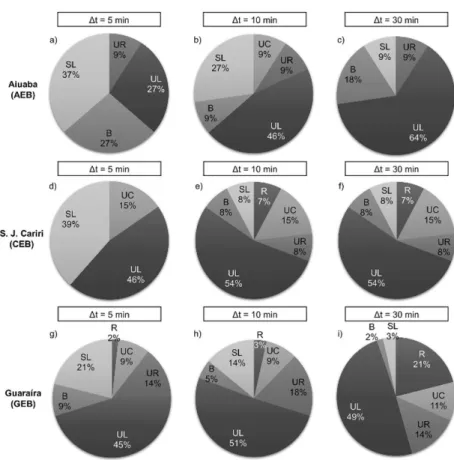
The relative frequency of the SL-events obtained through the reclassification is shown in Figure 4, for every study site and different time spans (5, 10 and 30 min). Overall, the number of SL-events tends to decrease as the Δt increases, so that the SL-events decreased mostly at Δt equals to 30 min. The SL-events reduced gradually when the Δt increased from 5 to 30 min (up to 9%, 8% and 3% in AEB, CEB and GEB, respectively), for the peak oscillation complexity decreased, which allowed for the hyetograph type classification. The SL-events were mainly reclassified as UL-events in AEB (from 27 to 64%) and R-events in GEB (from 2 to 21%) when the Δt changed from 5 to 30 min; on the other hand, the SL-events were well reclassified into B-, R- and UL-events in CEB (to ~8%). However, in total, mostly of SL-events were reclassified in UL-events for every site, i.e. up to 64%, 54% and 49% in AEB, CEB, and GEB, respectively. This is in accordance with Back (2011), which showed that in Brazil the rainfall events tend to concentrate their rainfall depths mainly in the first and second quartiles. The presence of R-events after the reclassification in GEB typifies the slight and uniform rainfall event commonly found in shallow convective clouds, which occur more frequently over the ocean and coastal areas from March to August in tropical Northeast region of Brazil (BRINGI et al., 2003; DILMI et al., 2016; PALHARINI; VILA, 2017; TEIXEIRA, 2008).
The relative frequencies and rainfall depth proportions for each hyetograph type before and after the reclassification is shown in Figure 5. Intriguingly, the CEB and GEB featured similar hyetograph classification, even though they belonged to distinct climates and biomes. From Palharini and Vila (2017), this may likely be explained because the CEB is located in the eastern semi-arid region susceptible to some influence of the moisture transport from the Atlantic Ocean towards the Continent, which may affect the rainfall temporal distribution near to the transition
Table 5. Descriptive statistic of the rainfall event duration, peak, depth and rate in the study sites.
EB Rainfall property Mode Median Mean SD CV Max Min
Aiuaba* Duration (h) 0.4 0.8 1.2 1.3 0.92 9.5 0.1
Peak (mm 5 min-1) 1.270 1.524 2.598 2.485 1.05 14.224 0.254 Depth (mm) 1.778 5.334 10.808 14.420 0.75 82.804 1.270 Rate (mm h-1) 5.08 6.98 11.64 11.73 0.99 79.55 0.92 São João do
Cariri**
Duration (h) 0.3 0.6 1.0 1.1 0.87 7.8 0.1
Peak (mm 5 min-1) 0.508 1.270 2.040 2.055 0.99 14.986 0.254 Depth (mm) 1.524 2.794 8.388 17.765 0.47 183.134 1.270 Rate (mm h-1) 5.08 6.18 9.49 8.71 1.09 55.07 0.81
Guaraíra Duration (h) 0.1 0.6 0.9 1.1 0.83 11.5 0.1
Peak (mm 5 min-1) 1.016 1.270 1.746 1.324 1.32 8.890 0.254 Depth (mm) 1.270 3.048 5.946 8.956 0.66 91.440 1.270 Rate (mm h-1) 15.24 5.86 8.49 6.99 1.21 40.91 0.90
Figure 4. Relative frequency of reclassified SL-events for different time span (5, 10 and 30 min) in (a, b, c) AEB, (d, e, f) CEB,
and (g, h, i) GEB.
Figure 5. Relative frequency and rainfall depth proportion by hyetograph type before and after the reclassification process at 30-min time
zone between tropical wet and semi-arid climates (see Figure 1 and Table 1). The SL-events rainfall depths decreased to 2%, 9% and 2% after the reclassification in AEB, CEB and GEB, a reduction of 86%, 75% and 90% in rainfall depth, respectively. The proportional reduction in the numbers of SL-events was also expressive and all study sites registering no more than 0.4% after the reclassification at 30-min time span; before the reclassification, it was no more than 6%. Additionally, the SL-events reduction did not greatly affect the number of other hyetograph types, meaning that mostly SL-events were reclassified in more than one hyetograph type (see Figure 4). However, most of the SL-events were reclassified into UL-events and in turn their rainfall depths were increased in all study sites after the reclassification, which was proportionally more observed in CEB (25% of events and 35% of rainfall depth) and AEB (57% of events and 63% of rainfall depth), i.e. the sites located in semi-arid region. This fact may be associated with the high sub-daily variability of rainfall in the Brazilian semi-arid, which causes intense short-time-interval events in half of the annual rainfall depth (MEDEIROS; ARAÚJO, 2014). In opposite, the R-events were relatively more observed in GEB before (63% of events and 48% of rainfall depth) and after (64% of events and 49% of rainfall depth) the reclassification, where shallow convective clouds might occur more frequently (PALHARINI; VILA, 2017).
Exploratory data analysis and comparative inference
between hyetograph type properties
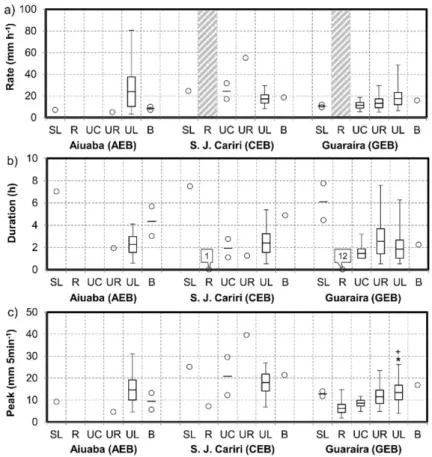
Figure 6 depicts the descriptive statistics of the key rainfall properties (rainfall rate, duration, and peak) by hyetograph type of the reclassified SL-events (at Δt equals to 30 min) for each rainfall property. It was observed that the rainfall rates of the remaining SL-events stood in the average of the other hyetograph types and that the UL-events rainfall rates stood out from the others (higher than 15 mm h-1 on average), mainly in AEB and GEB (Figure 6a).
Despite that similarity, the GEB exhibited a broad sample of all unimodal hyetograph types, where the UC-events presented the lower mean and dispersion; meanwhile, the AEB displayed the highest rainfall rate of ~80 mm h-1, i.e. almost twice higher than
the maximum values of the other two sites.
The SL-events were still detected with rainfall durations up to 8 h in all study sites (Figure 6b), which were influenced by the set values of the rainfall event definition criteria (MIT and MRD equal to 30 min and 1.016 mm, respectively). The UL-events presented similar mean durations of ~2 h (on average) for all study sites, but the UR-events presented the highest mean (~2.6 h) and SD (~1 h) in GEB. Both CEB and GEB displayed 1 and 12 R-events with 1-min duration, respectively, which yielded extremely high intensities, therefore neglected.
Figure 6. Comparative inference over the rainfall (a) rates, (b) durations and (c) peaks between study areas for the reclassified
The reclassification procedure yielded UL-events with the largest peak dispersion and highest mean (ranging from ~14 to ~17 mm 5 min -1) in all study sites (Figure 6c). In addition, the UL-events peaks
in GEB were significantly different to AEB and CEB (p < 0.05), mainly due to its very distinct climatic condition. Additionally, the maximum peak observed on the data series was detected by one UR-event in CEB (~40 mm 5 min-1), followed by one UL-events
in AEB (~31 mm 5 min-1). The remaining SL-events showed
peaks higher than 10 mm 5 min-1 in the study sites.
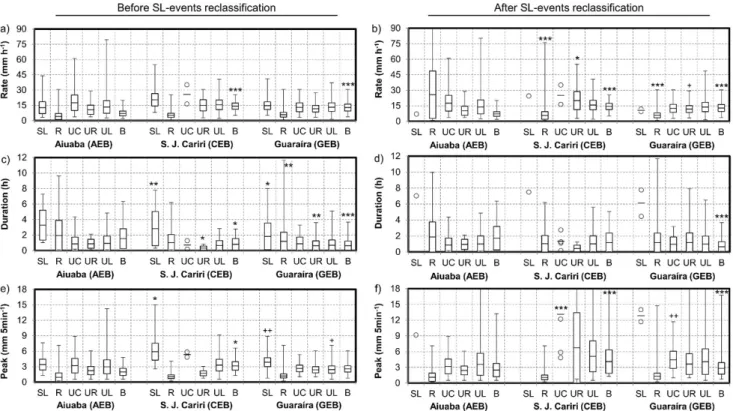
Figure 7 depicts the descriptive statistics of the key rainfall properties (rainfall rate, duration, and peak) by hyetograph type before and after the reclassification (at Δt equals to 30 min) for each rainfall property. Concerning the rainfall rates, it is possible to observe that the SL-, UC-, and UL-events comprehended mostly the higher values before the reclassification, whereas a sharply scattering of R-events registers provided a significant difference in AEB after the reclassification (p < 0.0001) (Figure 7a and b); a slightly significant scattering of UR-events in CEB was also found (p < 0.05). This pinpoints the SL-events potential to yield rainfall rates with high intensity, which may lead to important environmental implications. The mean rainfall rates of all unimodal hyetographs ranged from ~10 to ~25 mm h-1, slightly higher
than the B-events, from 5 to ~14 mm h-1; the latter, however,
showed a significant difference in AEB (p < 0.0001), before and after the reclassification. The deep convective and stratiform clouds may explain the higher data dispersion in AEB and CEB, for they lead to a great concentration of intense events, from December to April in AEB, and from November to February in
CEB (CAMARASA-BELMONTE; SORIANO, 2014; PALHARINI; VILA, 2017; ZHANG et al., 2016).
The rainfall durations were not longer than 12 h due to the rigorous MIT criterion (equals to 30 min) used in this study, which eventually separated some near rainfall events (DUNKERLEY, 2010) (Figure 7c and d). The longest rainfall event was detected in GEB due to the shallow convective clouds observed in the extreme coastal zones of the tropical Northeast of Brazil (BRINGI et al., 2003; DILMI et al., 2016; PALHARINI; VILA, 2017; TEIXEIRA, 2008). The highest mean durations among hyetograph types were featured by the SL-events, varying from ~1.9 h (in GEB) to ~3.1 h (in AEB), which turned out to be reclassified, leading to a shrinking on the significant differences, only found in B-events (p < 0.0001). Before the reclassification, the CEB and GEB were both different from AEB also in relation to SL-events (p < 0.001 and p < 0.05, respectively), UR-events (p < 0.05 and p < 0.001), and B-events (p < 0.05 and p < 0.0001).
The peaks before the reclassification process behaved similarly to the rainfall rate, by comparing their different magnitudes between hyetograph types (Figure 7a and e). However, after the reclassification, the peak increased significantly, so that UC- and B-events showed differences (p < 0.0001) larger than before the reclassification (UL- and B-events: p < 0.05). CEB featured significant differences before and after the reclassification to AEB (SL- and B-events: p < 0.05; UC-events: p < 0.0001) and to GEB (SL- and UC-events: p < 0.001; UL-events: p < 0.05). Overall, the mean values of all events varied from 1 to 7 mm 5 min-1, with the
SL-events reaching the highest value values up to 13 mm 5 min-1.
Analysis of extreme SL-events
The relative frequencies of the heavier, longer and more intense SL-events, registered from 2005 to 2008 for each study site, are presented in Table 6. CEB showed the highest frequency of heavier and more intense SL-events (both 92%), whereas AEB showed the highest frequency of longer SL-events (73%) during the monitoring period. These proportions point out again the SL-events importance for the two semi-arid sites. The GEB showed the lowest frequency of longer SL-events (33%), although the heavier (54%) and more intense (70%) SL-events have relative expressive proportions when compared to the two study sites. Conversely, it is noteworthy that the SL-events absolute frequency in GEB had been much higher than the frequency observed in CEB and AEB (see Table 4).
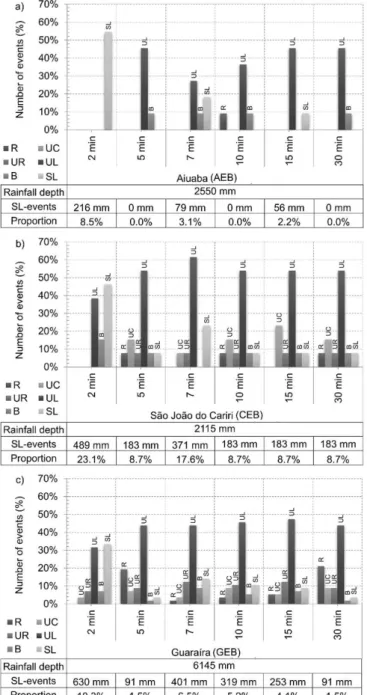
The relative number of events and their rainfall depths of the heavier SL-events were averaged by varying Δt from 2 to 30 min, in order to assess the potential of the rain pulse aggregation process in reclassifying the extreme rainfall events (in terms of rainfall rate) of each study site (Figure 8). Overall, the extreme SL-events frequency tends to reduce when the Δt increase. It is observed that at Δt equals to 2 min, the SL-events frequency remains high in all study sites, with rainfall depths varying from 216 (in AEB) to 630 mm (in GEB). Importantly, a relevant SL-events frequency reduction could be identified at Δt equals to 5 min, when the SL-events decreased to 0%, 8% and 4% in terms of number of events, and to 0%, 8.7% and 1.5% in terms of rainfall depth, in AEB, CEB and GEB, respectively. The SL-events reclassification at Δt equals to 30 min is similar to that at 5 min, which demonstrates the potential of the proposed process in reclassifying extreme (complex-shaped) events from small aggregation time spans. Moreover, large frequency oscillations of the other hyetograph types were not detected when the time spans equal to 5 and 30 min are compared, but the number of UL-events hit their maximum frequencies at different Δt values depending on the study site, i.e. 5 min in AEB (~46%), 7 min in CEB (~62%) and 15 min in GEB (~48%). During the reclassification process, the other hyetograph types alternate the second higher frequencies, especially the B-events in AEB, UC-event in CEB, and R-events and UR-events in GEB. Finally, some SL-events remained shapeless (unclassified) up to Δt equals to 30 min in CEB and GEB; they featured long durations (from 4h to 8h), high rainfall depths (up to 183 mm) and wide peak oscillation (up to 25 mm 5 min-1) (see Figure 6).
Table 6. Proportions of heavier, longer and more intense SL-events before the reclassification process.
Experimental basin Rate > 10 mm h-1 SL-events frequency (%)Duration > 120 min Peak > 3 mm 5 min-1
Aiuaba 46% 73% 55%
São João do Cariri 92% 54% 92%
Guaraíra 70% 33% 54%
Mean 70% 42% 61%
Figure 8. Relative frequency and rainfall depth proportion of heavier SL-events with intensities higher than 10 mm h-1 for
different time spans (2, 5, 7, 10, 15 and 30 min) in (a) AEB, (b) CEB, and (c) GEB.
CONCLUSION
The present study demonstrated that comparing statistically the key rainfall properties by hyetograph type might allow for making distinctions and finding similarities among the sub-hourly rainfall patterns under different climate conditions: tropical wet and very hot semi-arid. For such purposes, the rainfall events were defined using rigorous criteria with MIT and MRD equal to 30 min and 1.016 mm, respectively. The GEB showed a high annual rainfall depth (1536 mm) and a large number of events (909 events), of which the R-events stood out with 64% of events and 49% of rainfall depth, after SL-events reclassification. On the other hand, the semi-arid areas behaved differently: the CEB showed 528 mm and 228 events, of which 61% of events and 30% of rainfall depth are R-events (similar to GEB), whereas the AEB mostly displayed UL-events, featuring 57% of events and 63% of rainfall depth, despite having 229 events (similar to AEB). These results suggested that the precipitating cloud formations had important effects over the hyetograph properties: (1) the stratiform and deep convective clouds likely affected AEB and CEB, featuring similar mean and SD values of rainfall properties; and (2) the shallow convective clouds likely affected GEB, featuring short mean and high CV of rainfall properties. In addition, since CEB yielded similar hyetograph frequencies to GEB, it is also suggested that the shallow convective clouds extend their effects toward the eastern semi-arid zone.
This study also demonstrated that a simple process allows for the SL-events reclassification into known-shape hyetographs, i.e. R-, UL-, UC-, UR-, and B-events. The analyses depicted similar small proportions of SL-events in all study sites before (6%) and after (0.4%) the reclassification, even though they are located in different climate and weather conditions. A simple process based on rain pulse aggregation highlighted the SL-events importance since they featured higher rainfall depths (up to 183 mm), longer durations (up to 8h) and steep peaks (up to 40 mm 5 min-1). Results
revealed that (after reclassification) the SL-events became mostly UL-events, mainly in AEB (64%) and CEB (54%), showing that the rainfall depths of complex-shaped hyetographs are frequently concentrated in the first half of the rainfall event. The GEB also showed relevant proportions of SL-event reclassified into UL-events (49%). Finally, a considerable number of extreme SL-events with remarkable heavy, long and intense values could be reclassified with time spans up to 30 min.
Unlike other studies on this topic, this paper showed how conventional hyetograph design may disregard the predominant shape of extreme storms (frequently left-skewed), responsible for triggering severe hydrological responses. Thus, this study may be the first report of a detailed framework characterisation of sub-hourly rainfall events providing a set of hyetograph types with well-identified properties (after a reclassification process) under distinct climate conditions. Nevertheless, some gaps still restrained the procedure employed in this study: (1) the short number of study sites, (2) the absence of the implementation of an unbiased algorithm, (3) the use of fixed criteria, and (4) the analysis of few rainfall properties. Accordingly, we strongly urge that further investigations about the hyetograph defining criteria and properties, as well as that the implications of different hyetograph type on hydrological responses, be carried out in distinct regions
and even in a regional scale (e.g. by remote sensing); mainly focusing on complex-shaped rainfall events with long durations, high depths and steep peaks, since the rainfall is the main input for hydrological models.
ACKNOWLEDGEMENTS
The authors gratefully acknowledge the financial support from the Brazilian Innovation Agency (FINEP) granted to the BRAMAR (BRAzil Managed Aquifer Recharge, grant number 557/2013) project. This study was financed in part by the Coordenação de Aperfeiçoamento de Pessoal de Nível Superior - Brasil (CAPES) - Finance Code 001. In addition to the CAPES, the authors also acknowledge the Conselho Nacional de Desenvolvimento Científico e Tecnológico - Brasil (CNPq) and the Fundação de Apoio à Pesquisa do Estado da Paraíba - Brasil (FAPESQ) for the research (PQ, PDJ and DTI-B) and postgraduate (PhD and master) scholarships. The authors are finally grateful for the thoughtful inputs of the anonymous reviewers that undoubtedly contributed to improving the quality of the paper.
REFERENCES
ALVARES, C. A.; STAPE, J. L.; SENTELHAS, P. C.; GONÇALVES, J. L. M.; SPAROVEK, G. Köppen’s climate classification map for Brazil. Meteorologische Zeitschrift, v. 22, n. 6, p. 711-728, 2013. http:// dx.doi.org/10.1127/0941-2948/2013/0507.
BACK, Á. J. Time distribution of heavy rainfall events in Urussanga, Santa Catarina. Acta Scientiarum. Agronomy, v. 33, n. 4, p. 583-588, 2011. http://dx.doi.org/10.4025/actasciagron.v33i4.6664.
BALL, J. E. The influence of storm temporal patterns on catchment response. Journal of Hydrology (Amsterdam), v. 158, n. 3-4, p. 285-303, 1994. http://dx.doi.org/10.1016/0022-1694(94)90058-2.
BRINGI, V. N.; CHANDRASEKAR, V.; HUBBERT, J.; GORGUCCI, E.; RANDEU, W. L.; SCHOENHUBER, M. Raindrop size distribution in different climatic regimes from disdrometer and dual-polarized radar analysis. Journal of the Atmospheric Sciences, v. 60, n. 2, p. 354-365, 2003. http://dx.doi.org/10.1175/1520-0469(2003)060<0354:RSDIDC>2.0.CO;2.
CAMARASA-BELMONTE, A. M.; SORIANO, J. Empirical study of extreme rainfall intensity in a semi-arid environment at different time scales. Journal of Arid Environments, v. 100-101, p. 63-71, 2014. http://dx.doi.org/10.1016/j.jaridenv.2013.10.008.
COELHO, V. H. R.; MONTENEGRO, S. M. G. L.; ALMEIDA, C. N.; SILVA, B. B.; OLIVEIRA, L. M.; GUSMÃO, A. C. V.; FREITAS, E. S.; MONTENEGRO, A. A. A. Alluvial groundwater recharge estimation in semi-arid environment using remotely sensed data. Journal of Hydrology (Amsterdam), v. 548, p. 1-15, 2017. http://dx.doi.org/10.1016/j.jhydrol.2017.02.054.
raingauges located in northeast Brazil. Proceedings of the International Association of Hydrological Sciences, v. 364, june, p. 345-350, 2014. http://dx.doi.org/10.5194/piahs-364-345-2014.
DILMI, M. D.; MALLET, C.; BARTHES, L.; CHAZOTTES, A. Data-driven clustering of rain events: microphysics information derived from macro scale observations. Atmospheric Measurement Techniques Discussions, p. 1-29, nov., 2016.
DUAN, Z.; BASTIAANSSEN, W. G. M. First results from Version 7 TRMM 3B43 precipitation product in combination with a new downscaling–calibration procedure. Remote Sensing of Environment, v. 131, p. 1-13, 2013. http://dx.doi.org/10.1016/j.rse.2012.12.002.
DUNKERLEY, D. L. Rain event properties in nature and in rainfall simulation experiments: a comparative review with recommendations for increasingly systematic study and reporting. Hydrological Processes, v. 22, n. 22, p. 4415-4435, 2008a. http:// dx.doi.org/10.1002/hyp.7045.
DUNKERLEY, D. L. Identifying individual rain events from pluviograph records: a review with analysis of data from an Australian dryland site. Hydrological Processes, v. 22, n. 26, p. 5024-5036, 2008b. http://dx.doi.org/10.1002/hyp.7122.
DUNKERLEY, D. L. How do the rain rates of sub-event intervals such as the maximum 5-and 15-min rates (I5 or I30) relate to the properties of the enclosing rainfall event? Hydrological Processes, v. 24, n. 17, p. 2425-2439, 2010.
DUNKERLEY, D. L. Effects of rainfall intensity fluctuations on infiltration and runoff: rainfall simulation on dryland soils, Fowlers Gap, Australia. Hydrological Processes, v. 26, n. 15, p. 2211-2224, 2012. http://dx.doi.org/10.1002/hyp.8317.
DUNKERLEY, D. L. Intra-event intermittency of rainfall: an analysis of the metrics of rain and no-rain periods. Hydrological Processes, v. 29, n. 15, p. 3294-3305, 2015. http://dx.doi.org/10.1002/ hyp.10454.
FANELLI, R.; PRESTEGAARD, K.; PALMER, M. Evaluation of infiltration-based stormwater management to restore hydrological processes in urban headwater streams. Hydrological Processes, v. 31, n. 19, p. 3306-3319, 2017. http://dx.doi.org/10.1002/hyp.11266.
FIGUEIREDO, J. V.; ARAÚJO, J. C.; HENRIQUE, P.; MEDEIROS, A. C.; ALEXANDRE, C. C. Runoff initiation in a preserved semiarid Caatinga small watershed, Northeastern Brazil. Hydrological Processes, 2016.
HAILE, A. T.; RIENTJES, T. H. M.; HABIB, E.; JETTEN, V.; GEBREMICHAEL, M. Rain event properties at the source of the Blue Nile River. Hydrology and Earth System Sciences, v. 15, n. 3, p. 1023-1034, 2011. http://dx.doi.org/10.5194/hess-15-1023-2011.
JENA, P. P.; CHATTERJEE, C.; PRADHAN, G.; MISHRA, A. Are recent frequent high floods in Mahanadi basin in eastern India due to increase in extreme rainfalls? Journal of Hydrology
(Amsterdam), v. 517, p. 847-862, 2014. http://dx.doi.org/10.1016/j. jhydrol.2014.06.021.
LOZANO-PARRA, J.; VAN SCHAIK, N. L. M. B.; SCHNABEL, S.; GÓMEZ-GUTIÉRREZ, Á. Soil moisture dynamics at high temporal resolution in a semiarid Mediterranean watershed with scattered tree cover. Hydrological Processes, v. 30, n. 8, p. 1155-1170, 2016. http://dx.doi.org/10.1002/hyp.10694.
MEDEIROS, P. H. A.; ARAÚJO, J. C. Temporal variability of rainfall in a semiarid environment in Brazil and its effect on sediment transport processes. Journal of Soils and Sediments, 2014.
MEDINA-COBO, M. T.; GARCÍA-MARÍN, A. P.; ESTÉVEZ, J.; AYUSO-MUÑOZ, J. L. The identification of an appropriate Minimum Inter-event Time (MIT) based on multifractal characterization of rainfall data series. Hydrological Processes, v. 30, n. 19, p. 3507-3517, 2016. http://dx.doi.org/10.1002/hyp.10875.
MELO, D. C. D.; XAVIER, A. C.; BIANCHI, T.; OLIVEIRA, P. T. S.; SCANLON, B. R.; LUCAS, M. C.; WENDLAND, E. Performance evaluation of rainfall estimates by TRMM Multi-satellite precipitation analysis 3B42V6 and V7 over Brazil. Journal of Geophysical Research, D, Atmospheres, v. 120, n. 18, p. 9426-9436, 2015. http://dx.doi.org/10.1002/2015JD023797.
MOLINA-SANCHIS, I.; LÁZARO, R.; ARNAU-ROSALÉN, E.; CALVO-CASES, A. Rainfall timing and runoff: the influence of the criterion for rain event separation separation. Journal of Hydrology and Hydromechanics, v. 64, n. 3, p. 226-236, 2016. http:// dx.doi.org/10.1515/johh-2016-0024.
NOJUMUDDIN, N. S.; YUSOF, F.; YUSOP, Z. Determination of minimum inter-event time for storm characterisation in Johor, Malaysia. Journal of Flood Risk Management, v. 11, p. S687-S699, 2016. http://dx.doi.org/10.1111/jfr3.12242.
PALHARINI, R. S. A.; VILA, D. A. Climatological behavior of precipitating clouds in the northeast region of Brazil. Advances in Meteorology, v. 2017, p. 17-21, 2017. https://doi. org/10.1155/2017/5916150.
PASCHALIS, A.; FATICHI, S.; MOLNAR, P.; RIMKUS, S.; BURLANDO, P. On the effects of small scale space-time variability of rainfall on basin flood response. Journal of Hydrology (Amsterdam), v. 514, p. 313-327, 2014. http://dx.doi.org/10.1016/j. jhydrol.2014.04.014.
PINHEIRO, E. A. R.; COSTA, C. A. G.; ARAÚJO, J. C. Effective root depth of the Caatinga biome. Journal of Arid Environments, v. 89, p. 1-4, 2013. http://dx.doi.org/10.1016/j.jaridenv.2012.10.003.
RICKENMANN, D.; BADOUX, A.; HUNZINGER, L. Significance of sediment transport processes during piedmont floods: the 2005 flood events in Switzerland. Earth Surface Processes and Landforms, v. 41, n. 2, p. 224-230, 2016. http://dx.doi.org/10.1002/esp.3835.
ROUILLARD, A.; SKRZYPEK, G.; DOGRAMACI, S.; TURNEY, C.; GRIERSON, P. F. Impacts of high inter-annual variability of rainfall on a century of extreme hydrologic regime of northwest Australia. Hydrology and Earth System Sciences, v. 19, n. 4, p. 2057-2078, 2015. http://dx.doi.org/10.5194/hess-19-2057-2015.
SALES, E. G.; ALMEIDA, C. N.; FARIAS, A. S.; COELHO, V. H. R. Hydrodynamic characterization of soils within a representative watershed in northeast Brazil. Proceedings of the International Association of Hydrological Sciences, v. 364, p. 94-99, 2014. http:// dx.doi.org/10.5194/piahs-364-94-2014.
SORDO-WARD, A.; BIANUCCI, P.; GARROTE, L.; GRANADOS, A. The influence of the annual number of storms on the derivation of the flood frequency curve through event-based simulation. Water (Basel), v. 8, n. 8, p. 335, 2016. http://dx.doi.org/10.3390/ w8080335.
TEIXEIRA, R. F. B. O fenômeno da brisa e sua relação com a chuva sobre Fortaleza-CE. Revista Brasileira de Meteorologia, v. 23, n. 3, p. 282-291, 2008. http://dx.doi.org/10.1590/S0102-77862008000300003.
TODISCO, F. The internal structure of erosive and non-erosive storm events for interpretation of erosive processes and rainfall simulation. Journal of Hydrology (Amsterdam), v. 519, p. 3651-3663, 2014. http://dx.doi.org/10.1016/j.jhydrol.2014.11.002.
TOKAY, A.; SHORT, D. A. Evidence from tropical raindrop spectra of the origin of rain from stratiform versus convective clouds. Journal of Applied Meteorology, v. 35, n. 3, p. 355-371, 1996. http://dx.doi.org/10.1175/1520-0450(1996)035<0355:EFTRS O>2.0.CO;2.
WASKO, C.; SHARMA, A. Steeper temporal distribution of rain intensity at higher temperatures within Australian storms. Nature Geoscience, n. June, p. 8-11, 2015.
WASKO, C.; SHARMA, A.; WESTRA, S. Reduced spatial extent of extreme storms at higher temperatures. Geophysical Research Letters, v. 43, n. 8, p. 4026-4032, 2016. http://dx.doi. org/10.1002/2016GL068509.
WYNN, J. K. Seasonal and geographic variability in rainstorm parameter distributions. 1994. 102 f. Thesis (MSc.) –Massachusetts Institute of Technology, Cambridge, 1994.
YANG, Y.; LUO, Y. Evaluating the performance of remote sensing precipitation products CMORPH, PERSIANN, and TMPA, in the arid region of northwest China. Theoretical and Applied Climatology, p. 1-17, oct., 2014.
ZHANG, Z.-S.; ZHAO, Y.; LI, X.-R.; HUANG, L.; TAN, H.-J. Gross rainfall amount and maximum rainfall intensity in 60-minute influence on interception loss of shrubs: a 10-year observation in the Tengger Desert. Scientific Reports, v. 6, p. 26030, 2016. http:// dx.doi.org/10.1038/srep26030. PMID: 27184918.
ZHU, H. D.; SHI, Z. H.; FANG, N. F.; WU, G. L.; GUO, Z. L.; ZHANG, Y. Soil moisture response to environmental factors following precipitation events in a small catchment. Catena, v. 120, p. 73-80, 2014. http://dx.doi.org/10.1016/j.catena.2014.04.003.
Authors contributions
Luís Romero Barbosa: First author who contributed to the research proposal development, VBA routine implementation, literature review, analysis and discussion of results, methodology definition, as well as writing and formatting of the paper.
Cristiano das Neves Almeida: Principal advisor and corresponding author who contributed to the research proposal development, data assimilation and retrieval in GEB study area, VBA routine implementation, literature review, methodology definition, and revision of the paper.
Victor Hugo Rabelo Coelho: Third author who contributed to the analysis and discussion of results, literature review, revision of methodology, as well as writing and formatting of the paper.
Emerson da Silva Freitas: Fourth author who contributed to the VBA routine implementation, obtaining and analysis of results, and methodology definition.
Carlos de Oliveira Galvão: Co-advisor on research who contributed to the revision of the proposal, data assimilation and retrieval in CEB study area, and discussion of the results.
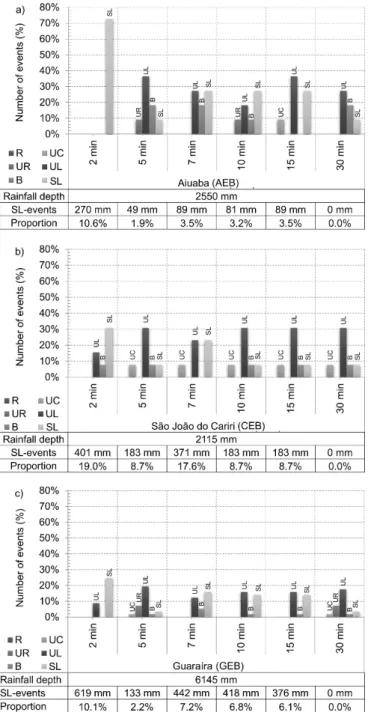
APPENDIX A: FREQUENCY AND RAINFALL DEPTH OF EXTREME SL-EVENTS FOR DURATION AND PEAK THRESHOLDS.
Figure A1. Relative frequency and rainfall depth proportion of heavier SL-events with durations longer than 120 min for different time spans (2, 5, 7, 10, 15 and 30 min) in (a) AEB, (b) CEB, and (c) GEB.
Figure A2. Relative frequency and rainfall depth proportion of heavier SL-events with peaks higher than 3 mm 5 min-1 for