Radarsat backscattering from an agricultural scene(1)
Antonio Roberto Formaggio(2), José Carlos Neves Epiphanio(2) and Maurício dos Santos Simões(2)
Abstract Orbital remote sensing in the microwave electromagnetic region has been presented as an important tool for agriculture monitoring. The satellite systems in operation have almost all-weather capability and high spatial resolution, which are features appropriated for agriculture. However, for full exploration of these data, an understanding of the relationships between the characteristics of each system and agricultural targets is necessary. This paper describes the behavior of backscattering coeffi-cient (so) derived from calibrated data of Radarsat images from an agricultural area. It is shown that in
a dispersion diagram of so there are three main regions in which most of the fields can be classified.
The first one is characterized by low backscattering values, with pastures and bare soils; the second one has intermediate backscattering coefficients and comprises well grown crops mainly; and a third one, with high backscattering coefficients, in which there are fields with strong structures causing a kind of double bounce effect. The results of this research indicate that the use of Radarsat images is optimized when a multitemporal analysis is done making the best use of the agricultural calendar and of the dynamics of different cultures.
Index terms: remote sensing, radar, land use, farmland.
Retroespalhamento de uma cena agrícola em imagem de radar
Resumo A faixa espectral das microondas tem uma importância para o sensoriamento remoto agríco-la, por ser uma faixa em que se tem uma quase certeza de disponibilidade de imagens de satélite, independentemente das condições atmosféricas. Entretanto, embora haja satélites em operação na fai-xa do radar, o aproveitamento desses dados ainda não é plenamente satisfatório, principalmente em virtude da falta de entendimento das interações que ocorrem entre o radar e os alvos agrícolas. Neste trabalho, são utilizadas três passagens do Radarsat para agrupar os valores de retroespalhamento (so)
representativos das diversas condições dos talhões agrícolas em uma região intensamente cultivada. Num diagrama de dispersão dos valores de so, pôde-se verificar a existência de três grandes regiões:
uma, caracterizada por baixos valores, e constituída por solos expostos; a segunda, com valores inter-mediários e constituída por culturas bem desenvolvidas; e uma terceira, com altos valores de retroespalhamento, constituída por superfícies muito rugosas, particularmente quando os sulcos de plantio são perpendiculares à direção de visada do satélite. Os resultados deste trabalho indicam que o uso de imagens Radarsat para agricultura é mais otimizado quando se faz uma análise multitemporal, aproveitando o calendário agrícola e a dinâmica das diferentes culturas.
Termos para indexação: sensoriamento remoto, uso da terra, terras agrícolas.
Introduction
Orbital remote sensing data have been available since the early seventies, and are based mainly on optical systems, e.g. Landsat and SPOT satellites. These systems have granted many useful data for crop monitoring, crop area and yield estimation (Ippoliti-Ramilo et al., 1999), and derivation of important crop (1)Accepted for publication on July 17, 2000.
This work is part of the Globesar-2 program and was partially financed by CCRS (Canadian Centre for Remote Sensing). (2)Instituto Nacional de Pesquisas Espaciais (INPE), Divisão de
variables (Epiphanio et al., 1997). However, the use of optical remote sensing in large scale for agricul-tural monitoring is hampered by cloud cover, mainly in most of tropical countries. In these countries more than 80% of the crop production come from the sum-mer growing season, when the cloud cover is high.
Radar (radio detection and ranging) data partici-pation in remote sensing activities has been growing during the last years all over the world. Radar sys-tems have almost all-weather imaging capability, and can be acquired in day or night conditions, thus in-creasing the chance of providing useful data. Thus, it is shown as a very interesting data source for agri-culture purposes. However, the nature of radar inter-action with targets is quite different from that of op-tical signal. Geometric and electrical properties of targets are very important in radar wavebands (Lewis et al., 1998), while physical and chemical properties are important in optical regions. Nevertheless, as the radar and optical properties of interaction with tar-gets are distinct, there is a clear complementary na-ture between these two data sources.
With the new orbital radar systems available last years (ERS - European Remote Sensing Satellite, JERS - Japan Earth Resources Satellite, and Radarsat) there was an increase in studies trying to couple ra-dar data into agricultural remote sensing programs (Brisco & Brown, 1998). In order to full explore the radar data as a useful source of data for agriculture it is necessary to understand the interactions between radar signal and the crop variables along its devel-opment in the field.
Thus, the main objective of this paper is to char-acterize and discuss the general pattern of the back-scattering signal in a scene with various kinds of ag-ricultural land uses, and to investigate the multitemporal behavior of backscattering signal de-rived from some specific field conditions from Radarsat images.
The backscattering coefficient (so) is an impor-tant parameter to be acquired in radar images. As explained by Dobson et al. (1995), the so is the result of: a) geometric factors - related to the surface attributes of targets, and b) of electric factors - re-lated to dielectric properties of soil and vegetation cover, for a given wavelength. The geometric factors can be divided into macro and microtopography. The
macrotopography refers to the terrain topography or relief and it affects the signal that comes from a large region of the terrain. The microtopography or the roughness is more related to the particular conditions of a specific field, e.g. the soil tillage condition, or the leaf and plant arrangements (Moran et al., 1998). The electric factors are influenced by the dielectric properties of the elements that constitute the area of terrain illuminated by the radar beam. In this sense, the soil and plant relations to water play an impor-tant role on the backscattering signal.
When the sensor system is considered, Brisco & Brown (1998) indicate that frequency, incidence angle and polarization are the main factors that in-fluence target signal sensed in the microwave region. In addition, there are the spatial resolutions in azi-muth and range, the path width, and the power of transmitted pulse.
Specifically for vegetation, Ulaby et al. (1986) point out six main factors that influence the radar backscattering: (a) the dielectric constant of the veg-etation material; (b) the size of canopy diffusing ele-ments, like leaves, trunks, fruits and flowers; (c) the shape and orientation of diffusing elements; (d) the roughness and dielectric constant of the soil beneath the canopy; (e) the geometry of the soil cover (in-cluding row direction, row spacing, percent ground cover, and plants height). Most of these factors are discussed in Simões (1999).
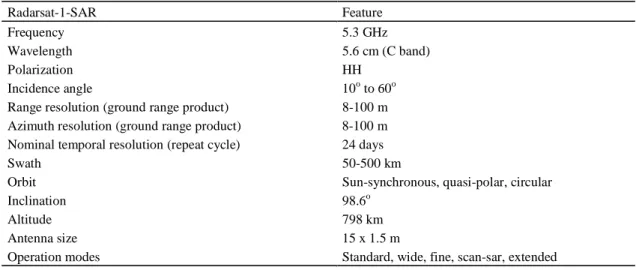
Radarsat-1 is a platform with a C-band radar launched by Canada in 1995. Some of its main fea-tures are the possibilities for user to choose the inci-dence angle, the operation mode, and the spatial reso-lution. The main Radarsat features are in Table 1. The possibility of changing the incidence angle allows the temporal revisit interval to change, thus increas-ing the monitorincreas-ing capabilities.
Material and Methods
Crop development is a dynamic process. Different crops present individual characteristics of development. In many cases, these differences are used in agricultural remote sensing to extract information on crop type and crop stage. In addition, in tropical countries, the crop calendar is not very rigid because it is dependent on the weather condi-tions and on the right soil moisture condicondi-tions for the plant-ing. If remote sensing is to be efficiently used for crop monitoring, such differences in crop development have to be explored. Since radar data can be acquired in any cloud condition, the full temporal resolution of the system can be explored, and thus various images can be acquired dur-ing the crop growdur-ing season. Indeed, in order to follow the development of a test site it is necessary to gather as many images as possible (Liew et al., 1998).
Radarsat acquisition program is useful for multiple date acquiring. If the incidence angle is not fixed, more than one image can be acquired in less than the nominal tem-poral resolution (for Radarsat the repeat cycle is 24 days).
However, in this study, the incidence angle and other ac-quisition parameters were maintained the same. Thus, three images in mode Fine F4 (43.8o to 45.6o incidence angle) were acquired in descending orbit over the test site: Janu-ary 5th, FebruJanu-ary 22nd and March 20th, 1998. With these three images a multitemporal analysis of the scene con-taining agriculture fields was accomplished.
The test site was at Sumaré, São Paulo State, Brazil (coordinates 22o55' to 22o48' S and 47o20' to 47o21' W). Different land uses can be found in this area. The main uses are with agriculture. The crop calendar is flexible; when the images were acquired, it could be found bare soil, tomato, sugarcane, cotton, corn, fallow fields, and pastures, mainly. The rain was monitored, and in January, one day before the image acquisition there was a 24.0 mm rainfall; two days before the February acquisition the rain-fall was 19.6 mm; and in March there was no rainrain-fall at least five days before Radarsat image acquisition. In addi-tion, the dew was strong in February. All the fields were visited during the three radar image acquisition dates, and data such as crop type, stage and height, row direction, and soil surface condition were acquired. Another kind of data used in this work were 35 mm low altitude aerial pho-tographs, which were acquired at the same days as the Radarsat image acquisitions. These pictures helped the fieldwork and allowed making a fast and detailed descrip-tion of the fields. Actually, in this kind of research it is difficult to delineate a systematic sampling of targets in the same condition. For instance, usually it is hard to find a number of sugarcane fields at the same phenological stage and same row direction. Thus, it was tried to encompass
Source: Parashar et al. (1993).
Radarsat-1-SAR Feature
Frequency 5.3 GHz
Wavelength 5.6 cm (C band)
Polarization HH
Incidence angle 10o to 60o
Range resolution (ground range product) 8-100 m
Azimuth resolution (ground range product) 8-100 m
Nominal temporal resolution (repeat cycle) 24 days
Swath 50-500 km
Orbit Sun-synchronous, quasi-polar, circular
Inclination 98.6o
Altitude 798 km
Antenna size 15 x 1.5 m
Operation modes Standard, wide, fine, scan-sar, extended
most of the crop and/or soil conditions in order to repre-sent most of the patterns of Radarsat backscattering and type of interactions with agricultural scenes.
For the quantitative analysis, PCI software (PCI, 1997) was used, and the so values were extracted. In order to accomplish this step, the original data were calibrated and then transformed to intensity values. For each field, a large number (from 150 to 7,000 pixels) of the backscattering intensity values, in grey levels, were extracted and the mean, standard deviation and standard error of the mean were calculated. The conversion to backscattering in dB values (,G%) was performed using the following relation-ship (Brakke et al., 1981):
int 10 dB 10log I
I = (1)
where
int
, is the mean of each sample in grey levels ex-tracted from the intensity image.
In addition, the confidence intervals were calculated using the equation 2, according to DeGroot (1989) adapted to radar:
+ 〈
〈
−
n s 2 I log 10 I n s 2 I log
10 int dB int (2)
where ,G% is the mean backscattering in dB values for each field sample, n is the number of pixels in each sample,
and s is standard deviation. Additional details about the
image processing can be found in Simões (1999). Profiles of the mean and standard error of the mean of the so were derived for various fields in order to analyze the relationships between agricultural land use and the general pattern of the backscattering signal.
Results and Discussion
The agricultural scene is composed of many types of agricultural targets. In this work, the main agri-cultural targets were grouped into bare soil (bs), tilled soil (ts), fallow field (f), sugarcane (sc), corn (co), tomato (t), cotton (ct), pastures (p), and beans (b). Roughly, these targets are very representative of the agriculture in São Paulo State.
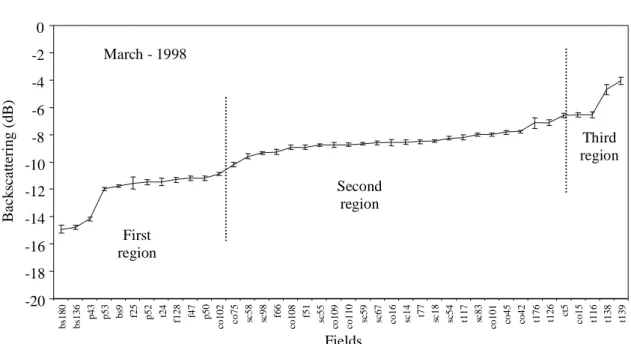
In order to derive the quantitative relationship between the backscattering coefficient and the vari-ous types of agricultural targets, an analysis of dis-persion of backscattering values for fields was per-formed. These results are shown in Figures 1, 2 and 3 for January, February and March, respectively. The crescent distribution of the backscattering values
generates a curve with three distinctive regions. The first region is characterized by low backscattering values, but with strong positive inclination (log-like curve). The second region is a positive linear-like with very low inclination and intermediate so val-ues, and the third region is a fast positive exponen-tial-like curve with high so values. The same general pattern is found for the three used images.
Each of these regions groups roughly fields with specific characteristics. The first region groups the targets with very low backscattering values, which are bare soils, pastures, low fallow fields, and some tilled areas. In general, this region presents fields with backscattering values lower than -11 dB. If the soil surface is smooth, such as when it is prepared for grain seeding, it can be considered a smooth surface for radar signal. However, there is a condition of soil preparing that must be considered. Some crops need a special tillage, such as furrows. If these furrows are shallow, the surface is smooth irrespective of the furrow direction. However if the furrows are deep (tomato fields, for instance), thus the furrow direc-tion becomes important. In addidirec-tion, if the deep fur-rows are nearly parallel to the radar viewing direc-tion, the surface tends to seem smooth in radar im-age. On the other hand, if the deep furrows are per-pendicular to the radar viewing direction, the sur-face becomes strongly rough, making the backscat-tering to be very high and thus making that field to be bright in the radar image. The low pastures, even if they are not very regular, are seen by radar as rela-tively smooth surfaces, indicating the influence of the underlying soil, and are relatively dark in radar images. These results are in accordance with Brisco et al. (1991), when evaluating the effect of tillage row direction relative to radar look direction on radar backscattering coefficient for three radar frequencies. These situations can be illustrated by the cases a and
b of the Figure 4.
-20 -18 -16 -14 -12 -10 -8 -6 -4 -2 0 b
s25 ts24
b
s18
0
bs1
76 p43
bs1
39
bs1
17 f66
b
s75 sc58 p5
2 co 5 1 p5 0 sc 5 9 sc 9 8 sc
54 p53
ts1 2 6 ts 77 f9 co 4 2 sc 67 co 1 0 8 f1 2 8 co 4 5 co 1 0 2 co 1 5 sc 55 co 1 0 9 co 1 1 0 co 1 6 co 1 3 6 sc 18 sc 14 co 1 0 1 sc 83 co 4 7 ct 5 ts1 1 6 ts1 3 8 Fields Bac k scat te ri n g ( d B)
January - 1998
First region Second region Third region
Figure 1. Backscattering values for each field in January. Letters indicate the use: b (bean), bs (bare soil), co (corn), ct (cotton), f (fallow field), p (pastures), sc (sugarcane), t (tomato), ts (tilled soil). Vertical bars indicate the standard error of the mean.
-20 -18 -16 -14 -12 -10 -8 -6 -4 -2 0
p43 f47 f51 t77
bs18
0
sc
59 t24 p52 f66
sc
5
8
ts
117 p53 sc5
4
sc
9
8
p50 f25 bs136 sc
67
co45 co1
0
2
co42 sc1
4 sc 1 8 f9 sc 5 5 co
101 sc8
3
f128 co75 co108 ts176 co1
1
0
c
o109 co15 co16 sc
t5
t116 t126 t138 t139
Fields B ack sc atter in g ( d B )
February - 1998
First region Second region Third region
Figure 2. Backscattering values for each field in February. Letters indicate the use: b (bean), bs (bare soil), co (corn), ct (cotton), f (fallow field), p (pastures), sc (sugarcane), t (tomato), ts (tilled soil). Vertical bars indicate the standard error of the mean.
present a vegetation height greater than 0.5 m and are well homogeneous. When the vegetation is well developed, the radiation that reaches the canopy is partially scattered and partially extinguished inside
-20 -18 -16 -14 -12 -10 -8 -6 -4 -2 0
bs180 bs136
p43 p53 bs9 f25 p52 t24 f128 f47 p5
0
co102 c o75 sc5
8
sc
9
8
f6
6
co108
f5
1
sc
55
co109 co11
0
sc
59
sc
67
co16 sc14 t7
7
sc
1
8
sc
54
t117 sc8
3
co101 co45 co42 t176 t126
ct
5
c
o15 t116 t138 t139
Fields
B
ack
scat
ter
in
g
(
d
B
)
March - 1998
First region
Second region
Third region
Figure 3. Backscattering values for each field in March. Letters indicate the use: b (bean), bs (bare soil), co (corn), ct (cotton), f (fallow field), p (pastures), sc (sugarcane), t (tomato), ts (tilled soil). Vertical bars indicate the standard error of the mean.
that most of the LAI values (between 0.5 and 5) were in the -12.5 and -7 dB interval.
The third region of the backscattering dispersion diagrams (Figures 1 to 3) groups fields with back-scattering values higher than -7 dB. These targets are considered rough in the radar C frequency region (see case c in Figure 4) generating high backscattering signals. In this region there were found mainly bare soil fields tilled with deep furrows perpendicular to the radar viewing direction. These fields were tilled for tomato. In general, these structures cause strong double bounce effects (Brisco et al., 1991). These effects are caused by a combination of radar beam direction and the orientation of the feature resulting in high returns towards the radar sensor. The same effect was observed for the single cotton field found in the test site. This field was planted perpendicular to the radar viewing direction also. Moran et al. (1998) also found the furrows and their directions in cotton fields as affecting the radar backscattering sig-nal. We attribute this strong backscattering signal to the wall-like effect of the cotton field. However, in this specific field it is difficult to evaluate all the fac-tors affecting the backscattering signal. In short, Fig-ure 4 depicts a general backscattering model to ex-plain a complex agricultural scene.
From these analyses it is clear that three broad backscattering regions are quite noticeable in Radarsat images. In addition, this pattern is consis-tent for the three radar scenes in different dates. It is supposed that this pattern can be followed as a rule. If this is true, it could be used in a classification scheme as a first step to categorize the scene. Then, each specific region should be analyzed in detail in order to extract information on specific fields. For instance, in the second region (Figures 1 to 3), which has most of growing crops, there was not found a clear pattern that could be used to discriminate corn from sugarcane. However, if the crop calendar is explored, it could be possible to use the field back-scattering patterns inside this region for this kind of separation. This leads to a clear statement that the use of Radarsat data in agriculture has to be done in a multitemporal context.
Conclusions
1. Radar agricultural scenes present a clear pat-tern for the backscattering signals.
2. This pattern can be divided into three main re-gions: one of low backscattering values (around -11 dB and lower), a second one with intermediate values (from -11 to -7 dB), and a third one with high values (higher than around -7 dB).
3. The first region comprises smooth surfaces as pastures, bare soil, and low fallow fields; the second one is comprised of intermediately smooth to rough surfaces as corn, sugarcane, and the main crops; and the third region is composed of rough surfaces or highly structured features, like soil prepared with deep furrows perpendicular to the radar beam direction, some crops like cotton, and man made features.
4. For the best exploration of radar data for agri-culture it is important to follow the crop calendar; it is highly recommended multitemporal acquisitions of satellite radar data.
Acknowledgements
To Dr. Corina C. Freitas for her assistance; to Dr. Waldir R. Paradella for his Brazilian Globesar-2 Coordination; the first two authors thank CNPq (Conselho Nacional de Desenvolvimento Científico e Tecnológico) for their scholarships; the last author thanks CAPES (Coordenadoria de Aperfeiçoamento de Pessoal de Ensino Superior) for his scholarship.
References
BRAKKE, T. W.; KANEMASU, E. T.; STEINER, J. L.; ULABY, F. T.; WILSON, E. Microwave response to leaf-area index, and dry weight of wheat, corn, and sorghum. Remote Sensing of Environment, New York, v. 11, n. 2, p. 207-220, 1981.
BRISCO, B.; BROWN, R. J. Agricultural applications with radar. In:HENDERSON, F. M.; LEWIS, A. J. (Ed.). Prin-ciples and applications of imaging radar.New York : Wiley, 1998. p. 381-406.
BRISCO, B.; BROWN, R. J.; SNIDER, G. J.; SOFKO, J. A.; KOEHLER, J. A.; WACKER, A. G. Tillage effects on the radar backscattering coefficient of grain stubble fields. International Journal of Remote Sensing, Lon-don, v. 12, n. 11, p. 2283-2298, 1991.
DE GROOT, M. H. Probability and statistics. Reading : Addison-Wesley, 1989. 607 p.
DOBSON, M. C.; ULABY, F. T.; PIERCE, L. E. Land cover classification and estimation of terrain attributes using synthetic aperture radar. Remote Sensing of Envi-ronment, New York, v. 51, p. 199-214, 1995.
EPIPHANIO, J. C. N.; ALMEIDA JÚNIOR, A. C.; FORMAGGIO, A. R. Wheat development evaluated by remote sensing using two vegetation indices. Anais da Academia Brasileira de Ciências, Rio de Janeiro, v. 69, n. 4, p. 471-478, 1997.
FERRAZOLLI, P.; PALOSCIA, S.; PAMPALONI, P.; SCHIAVON, G.; SIGISMONDI, S.; SOLIMINI, D. The potential of multifrequency polarimetric SAR in assess-ing agricultural and arboreous biomass. IEEE Transac-tions on Geoscience and Remote Sensing, Piscataway, v. 35, n. 1, p. 5-17, 1997.
IPPOLITI-RAMILO, G. A.; EPIPHANIO, J. C. N.; SHIMABUKURO, Y. E.; FORMAGGIO, A. R. Sensoriamento remoto orbital como meio auxiliar na previsão de safras. Agricultura em São Paulo, São Paulo, v. 46, n. 1, p. 89-101, 1999.
LEWIS, A. J.; HENDERSON, F. M.; HOLCOMB, D. W. Radar fundamentals: the geoscience perspective. In: HENDERSON, F. M.; LEWIS, A. J. Principles and ap-plications of imaging radar. New York : Wiley, 1998. p. 131-181.
LIEW, S. C.; KAM, S. P.; TUONG, T. P.; CHEN, P.; MINH, V. Q.; LIM, H. Application of multitemporal ERS-2 synthetic aperture radar in delineating rice cropping sys-tems in the Mekong river delta, Vietnam. IEEE Transac-tions on Geoscience and Remote Sensing, Piscataway, v. 36, n. 5, p. 1412-1420, 1998.
MORAN, M. S.; VIDAL, A.; TROUFLEAU, D.; INOUE, Y.; MITCHELL, T. A. Ku- and C-band SAR for discrimi-nating agricultural crop and soil conditions. IEEE Trans-actions on Geoscience and Remote Sensing, Piscataway, v. 36, n. 1, p. 265-272, 1998.
PARASHAR, S.; LANGHAM, E.; MCNALLY, J.; AHMED, S. Radarsat mission requirements and concept. Canadian Journal of Remote Sensing, Ottawa, v. 19, n. 4, p. 280-288, 1993.
PCI (Ottawa, Canada). PCI manual of reference: version 6.2. Ottawa, 1997. 243 p.
SIMÕES, M. S. Análise de dados multitemporais Radarsat-1 para o sensoriamento remoto de culturas agrícolas. São José dos Campos : INPE, 1999. 139 p. M.Sc. Thesis.
SOARES, J. V.; RENNÓ, C. D.; FORMAGGIO, A. R.; YANASSE, C. C. F.; FRERY, A. C. An investigation of the selection of texture features for crop discrimination using SAR imagery. Remote Sensing of Environment, New York, v. 59, n. 2, p. 234-247, 1997.
TSO, B.; MATHER, P. M. Crop discrimination using multi-temporal SAR imagery. International Journal of Remote Sensing, London, v. 20, n. 12, p. 2443-2460, 1999. ULABY, F. T.; ALLEN, C. T.; EGER, G.; KANEMASU, E. Relating the microwave backscattering coefficient to leaf area index. Remote Sensing of Environment, New York, v. 14, n. 2, p. 113-133, 1984.