LUZ ADRIANA DIAZ CANO
BIOSORPTION PARAMETERS: CAROB
KIBBLES (CERATONIA SILIQUA) AS A
POTENTIAL BIOSORBENT FOR BORON
REMOVAL FROM AQUEOUS SOLUTIONS
Faculdade de Ciências e Tecnologia, Universidade do Algarve
2018
2
SUPERVISOR
THIS MASTER RESEARCH THESIS WAS CONDUCTED
IN THE LABORATORIES OF THE FACULDADE DE
CIÊNCIAS E TECHNOLOGIA AT THE UNIVERSIDADE
DO ALGARVE UNDER THE SUPERVISION OF
PROFESSOR MARIA CLARA COSTA
BIOSORPTION PARAMETERS: CAROB
KIBBLES (CERATONIA SILIQUA) AS
POTENTIAL BIOSORBENT FOR BORON
REMOVAL FORM AQUEOUS SOLUTIONS
I declare to be the author of this work, which is original and
unpublished. Authors and works consulted are duly cited in the
text and are included in the list of references.
The University of Algarve reserves the right, in accordance with
the provisions of the Copyright and Related Rights Code, to file,
reproduce and publish the work, regardless of the medium used,
as well as to disseminate it through scientific repositories and to
allow their copying and distribution for purely educational or
research purposes and not for commercial purposes, provided that
due credit is given to the respective author and publisher.
1
Aknowledgment
To declare sincere gratitud in several words is not enough taking into considerarion all the blessings I received through very special people that were part of this extrordinary experience.
I would like to express my special appreciation and deep thanks to my thesis supervisor Dr. Professor Maria Clara Costa, leader of the research group Ecology and restoration of riverine, estuarine and coastal habitats from the Centre of Marine Sciences (CCMAR) in the University of Algarve, for the continuous support of my research master thesis and the enthusiasm received countless of time. With her immense knowledge it was possible for me to succed during the RMT.
Besides my advisor, I would like to thank to Dr. Jorge Carlier from the laboratory of Environmental Technologies, in the University of Algarve for his warm encouragement and constant support during the experimental part.
My profound and sincere thanks also goes to the EMQAL PMT members for the blessed opportunity to be part, to learn and to grow as a human being with the Erasmus Mundus Master in Quality in Analytical Laboratories.
Also, deep thanks I would like to express to Gabrizia and Tânia, who offered me warm help during the stay in their respective countries, Poland and Portugal.
Sincere and special thanks also goes to Izabela Michalak from the Department of Chemistry, Institute of Inorganic Technology and Mineral Fertilizers, Wrocław University of Technology, in Poland, for the very important support during the calculations process.
I am particularly grateful for the warm environment build among the EMQAL colleagues, John, Valery, Astrid, Nicole, Monica, Inal, Susana, Pasha, Mohammed, Mulugueta, Tamira. I learn a lot with you and I will always be thankful for all the spectacular memories that we build during the stay in Poland.
Deep, hearty, and abundant thanks go to my lovely family, to my husband and to my friend Lineth. You were my blessing and my support in the most challenging moments. I am blessed and I deeply thank God, my fortress in whom I trust.
Abstract
This work aimed to investigate the removal of boron by bioadsorption using carob kibbles (Ceratonia siliqua L.) biomass, a by-product of a seed flour factory located in Faro, Portugal. Batch experiments were carried out to evaluate the effect of several parameters such as contact time, pH of the solution, initial boron concentration, adsorbant dosage, temperature of the solution and particle size on boron removal. The optimum contact time obtained was 300 min and the bioremoval is favored as the solution pH increases. This removal was found to increase with an increase in the adsorbent dosage. With an initial boron concentration of 100 mg/L, the maximum percentage of removal (67 %) was achieved with the highest adsorbent dosage tested (200 g/L). On the other hand, when using a fixed dosage of biosorbent (50 g/L) the percentage of boron removal decreases as the initial boron concentration was raised from 20 to 200 mg/L. The best removal temperature was 25 ºC and the particle size that binded more boron from the aqueous solution was 0.025 mm.
Particle size distribution showed that the majority of biomass is within the sizes between 0.025 and 0.106 mm.
3
List of Figures
Figure 1. Boron in the periodic table ... 10 Figure 2. Fraction diagram for aqueous boron species at 0.04 mol/L ... 11 Figure 3. Fraction diagram for aqueous boron species at 0.4 mol/L ... 12 Figure 4. Model for the global biogeochemical cycle of boron (units represent fluxes in Teragrams of boron per year) ... 12 Figure 5. Mature leaves of sunflower plants, showing toxicity of boron at concentration of 15 mg/L ... 15 Figure 6. Chelating resins with N-methyl-D-glucamine (NMDG) groups, used to
remove boron from aqueous solutions ... 17 Figure 7. Scheme of the ion exchange of borate with Amberlite IRA 743 resin and regeneration ... 17 Figure 8. The polymer-enhanced hybrid ultrafiltration (PEUF) process for boron
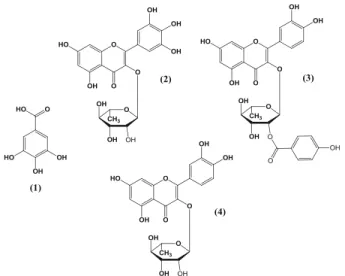
reclamation ... 17 Figure 9. Basic set up for the sorbate uptake when using biomass ... 18 Figure 10. Classification system of metal biosorption mechanisms ... 20 Figure 11. Parameters to assess for experimenting with sorbate uptake by biomass .... 21 Figure 12. Carob (Ceratonia siliqua L) ... 24 Figure 13. World carob distribution and centers of origin ... 25 Figure 14. Chemical structures of the polyphenols tentatively identified in carob
kibbles, using liquid chromatography–diode array–mass spectroscopy. Assignments: (1), gallic acid; (2), myricetin 3-O-rhamnoside; (3), quercetin p-hydroxy benzoyl 3-O- rhamnoside; (4) quercetin 3-O- rhamnoside ... 25 Figure 15. Map with the location of Industrial Farense Lda,a in Faro, Portugal ... 28 Figure 16. Biomass (pulverised carob kibbles) ... 28 Figure 17. Fourier transform infrared spectrum (FT-IR) of carob kibbles before
biosorption prepared with KBr pellet ... 37 Figure 18. EDX spectrum of natural carob kibbles (top) and carob kibbles enriched with boron (bottom), mineral trace analysis. ... 39 Figure 19. Point of zero charge of carob kibbles before biosorption (0.1g) ... 40 Figure 20. Particle size distribution for carob kibbles expresed as retained percentage (%) biomass (n=3). Bars represent the standard deviation ... 41 Figure 21. The pseudo-second-order kinetic model plots at different pH (Co=100 mg/L, Cs=50 g/L, 25 ºC) ... 42 Figure 22. Effect of contact time over boron biosorption by carob kibbles, n=1
(pH=5.5, Co=100 mg/L, Cs=50 g/L, 25 ºC) ... 42 Figure 23. Effect of contact time over boron biosorption by carob kibbles, n=2
(pH=5.5, Co=100 mg B/L, Cs=50 g/L, 25 ºC). For the last point n=1. Bars indicate the standard deviation ... 43
Figure 24. Effect of contact time over boron biosorption by carob kibbles, n=2
(pH=3.0, Co=100 mg B/L, Cs=50 g/L, 25 ºC). For the last point n=1. Bars indicate the standard deviation ... 44 Figure 25. Effect of contact time over boron biosorption by carob kibbles, n=2
(pH=7.5, Co=100 mg B/L, Cs=50 g/L, 25 ºC). For the last point n=1. Bars indicate the standard deviation ... 44 Figure 26. Effect of contact time over boron biosorption by carob kibbles, n=2
(pH=9.5, Co=100 mg B/L, Cs 50 g/L, 25 ºC). For the last point n=1. Bars indicate the standard deviation ... 45 Figure 27. . Effect of contact time over boron biosorption by carob kibbles, n=2
(pH=11,5, Co=100 mg B/L, Cs=50 g/L, 25 ºC). For the last point n=1. Bars indicate the standard deviation ... 45 Figure 28. Effect of contact time over boron biosorption by carob kibbles, n=2
(pH=3.0, 5.5, 7.5, 9.5, 11.5, Co=100 mg B/L, Cs=50 g/L, 25 ºC) ... 46 Figure 29. . Effect of contact time on boron removal onto activated carbon (initial pH of solution: 5.5) [47] ... 47 Figure 30. Effect of pH on boron biosorption on carob kibbles n=2 (equilibrium contact time: 300 min for pH=3.0; 1440 min for pH=5.5; 1800 min for pH=7.5; 600 min for pH=9.5; 300 min for pH=11.5; Co=100 mg B/L, Cs=50 g/L, 25 ºC). For pH 7.5 n=1. Bars indicate the standard deviation ... 47 Figure 31. Effect of pH on boron removal onto activated carbon prepared from olive bagasse ... 48 Figure 32. Effect of initial boron concentration on boron removal onto carob kibbles, n=2 (Cs=50 g/L, pH=11.5, 300 min, 25 ºC). Bars indicate the standard deviation ... 50 Figure 33. Effect of biosorbent dose on boron removal onto carob kibbles, n=2
(Co=100 mg/L, pH=11.5, 300 min, 25 ºC). Bars indicate the standard deviation ... 51 Figure 34. Effect of temperature on boron removal onto carob kibbles, n=2 (Co=100 mg/L, Cs=50 g/L, pH=11.5, 300 min). Bars indicate the standard deviation ... 52 Figure 35. Effect of particle size on boron removal onto carob kibbles, n=3 (Co=100 mg/L, Cs=50 g/L, pH=11.5, 300 min, 25 ºC). Bars indicate the standard deviation ... 53 Figure 36. Fourier transform infrared spectrum (FTIR) of carob kibbles before and after boron biosorption ... 55 Figure 37. Linearization of Langmuir equation at different boron concentration, 20, 40, 50, 100, 200 mg/L, n=3 (Cs=50 g/L, pH=11.5, 300 min, 25 ºC) ... 56 Figure 38. Langmuir isotherm at different boron concentration 20, 40, 50, 100, 200 mg/L, n=3 (Cs=50 g/L, pH=11.5, 300 min, 25 ºC) ... 56 Figure 39. Linearization of Freundlcih equation at different boron concentration, 20, 40, 50, 100, 200 mg/L, n=3 (Cs=50 g/L, pH=11.5, 300 min, 25 ºC) ... 57
5
List of Tables
Table 1. Average values for boron on environmental matrices and some natural sources [9], [10] ... 13 Table 2. Industries utilising boron [11] ... 14 Table 3. Relative tolerance of crops and ornamentals to boron [19] ... 15 Table 4. Standards for water quality regarding B concentration [13], [22], [23], [24] . 16 Table 5. Advantages and disadvantages of technologies for water deboronation ... 18 Table 6. Optimal pH values found for the biosorption of some ions including metals and metalloid ... 22 Table 7. Spike of real samples for boron removal ... 32 Table 8. Microwave Plasma Atomic Emission Spectroscopy (MP-AES) operating conditions ... 33 Table 9. Kinetic models based on the order of the reactions [34] ... 35 Table 10. Functional groups in dried carob kibbles (Ceratonia siliqua L) by using FT-IR spectra ... 38 Table 11. Initial and final pH of the solution and ΔpH (pHinitial – pHfinal) to
determine the point of cero charge (pHpzc ) of Carob kibbles (0.1g) ... 40 Table 12. Percentage of biomass that was retained by each sieve of carob kibbles ... 40 Table 13. The parameters of pseudo-second-order model at different pH (3.0, 5.5, 7.5, 9.5, 11.5) ... 41 Table 14. Optimal pH values found for the biosorption of boron on biomass ... 49 Table 15. Comparison of optimal experimental conditions obtained for boron
biosoprtion ... 54 Table 16. Characterization of real wastewater solutions ... 58 Table 17. Results of boron removal on real samples from a ceramic wastewater n=3 (Cs=50 g/L, pH 11.5, 300 min, 25 ºC) ... 58 Table 18. Results of the percentage of boron removal using two different lots of
samples of carob kibbles (pH=11.5, Co=100 mg B/L, Cs=50 g/L, 25 ºC) ... 59 Table 19. The results of the F-Test ... 59 Table 20. The results of the t-Test: Paired Two Sample for Means, two tailed
List of Abreviations and Symbols
%R Percentage of recovery %Rem Percentage of removal
a y-intercept
B Boron
b Slope
CCRM Concentration of the Certified Reference Material CaCl2 Calcium chloride
CCMAR Center for marine sciences
CCME Canadian Council of Ministers of the Environment, Ceq/Ce Analite concentration in the equilibrium
Co Sorbate initial concentration CRM Certified Reference material Cs Sorbent initial concentration EDS Energy-dispersive X-ray spectrum
EU European union
Fcal Calculated F value for Hartley’s Fmax test Fcrit Critical F value for Hartley’s Fmax test FeCl3 Iron trichloride
FT-IR Fourier transform infrared spectroscopy H3BO3 Boric acid
HCl Hydrochloric acid
He Helium
HNO3 Nitric acid
k Afinity constant
K Langmuir adsoprtion constant
Ka Acid dissociation constant of a solution KBr Potasium bromide
LOD Limit of detection
M Amount of the added (bio)sorbent on the dry basis MP-AES Microwave plasma atomic emission spectroscopy NaCl Sodium chloride
NaOH Sodium hydroxide NMDG N-methyl-D-glucamine p1 Orbital p with one electron
PEUF Polymer-enhanced hybrid ultrafiltration process
pHf Final pH
7 pKa The negative base-10 logarithm of the acid dissociation constant (Ka) of
a solution
PZC/pHpzc Point of zero charge
qeq/qe Adsorption equilibrium capacity qeq Bioadsorption capacity
qmax Maximum adsorption capacity r Regression coefficient
rpm Revolutions per minute
s Standard deviation
s2 Orbital s with two electrons
SD Standard deviation
SDx/y Residual standard deviation SEM Scanning electron microscopy t Calculated value for student´s t test tcrit Critical value for student´s t test UAlg Universidade do Algarve
V Volume of the sorbate-bearing solution contacted WHO World Health Organization
Xm The arithmetic average from the analyte measurements ΔpH pHinitial – pHfinal
Table of Contents
Aknowledgment ... 1
List of Figures ... 3
List of Tables ... 5
List of Abreviations and Symbols ... 6
Table of Contents ... 8
1. Introduction and Literature Review ... 10
1.1 Chemistry of boron in aqueous environments ... 10
1.2 Boron in the environment ... 12
1.3 Biological activity and toxicity of boron ... 14
1.4 Conventional decontamination methods for boron: advantages and disadvantages ... 16
1.5 Biosorption: opportunities and challenges ... 18
1.5.1 Biosorbents ... 19
1.5.2 Process parameters that affect the biosorption ... 20
1.5.2.1 pH ... 21 1.5.2.2 Sorbate concentration ... 22 1.5.2.3 Temperature ... 22 1.5.2.4 Contact time ... 23 1.5.2.5 Mass of biosorbent ... 23 1.5.2.6 Particle size ... 23 1.5.2.7 Modificators ... 23
1.6 Biosorption opportunities for boron removal ... 24
1.7 Carob (Ceratonia Siliqua L.): characteristics and potential as biosorbent ... 24
2. Objective ... 27
3. Materials and methods ... 28
3.1 Biosorbent ... 28
3.2 Chemicals ... 29
3.3 Biomass characterization ... 29
3.3.1 Fourier transform infrared (FTIR) spectroscopy ... 29
3.3.2 Scanning electron microscopy (SEM) ... 29
3.3.3 Point of zero charge (PZC) ... 30
3.3.4 Particle size distribution ... 30
3.4 Adsorption studies ... 30
9
3.6 Batch experiments for boron removal to compare two lots of carob kibbles ... 33
3.7 Instrumental analysis ... 33
3.8 Calculations ... 34
3.9 Kinetic studies ... 34
3.10 Adsorption isotherm of linear Langmuir ... 35
3.11 Adsorption isotherm of Freundlich ... 36
4. Results and discussion ... 37
4.1 Characterization of carob kibbles ... 37
4.1.1 FT-IR analysis of the biosorbent ... 37
4.1.2 Scanning Electro Microscopy coupled to Energy-Duspersive X-Ray System ... 38
4.1.3 Point of zero charge (PZC) ... 39
4.1.4 Particle size distribution ... 40
4.1.5 Limit of detection ... 41
4.2 Batch biosorption experiments ... 41
4.2.1 Kinetic experiments ... 41
4.2.2 Effect of contact time ... 42
4.2.3 Effect of pH ... 47
4.2.4 Effect of initial boron concentration ... 50
4.2.5 Influence of biosorbent dose ... 51
4.2.6 Effect of temperature ... 52
4.2.7 Effect of particle size ... 53
4.3 FT-IR analysis of the biosorbent loaded with boron ... 54
4.4 Biosorption Isotherms ... 56
4.4.1 Langmuir Isotherm ... 56
4.4.2 Freundlich Isotherm ... 57
4.5 Batch experiments for the sorption of boron using real samples ... 58
4.6 Batch experiments using two different lots of carob kibbles ... 58
5. Conclusions ... 60
6. Future persepectives ... 61
7. Bibliography ... 62
8. Annexes ... 70
Annex 1. t distribution critical values ... 70
Annex 2. One way ANOVA for checking the effect of temperature over boron removal by carob kibbles ... 71
10
1. Introduction and Literature Review
1.1 Chemistry of boron in aqueous environments
Boron is the element number five in the periodic table with symbol B, atomic mass of 10.81 and electron configuration [He] 2s22p1. It has some of the properties of metals and some of the properties of non-metals, then it is classified as metalloid [1] (Figure 1).
Figure 1. Boron in the periodic table
Boron is not found as free element in nature, for example, in aqueous environments at low concentrations i.e <0.02 mol/L, it is present as boric acid or as borate ions at acidic and alkaline conditions respectively, according to the dissociation reaction as shown in the following equations 1 and 2 [1], [2]:
H3BO3 (aq) +H2O ⇌ B(OH) 4− (aq) +H(aq)+ (Ka = 7.3x10⁻¹⁰; pKa 9.1) (1)
(2)
Regarding the origin of the acidity of aqueous boric acid solutions there are some data that lead to several interpretations. Firstly, Raman spectroscopy of strongly alkaline solutions has shown the presence of B(OH)4- ions, [3] leading some to conclude that the acidity is exclusively due to the abstraction of OH− from water [3], [4], [5], [6].
The solubility of boric acid in water increases rapidly with temperature at atmospheric pressure (Table 1).
Boric acid dissolved in water is uncharged and has a trigonal structure. Figure 5 shows an actual size comparison between boron acid molecule, sodium and chloride ions in water.
Fig. 5. Size comparison between boron acid and some other species in aqueous solutions.
3.2. Dissociation of boric acid in water
Boric acid is very weak and does not dissociate in aqueous solution as a Bronsted acid but acts as a Lewis acid by accepting a hydroxyl ion to form the tetrahydroxyborate ion, as confirmed by Raman spectroscopy [20]:
Thus the dominant forms of inorganic boron in natural aqueous systems are mononuclear species such as boric acid B(OH)3 and borate ion B(OH)4 –. The distribution of these two components depends on the first dissociation constant Ka of boric acid. It was
shown that the first dissociation constant is equal to 5.8×10⁻¹⁰ mol/L in fresh water at temperature 25 °C, while values of 1.8×10⁻¹³ and 3×10-14 have been reported for the second and third dissociation constant of boric acid respectively. As seen in Table 1, Ka increases
with an increase of water temperature [19].
In solutions more concentrated than 0.1 M, boric acid acts as a much stronger acid than in diluted solutions, becoming comparable to acetic acid; the apparent ratio of the concentration of borate ions to that of boric acid molecules in the solution progressively increases from 1:1000 at 0.2 M to 1:5 at 3.5 M [2].
The pK values (= - log(Ka)) of boric acid have been determined to be pKa=8.60 in
11 Therefore, boric acid may be characterized as Lewis acidity of boron toward OH−, rather than as Brønsted acidity [4], [5], [6].
On the other hand, other source [7] says that boric acid is also a tribasic Brønsted acid, with successive ionization steps (equations 3, 4 and 5):
B(OH)3 ⇌ BO(OH)2- + H+ (Ka1 = 5.8x10⁻¹⁰; pKa1 = 9.2) (3) BO(OH)2- ⇌ BO2(OH)2− + H+ (Ka2 = 4x10⁻¹³; pKa2 = 12.4) (4) BO2(OH)2−⇌ BO33− + H+ (Ka3 = 4x10⁻¹⁴; pKa3 = 13.3) (5) Since the value of Ka1 in equation 3 is comparable to that of the reaction with OH− in equation 1, the concentrations of BO(OH)2- and B(OH)4− are similar [7].
Polyborate anions are formed at pH 7–10 if the boron concentration is higher than about 0.025 mol/L [2] (or at 0.4 mol/L according to another reference [8]). The best known of these is the 'tetraborate' ion (equation 6), found in the mineral borax:
4[B(OH)4]− + 2H+⇌ [B4O5(OH)4]2− + 7H2O (6) The fraction diagram (Figure 2) shows the pH dependence of boron species in aqueous solutions [2] (≤0.04 mol/L [8]). It can be noticed that at pH under the pKa value, boric acid predominates and at pH over the pKa borate ions are mainly present in the solution.
Figure 2. Fraction diagram for aqueous boron species at 0.04 mol/L
According to the fraction diagram (Figure 3) as the pH of the solution changes at significant concentrations (for example, ≥0.4 mol/L), other highly water soluble polyborate ions are found, such as B(OH)4−, B3O3 rings including B3O3(OH)4−, B4O5(OH)42−, and B5O6(OH)4− [2], [8].
850 | New J. Chem., 2015, 39, 849--859 This journal is © The Royal Society of Chemistry and the Centre National de la Recherche Scientifique 2015
at the Salado rock-salt formation where the WIPP is located, which lead to relatively high boron concentrations (up to 0.045 M).3
Although the aqueous chemistry of An(III) and An(IV) under
repository-relevant conditions is mostly dominated by hydro-lysis reactions, the role of other inorganic and organic ligands in complexing (and thus potentially mobilizing) actinides needs to be assessed properly. In contrast to carbonate, phos-phate or sulphos-phate, little attention has been dedicated so far to the possible complexation of borate species with actinides.3,4
The lack of experimental studies assessing An–borate complexa-tion is well-reflected in the publicacomplexa-tions of the OECD Nuclear Energy Agency thermodynamic database project (NEA-TDB), where no aqueous borate species or solid compounds are selected for any of the actinides evaluated (U, Np, Pu, Am, Th).5,6Borkowski and
co-workers assessed the effect of borate on Nd(III) solubility in
dilute to concentrated NaCl solutions at pHc= 8.6 and 0r [B]totr
0.16 M.3The authors observed a slight increase in Nd
concen-tration (in the range of 5.0 ! 10"8–2.5 ! 10"7M) as a function of
[B]tot, ionic strength and pH which was related to the formation of
a NdHB4O72+-complex. Borkowski and co-workers derived
chemical and thermodynamic models assuming a boron specia-tion dominated by the species HB4O7" under the particular
conditions of their experiments. Recently, Schott et al. investigated the interaction of Eu(III) with borate in aqueous solution.7TRLFS
experiments confirmed a weak Eu(III)–borate complexation at
pH o 6. At pH B 6 and in the presence of high boron concentrations (0.3 Mr [B]totr 0.7 M), the authors observed
the formation of a Eu(III)–borate solid phase. The solid was
characterized by XRD, IR and solid-state TRLFS, although these techniques provided inconclusive information on the stoichio-metry of the newly formed compound. Kienzler et al. performed leaching experiments with simulated borosilicate glass doped with U(IV), U(VI), Pu(IV), Am(III), Np(IV) and Np(V) in concentrated
NaCl solutions. Experiments were performed within 7.5r pHcr 8.5 at T = 110 1C and 190 1C.8The authors observed
no enhanced release of radionuclides in spite of the high borate concentration in solution (B10"2 mol kg"1). Chernorukov,
Nipruk and co-workers9–19 conducted a very comprehensive
series of thermochemical and solubility experiments with MI,II–U(VI)–B solid phases, with MI = Li, Na, K, Rb, Cs and
MII= Mg, Ca, Sr, Ba, Mn, Co, Ni, Zn. The uranoborates were
prepared by a combination of hydrothermal and ion-exchange approaches. The authors reported both log Ks and enthalpy
data for the synthesized phases.
No actinide-borate minerals are known to naturally occur in the environment. One of the first reported synthetic crystalline actinide borate compound K6[UO2(B16O24(OH)8)]#12H2O was
obtained by evaporation of water at room temperature.20
Gas-perin and co-workers synthesized U(VI) and Th(IV) borate
com-pounds such as ThB2O5, MgB2UO7and NaBUO5using molten
B2O3at temperatures above 1000 1C.21–23A variety of borate
compounds with lanthanides24,25 and, recently, Am(III) and
Pu(IV) were prepared by using boric acid flux at moderate
temperatures (B200 1C).26–28In spite of the increasing number
of studies reporting the formation of An– and Ln–borate crystal-line compounds, only a very few experimental studies are
available so far assessing the formation, potential stability and relevance of these compounds in aqueous systems at lower temperatures (e.g. 25 1C).
Note also that so far no systematic study on An(III)–borate
interactions affecting solubility and speciation under a large variation of geochemical boundary conditions (pH, [B], [NaCl], [MgCl2], [CaCl2]) has been performed.
One of the challenges encountered when quantitatively asses-sing An–borate interaction is the complex and yet largely unknown aqueous speciation of boron. A number of experimental approaches including potentiometric titrations,29,30 Raman
spectroscopy,31 11B-NMR,32–35 isopiestic measurements36,37
and solubility studies38–40have been considered in the
litera-ture to assess the speciation of boron in solution. The available thermodynamic data29,30,41 allow the calculation of species
distribution for some cases, although the accuracy of these calculations at elevated boron and salt concentration (espe-cially in the case of MgCl2) is importantly hindered. Monomeric
species B(OH)3(aq) and B(OH)4"prevail at low boron
concen-tration under acidic and alkaline pH conditions, respectively (Fig. 1a). Due to the neutral character of B(OH)3(aq) and the
Fig. 1 Fraction diagram of aqueous boron species calculated for 4r pHr 12 at I = 0 for (a) [B]tot= 0.04 M, and (b) [B]tot= 0.4 M.
Thermo-dynamic data used in the calculations as reported in Ingri et al. (1957) and Ingri (1962).29,30
Paper NJC
Published on 02 October 2014. Downloaded by Universidade do Algarve (UALG) on 29/03/2017 16:08:38.
12 Figure 3. Fraction diagram for aqueous boron species at 0.4 mol/L
1.2 Boron in the environment
Boron is an element widely distributed in the lithosphere, atmosphere and hydrosphere. Nevertheless, has a low abundance on earth. As previously mentioned, it is not found in nature as free element and its natural occurrence is the result of a global biogeochemical cycle as it occurs with other bioelements on earth, though some punctual natural sources can be described for boron presence in lithosphere and hydrosphere (Figure 4) [9].
Figure 4. Model for the global biogeochemical cycle of boron (units represent fluxes in Teragrams of
boron per year)
Boron concentration in sea water can range from 1-10 mg/L, its concentration in fresh water is usually from less than 0.01 mg/L to 1.5 mg/L and increases significantly in 850 | New J. Chem., 2015, 39, 849--859 This journal is © The Royal Society of Chemistry and the Centre National de la Recherche Scientifique 2015
at the Salado rock-salt formation where the WIPP is located, which lead to relatively high boron concentrations (up to 0.045 M).3
Although the aqueous chemistry of An(III) and An(IV) under
repository-relevant conditions is mostly dominated by hydro-lysis reactions, the role of other inorganic and organic ligands in complexing (and thus potentially mobilizing) actinides needs to be assessed properly. In contrast to carbonate, phos-phate or sulphos-phate, little attention has been dedicated so far to the possible complexation of borate species with actinides.3,4
The lack of experimental studies assessing An–borate complexa-tion is well-reflected in the publicacomplexa-tions of the OECD Nuclear Energy Agency thermodynamic database project (NEA-TDB), where no aqueous borate species or solid compounds are selected for any of the actinides evaluated (U, Np, Pu, Am, Th).5,6Borkowski and
co-workers assessed the effect of borate on Nd(III) solubility in
dilute to concentrated NaCl solutions at pHc= 8.6 and 0r [B]totr
0.16 M.3The authors observed a slight increase in Nd
concen-tration (in the range of 5.0 ! 10"8–2.5 ! 10"7M) as a function of
[B]tot, ionic strength and pH which was related to the formation of
a NdHB4O72+-complex. Borkowski and co-workers derived
chemical and thermodynamic models assuming a boron specia-tion dominated by the species HB4O7" under the particular
conditions of their experiments. Recently, Schott et al. investigated the interaction of Eu(III) with borate in aqueous solution.7TRLFS
experiments confirmed a weak Eu(III)–borate complexation at
pH o 6. At pH B 6 and in the presence of high boron concentrations (0.3 Mr [B]totr 0.7 M), the authors observed
the formation of a Eu(III)–borate solid phase. The solid was
characterized by XRD, IR and solid-state TRLFS, although these techniques provided inconclusive information on the stoichio-metry of the newly formed compound. Kienzler et al. performed leaching experiments with simulated borosilicate glass doped with U(IV), U(VI), Pu(IV), Am(III), Np(IV) and Np(V) in concentrated
NaCl solutions. Experiments were performed within 7.5 r pHcr 8.5 at T = 110 1C and 190 1C.8The authors observed
no enhanced release of radionuclides in spite of the high borate concentration in solution (B10"2 mol kg"1). Chernorukov,
Nipruk and co-workers9–19 conducted a very comprehensive
series of thermochemical and solubility experiments with MI,II–U(VI)–B solid phases, with MI = Li, Na, K, Rb, Cs and
MII= Mg, Ca, Sr, Ba, Mn, Co, Ni, Zn. The uranoborates were
prepared by a combination of hydrothermal and ion-exchange approaches. The authors reported both log Ks and enthalpy
data for the synthesized phases.
No actinide-borate minerals are known to naturally occur in the environment. One of the first reported synthetic crystalline actinide borate compound K6[UO2(B16O24(OH)8)]#12H2O was
obtained by evaporation of water at room temperature.20
Gas-perin and co-workers synthesized U(VI) and Th(IV) borate
com-pounds such as ThB2O5, MgB2UO7and NaBUO5using molten
B2O3at temperatures above 1000 1C.21–23A variety of borate
compounds with lanthanides24,25 and, recently, Am(III) and
Pu(IV) were prepared by using boric acid flux at moderate
temperatures (B200 1C).26–28In spite of the increasing number
of studies reporting the formation of An– and Ln–borate crystal-line compounds, only a very few experimental studies are
available so far assessing the formation, potential stability and relevance of these compounds in aqueous systems at lower temperatures (e.g. 25 1C).
Note also that so far no systematic study on An(III)–borate
interactions affecting solubility and speciation under a large variation of geochemical boundary conditions (pH, [B], [NaCl], [MgCl2], [CaCl2]) has been performed.
One of the challenges encountered when quantitatively asses-sing An–borate interaction is the complex and yet largely unknown aqueous speciation of boron. A number of experimental approaches including potentiometric titrations,29,30 Raman
spectroscopy,31 11B-NMR,32–35 isopiestic measurements36,37
and solubility studies38–40have been considered in the
litera-ture to assess the speciation of boron in solution. The available thermodynamic data29,30,41 allow the calculation of species
distribution for some cases, although the accuracy of these calculations at elevated boron and salt concentration (espe-cially in the case of MgCl2) is importantly hindered. Monomeric
species B(OH)3(aq) and B(OH)4"prevail at low boron
concen-tration under acidic and alkaline pH conditions, respectively (Fig. 1a). Due to the neutral character of B(OH)3(aq) and the
Fig. 1 Fraction diagram of aqueous boron species calculated for 4r pHr 12 at I = 0 for (a) [B]tot= 0.04 M, and (b) [B]tot= 0.4 M.
Thermo-dynamic data used in the calculations as reported in Ingri et al. (1957) and Ingri (1962).29,30
Paper NJC
Published on 02 October 2014. Downloaded by Universidade do Algarve (UALG) on 29/03/2017 16:08:38.
View Article Online
[U.S. Geological Survey (USGS ), 2000]. Large amounts of B are used in the manufacture of borosilicate glass, deter-gents, and fire extinguishing materials, and in the disposal of nuclear waste.
[4] Here we provide a compilation and synthesis of data
from the literature, leading to a pictorial model for the global biogeochemical cycle of B (Figure 1). In this compilation, we describe the uncertainty associated with estimates of the major fluxes of boron, while assuming that errors in the minor fluxes do not alter the global picture. Where we have incorporated the data of previous authors, we have retained the number of significant digits published in their work. This quantitative synthesis of the global B cycle offers context to assess the current human impact and to identify areas of uncertainty in our current understanding.
2. Literature Review and Results
2.1. Atmospheric Flux 2.1.1. Inputs 2.1.1.1. Seasalt Aerosols
et al., 1994], is nearly always higher than the Henry’s Law prediction of the concentration in equilibrium with dis-solved B(OH)3 in seawater (4.6 mg B/kg; Holland
[1978]). The higher concentration of B in the atmosphere is thought to be derived from the evaporation of boric acid vapor from seasalt aerosols as they dry. As a result, B/Na in seasalt aerosols is normally about 5.6 times less than B/Na in seawater [Rose et al., 2000a]. Despite this partitioning into gaseous and particulate phases, the total input of B to the atmosphere can be calculated from estimates of the formation of seasalt aerosols, assuming that there is no fractionation of ions during the injection of bubbles to the atmosphere, as suggested by Fogg and Duce [1985; cf. Glass and Matteson, 1973].
[6] The annual production of seasalt aerosols is estimated
at 10! 1015g/yr [Mo¨ller, 1990] to 11.7
! 1015g/yr [Gong
et al., 1997]. Both estimates are compatible with an earlier estimate of 8 – 22! 1015g/yr for the annual dry deposition
of seasalt over the world oceans [Erickson and Duce, 1988]. With an average seawater salinity of 35%, the annual input of B to the atmosphere could range from 1.0 to 2.3 Tg B/yr. A similar calculation, using the Cl budget for the atmos-Figure 1. Model for the global biogeochemical cycle of boron.
13 areas where soil is boron rich. In Europe, the fresh surface water concentration ranges from <0.001 to 2 mg/L with mean values typically below 0.6 mg/L. The boron concentrations in groundwater throughout the world range widely from <0.3 to >100 mg/L depending on the region of the lithosphere. Table 1 presents some average values for boron on environmental matrices as well as some natural sources [9], [10].
Table 1. Average values for boron on environmental matrices and some natural sources [9], [10]
Human activities are mobilizing significant quantities of boron on environmental matrices altering its global cycle. In addition, the above mentioned concentrations in surface waters can be significantly increased by anthropogenic sources since the industrial and domestic wastewaters discharged to this natural water bodies can be rich in boron residual products [9].
The list of industries utilising boron compounds is presented in Table 2 [11]. From the list, the two societal uses of boron that account for the most are borosilicate glass and ceramics that up thogether sum 64% [12]. There, boron is used to improve the surface hardness and strength of the final product and during the development of mechanical strength of tiles respectively. Consequently, this are the two principal anthropogenic sources of boron to the environment. A particular wastewater from ceramic industry can have up to 36 mg/L of boron before the treatment process and studies have shown that the ceramic wastewater contains usually between 14 and 15 mg/L of boron [14], [15].
Average (mg/Kg) The occurrence of concentrated deposits of borate
minerals is intimately connected with past or present volcanic activity and arid climatic conditions are essential for continued preservation of such deposits
Earth´s crust 10 Most soils have low boron content (<10 mg B/kg),
while high boron content soils (10–100 mg B/kg) are usually associated with volcanic activity
Soils 30
Average (mg/L) Hydrothermal exchanges, wetfall and dryfall from
atmosphere, gaseous absorption Oceans 4.5
Leaching from rocks and soils containing borates
and borosilicates Groundwater <0.3-100>
Proximity to marine coastal regions, and the geochemical nature of the drainage area, weathering
of clay-rich sedimentary rock soils, washing of geological materials or volcanic emissions
Surface water 0.6 Lithosphere Aqueous environment Resulting from Resulting from
Table 2. Industries utilising boron [11]
1.3 Biological activity and toxicity of boron
Since boron is in a constant flux in aquatic and terrestrial ecosystems, living organisms have adapted to some levels of environmental concentrations to guarantee important physiological functions and at trace levels boron has an esential role for the diverse forms of life [12].
Some evidence indicates that as micronutrient for plants, boron plays an important role for the cell wall structure and function, the production of chlorophyll, the carbohydrates metabolism and transport, the synthesis and metabolism of phenolic compounds and is regarded as an essential element for the growth of plants [16]. In animals, boron is required to complete the life cycle of some species, for instance, embryological development in fish and frogs does not proceed normally in the absence of extracellular boron [13]. It also has been found that for higher animals and humans physiological amounts of boron are nutritionally important for the metabolism of certain substances including macrominerals, triglycerides, glucose, nitrogen-containing substances such as amino acids and proteins and reactive oxygen species [13]. Researches have indicated that in humans boron reduces the levels of inflammatory biomarkers [17] and some epidemiological studies suggest that countries with population that consume food rich in boron present lower arthritis incidence [13].
The World Health Organization (WHO) has established an intake of 1-13 mg/day as safe and adequate for a healthy individual [18].
Industries Continue
Borosilicate glass Fertiliziers
Porcelain Metallurgic
Wire drawning Nuclear shielding
Enamels Cutting fluids and catalysts
Cosmetics Borohydride fuel cell
Leather Ultrapure water production
Textile Photographic chemicals
Paint wood-processing Carpet production Detergents and bleaching agent Weatherproofing wood
Insecticides Fireproofing fabrics
Preparation of disinfectants Welding and brazing of metals (Borax) Preparation of drugs Boron neutron capture therapy
15 Despite the biological activity, some ecotoxicological studies evidence that exposure to boron concentrations higher than the tolerable by plants and animals, can be toxic in the short and in the long term. The range between boron requirements (deficiency) and toxicity is quite narrow and the tolerances vary among different organisms, i.e. in the case of crop plants, carrot (Daucus carota L.) is described as tolerant to boron (4 mg/L in irrigation water) whereas orange (Citrus sinensis L.) is considered a sensitive plant to boron (1.0 mg/L) in irrigation water [19]. Relative tolerance of crops to boron is summarized in Table 3 [19].
Table 3. Relative tolerance of crops and ornamentals to boron [19]
In this aspect, when boron amount is higher than required its toxicity exerts different effects on the very diverse processes in plants, i.e. alters their metabolism, reduces root cell division, lowers leaf chlorophyll contents and photosynthetic rates and also decreases lignin in vascular plants. In a research conducted with soy beans and sunflower plants, when exposed to boron concentration in excess, 2.5 and 15.0 mg/L respectively, some symptoms of toxicity including lowering growth of the plants, smaller size and unusual color of leaves were observed (Figure 5) [19] [20].
Figure 5. Mature leaves of sunflower plants, showing toxicity of boron at concentration of 15 mg/L In addition to the adverse effects in plants, during toxicity studies in animals the testes have shown detrimental signs including convulsions, depression and death for acute
Sensitive (1 mg/L of boron in irrigation water)
Semitolerant (2 mg/L of boron in irrigation water)
Tolerant (4 mg/L of boron in irrigation water)
Walnut Sunflower Asparagus
Plum Potato Palm
Pear Cotton Clover
Apple Tomato Bean
Grape Olive Onion
Cherry Pea Cabbage
Peach Wheat Lettuce
Apricot Corn Carrit
Orange Grapefruit Lemon
exposure to boric acid or borax and studies have demonstrated that the male reproductive tract is a consistent target of toxicity for short-term and long-term oral exposures to boric acid or borax [13]. Other boron toxicological effects in humans as a consequence of the consumption of water and food with increase boron content resulted in creation of problems with cardiovascular, coronary, nervous and reproductive systems [21].
Due to the boron toxicity and potential increasing concentration in surface waters receiving industrial wastewater discharges, regulatory agencies from local and regional goverments have formulated standards for water quality that define the maximun residual levels of boron that should be present in surface, drinking [13], [22], [23], [24] (Table 4), and wastewater. This control has taken an important consideration in order to maintain healthy ecosystems and also for keeping apropriate water supply for human comsumption and irrigation activities. To fulfill those requirements, the industry and the potable water suppliers have focused on technologies and suitable methods to remove as much boron as possible from water and wastewater.
Table 4. Standards for water quality regarding B concentration [13], [22], [23], [24]
1.4 Conventional decontamination methods for boron: advantages and disadvantages
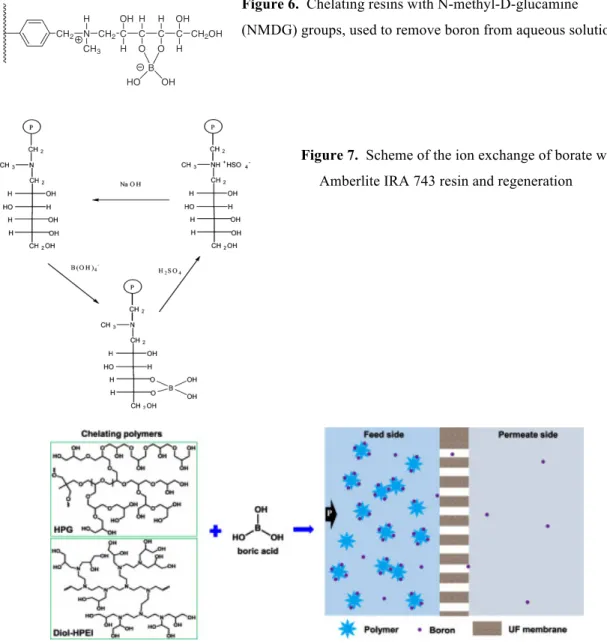
Boron removal technologies for water and wastewater is well documented and some of those technologies take advantage of the chemical properties of boron as a function of pH in order to bind it on an efficient way. According to literature [11] [25], numerous separation technologies have been applied and the methods rely on different operations and conditions including chelating resins [21] (Figure 6), ion exchange resins (Figure 7) [26], adsorption on activated carbon [27], reverse osmosis [26] and the newly developed
WHO EU Directive Drinking water (mg/L) Potable water (mg/L) Water quality for livestock Freshwater aquatic life Long term Fresh water aquatic life Short term 2.4 1.0 5.0 1.5 29
WHO: World Health Organisation Guideline
CCME:
CCME (mg/L)
17 hybrid methods [28] (Figure 8), among others. These methods are efficient (up to 99% of B removal). However, in most cases processes development and the maintenance of these operations are expensive or generate considerable volumes of wasted water, which are features not sustainable for the industry.
Figure 6. Chelating resins with N-methyl-D-glucamine
(NMDG) groups, used to remove boron from aqueous solutions
Figure 7. Scheme of the ion exchange of borate with
Amberlite IRA 743 resin and regeneration
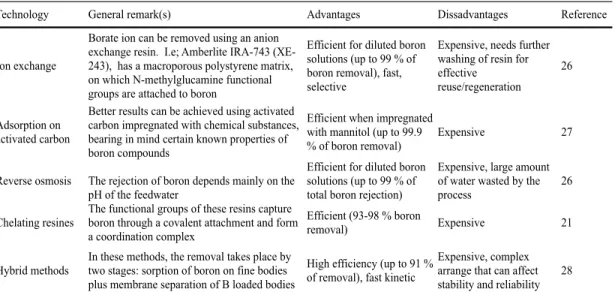
Figure 8. The polymer-enhanced hybrid ultrafiltration (PEUF) process for boron reclamation Table 5 shows a general view on advantages and disadvantages of technologies for water deboronation [21], [26], [27], [28].
dangerous for pregnant women as it increases the risk of birth patholo-gy. High daily doses of boron cause testicular atrophy and degeneration [23,24]. Doses greater than 500 mg/day may cause nausea, vomiting, and diarrhea, anorexia or weigh loss[23,24]. Boron is a mineral that is delivered naturally in the food supplied. It is found in fresh and dried fruit, as well as in vegetables, nuts and in wine[23]. Mammalians do not display any effect on boron deficiency and the organisms need only the amounts that come from food[24].
6. New standards
Relatively long time boron compounds were not treated in terms of toxic hazards. In 1993, the European Union initiated the first at-tempts to determine the risk caused by boron to the environment and to human health. In the same year the World Health Organization (WHO) identified this element on a list of drinking water standards and determined the permissible boron level at 0.3 mg/L. At that time, however, it was not known any technology that allowed to achieve such level of boron content. Due to this, WHO raised the value to 0.5 mg/L in 1998[5,7,15]. Lately, the Drinking-Water Quality Committee, at its meeting on 9–13 November 2009, recommended raising the Boron Guideline Value to 2.4 mg/L in accordance with the latest data from the UK and USA on dietary intakes[11,25]. The revised Guideline Value was incorporated into the Guidelines for Drinking-Water Quality, 4th Edition and was published in 2011[26]. The WHO guideline was formulated on the basis of human health consideration only. It was not related to irrigation water where old standards should still be applied.
The content of boron in drinking water, irrigation as well as in the wastewater is adjusted throughout the world. However, the recommended level of boron varies in different countries and regions. Hilal et al.[27]summarized the maximum B concentrations in drinking water for many regions in the world. In the European Union including UK, as well as in South Korea and Japan, the maximum amount of boron in potable water is kept at the 1.0 mg/L level. The USA has no federal regulations, and the permissible level depends on the state (e.g. State of Minnesota 0.6 mg/L, State of Florida 0.63 mg/L, State of California 1.0 mg/L). In New Zealand, the value is 1.4 mg/L. In Israel, the maximum boron concentration is 1.5 mg/L. Canada (5 mg/L) and Australia (4 mg/L) have set the maximum boron concentration over the WHO guideline. Only Saudi Arabia is the country complying with the guidelines[9,27].
7. Boron removal technologies
Taking into account the increasing concentration of boron in sur-face waters and the need for treatment of seawater, which contains large amounts of this element, the current research focuses on the development of effective technologies for the removal of boron. High incidence of boron in natural and wastewaters determines the importance of research in developing and introduction of the effec-tive process of B removal from the aqueous medium. Unfortunately, there is no simple and economic method for this task. The great diffi-culty in selecting of such method is the fact that boron appears in water in several numbers of chemical compounds and its concentra-tion varies from place to place[9]. The methods commonly used in water purification as sedimentation, coagulation or adsorption on clays are not effective in the case of boron compounds. It is not an effective water treatment by biological or chemical compounds as they remove only small amounts of boron or they do not remove it at all[9,15]. The processes of evaporation, crystallization or solvent extrac-tion, suited only for solutions with high concentrations, are more useful in the production of boric acid than in the process of removing its traces from water[6].
7.1. Adsorption methods
The technology commonly used for the removal of boron from aqueous solutions, the application of chelating resin, seems to be one of the most effective methods[28]. It was shown that chelating resins containing ligands having three or more hydroxyl groups, located in the cis position, the so-called “Vis-diols”, show a high selectivity to boron while these groups are not reactive to ordinary metals and other elements. Selective sorption of these resins is due to reactions that are characteristic for boron. Molecules of polyoxide compounds tend to bond through the formation of boric acid esters of boron or borate anion complexes with a proton as a counterion[4,9,19,29]. The obtained results suggest that the presence of tertiary amine group is critical for boron chelating. It captures proton freed during complexing of borate by hydroxyl functionalities[29–31]. According to this findings, the studies on construction of B-selective resins has been launched [29,32]. Most synthesized resins were formed by modification with the N-methyl-D-glucamine (NMDG) of copolymer of styrene and divinylbenzene (seeFig. 2). The functional groups of these resins cap-ture boron through a covalent attachment and form a coordination complex as is shown inFig. 3 [33].
On the market the following resins are available Amberlite IRS 743 (Rohm & Haas Corporation), BSR1 (Dow Chem), Purolite S-108 (Purolite International), Diaion CRB 03 and Diaion CRB 05 (Mitsubishi Corporation, Japan). These materials are able to remove boron selec-tively to the effectiveness of 93–98%, even with highly mineralized solutions[9]. Some of them were tested even in a pilot plant[34].
Study on the synthesis of boron selective resin with different than NMDG functionalities has gained the attention of researchers for last two decades. Bicak et al. synthesized polymer matrices modified with different compounds. They received a resin based on crosslinked polystyrene, modified with glycidyl groups and grafted with sorbitol [30]. Other materials, obtained by the same authors were NMDG bearing resins with matrices of crosslinked glycidyl methacrylate with N,N′-tetrallyl piperazinium dichloride or terpolymer of glycidyl methacrylate/methyl methacrylate/divinylbenzene (GMA/MMA/DVB) [29,35]. The surface of polymer matrix GMA/MMA/DVB was modified by ethylene diamine and glycidol[32]. In another study, they modified GMA/MMA/DVB substrate with 2-hydroxyethylamono propylene glycol for getting a B-selective sorbent[33]. The same authors synthe-sized terpolymer of glycidyl methacrylate/methyl methacrylate/ethylene glycol dimethacrylate (GMA/MMA/EGDMA) modified with diallylamine that removed boron from aqueous solutions[36].
Liu et al.[37]obtained a hybrid gel prepared with tetraethoxysilane (TEOS), (3-glycidoxypropyl)trimethoxysilane (GPTMS), and precursor synthesized from GPTMS and N-methyl-D-glucamine that had a good mechanical strength and affinity to boron. The silica support modified with NMDG was used also in the study[38]. Li et al.[31]described the process of synthesis boron adsorbent by grafting NMDG onto the silica-polyallylamine composites (SPC). This material had a high capac-ity towards boron even in seawater spiked with high concentration of other ions. A novel silica-supported N-methyl-D-glucamine adsor-bent (Si-MG) was synthesized by Xu et al.[39], by anchoring the N-methyl-D-glucamine modified (3-glycidoxypropyl) trimethoxysilane
CH2 N CH2C CH3 H C C C CH2OH OH H O H H O OH H B HO OH
Fig. 2. Chelating resins with NMDG groups, used to remove boron from aqueous solutions.
20 J. Wolska, M. Bryjak / Desalination 310 (2013) 18–24
boric acid can be removed from a solution with an initial concentration of 1000 mg/L as B when using 1,2-cyclohex-anedione dioxime (nioxime). However, the cost of this method is expensive by a preliminary study.20
Adsorption with Activated Carbon
Activated carbon (AC) has wide applications in water treatment and the remediation of contaminated groundwater. However, AC does not have high boron adsorption capacity, and the regeneration of saturated AC should be considered. Regeneration can be conducted by purging the AC at elevated temperature using hydrogen as the purge gas and at temperatures from about 175 °C or higher. Preferably a temperature within the range 175-200 °C is used, more preferably, 175-185 °C. The purge can be conducted using a flow opposite to the direction of flow used for adsorption.30Therefore, the use of
AC for boron removal is costly.
In order to improve the boron adsorption capacity from aqueous solution, modifications of AC by impregnating AC with various compounds have been studied. The use of barium or calcium as impregnants leads to a decrease of the amount of boron adsorbed. However, the impregnation with citric or tartaric acid onto the activated carbon increases the boron adsorption capacity significantly, as shown in Table 2.31
In addition, granulated AC WG-12 impregnated with mannitol was found to be the most promising for the boron removal from a chemical industrial effluent which contains 25-70 mg/L of boron.32The same authors also investigated the boron adsorption
on AC impregnated with different substances such as activated alumina, zirconium dioxide, and silica-aerosil and found that the application of the impregnants increases the boron adsorption capacity of AC. The first removal of boron using activated carbon impregnated with mannitol compared favorably with other impregnants.33
Liquid-Liquid Extraction
Boron can be removed from water by liquid-liquid extrac-tion. This process involves dissolving a water-insoluble poly-hydroxy compound in a suitable solvent which is immiscible with water and having specific complexity with boron. This technique was developed specifically for recovering boron from weak brines and plant-end liquors having boron concentrations on an order of 1.7%. It is effective in high concentration streams and is geared more to the production of boric acid rather than to its boron removal from water. No data were presented for low concentration effluents around 10 mg/L.34-36
Solvents which have been used to extract boron (borate) from aqueous solution can be conveniently classified into three groups:37(i) those that react with boric acid to form a neutral
ester, (ii) those that are capable of extracting boric acid as a result of physical solubility, and (iii) those that react with tetrahydroxy borate to form a complex borate salt.
N,N-Bis(2,3-dihydroxypropyl) octadecylamine (BPO) in 2-eth-yl hexanol has been demonstrated to be very efficient in
liquid-liquid extraction of boric acid from aqueous solutions. At boric acid concentrations of 1.2% (w/w), about 98% of BPO involves boron chelation, in nonbuffered conditions. The complexed boron can be recovered from the organic phase by treating with 2 M H2SO4solutions.38
Ion-Exchange Resin
Amberlite IRA-743 (XE-243). An ion-exchange resin,
Amberlite IRA-743 (XE-243), manufactured by Rohm and Haas, has a macroporous polystyrene matrix, on which N-methylglu-camine functional groups are attached (Figure 1).39It is a
boron-specific resin, and it offers very good selective ion exchange efficiency for boron. It is commonly known that boron is retained according to the following reaction scheme: borate ion is complexed with two sorbitol groups, and a proton is retained by a tertiary amine site that behaves as a weakly basic anion exchanger.
This method is popular for lowering boron concentrations from 100 mg/L to less than 1 mg/L. The maximum ion-exchange (6.7 mg B/g resin) occurs at pH 8 within a time period of 1 h.40
However, it is well-known that the boron saturated resin IRA 743 must be reconverted, or regenerated, to the free amine form by eluting with acid first and then alkalis before it is reused (Figure 1). Xiao et al.41proposed that the boron saturated
Amberlite IRA 743 resin can be eluted with HCl. The results indicate that, for a given concentration (e.g., 0.1 mol/L) and the same volume of HCl, the higher the HCl temperature (up to 75 °C), the better the recovery of boron from the resin. The fracturing of the resin beads and decrease in the ion exchange capacity of boron were not observed in the repeated use of Amberlite IRA 743 while warm 0.1 mol/L HCl was used as an elutent in the regeneration.41The selectivity of Amberlite IRA
743 resin for boron is very high, but the practical ion exchange capacity depends on flow rate: it drops rapidly as flow rate increases due to mass transfer limitations.39Hanay et al.42found
that at optimal conditions 99% of boron in the geothermal water could be removed.
Table 2. Effectiveness of Active Materials Used to Remove Boron from Boric Acid Water Solution in a Continuous Flow System31
adsorbent
amount adsorbed boron (mg/g)
activated carbon (AC) 1.59
AC + BaCl2 1.05
AC + CaCl2 0.93
AC + citric acid 2.90
AC + tartaric acid 3.56
Figure 1. Scheme of the ion exchange of borate with Amberlite IRA 743 resin and regeneration.39
Table 5. Advantages and disadvantages of technologies for water deboronation
Taking into account the need of developing effective and low-cost technologies aiming boron removal, the use of other alternatives such as vegetable wastes as sorbent materials can be investigated.
1.5 Biosorption: opportunities and challenges
Biosorption is defined as the adsorption process for species removal (generaly metals or metalloids) or recovery by using biosorbents or biomass, a non living material of biological origin that is used as an adsorbent [29]. This is a surface phenomena that involves a metal or metalloid ion (sorbate) dissolved in a solution (solvent, normally water) that is spontaneously retained by a solid (biosorbent). This process takes place until an equilibrium is established between the amount of solid-bound sorbate species and its portion remaining in solution (at a residual, final or equilibrium concentration) [29]. The degree of the biosorbent ‘affinity’ for the sorbate determines its distribution between the solid and liquid phases. Figure 9 presents a basic set up for the sorbate uptake when using biomass [adapted from 29].
Figure 9. Basic set up for the sorbate uptake when using biomass
Technology General remark(s) Advantages Dissadvantages Reference
Ion exchange
Borate ion can be removed using an anion exchange resin. I.e; Amberlite IRA-743 (XE-243), has a macroporous polystyrene matrix, on which N-methylglucamine functional groups are attached to boron
Efficient for diluted boron solutions (up to 99 % of boron removal), fast, selective
Expensive, needs further washing of resin for effective
reuse/regeneration 26
Adsorption on activated carbon
Better results can be achieved using activated carbon impregnated with chemical substances, bearing in mind certain known properties of boron compounds
Efficient when impregnated with mannitol (up to 99.9 % of boron removal)
Expensive 27
Reverse osmosis The rejection of boron depends mainly on the pH of the feedwater
Efficient for diluted boron solutions (up to 99 % of total boron rejection)
Expensive, large amount of water wasted by the process
26 Chelating resines The functional groups of these resins capture boron through a covalent attachment and form
a coordination complex
Efficient (93-98 % boron
removal) Expensive 21
Hybrid methods
In these methods, the removal takes place by two stages: sorption of boron on fine bodies plus membrane separation of B loaded bodies
High efficiency (up to 91 % of removal), fast kinetic
Expensive, complex arrange that can affect stability and reliability
19 There are two widely used calculations to evaluate the sorption performance of biosorption process, percentage of removal of the sorbate from the solution (expressed as % Rem) and adsorption equilibrium capacity of the sorbent (qeq, expresed in mg/g) [29]. The precentage of removal considers the extent of sorbate removed from the solution in the equilibrium at a given time with respect to initial metal/metalloid concentration, whereas the qeq is used to estimate the experimental capacity of the biomass to remove a specific sorbate in the equilibrium. Both calculations are represented in equations 7 and 8 [29].
(7) Where %Rem is percentage of removal, Co is the initial sorbate concentration (mg/L),
Ce is the concentration of sorbate in the equilibrium (mg/L). qeq=(Co-Ceq)*V/m (8) Where qeq is the adsorption equilibrium capacity, Co is the inittial sorbate concentration, Ceq corresponds to the final sorbate concentration (residual) or the sorbate concentration remaining in the solution, V is the volume of the sorbate-bearing solution contacted (batch) with the sorbent (L); and m is the amount of the added (bio)sorbent on the dry basis (g).
1.5.1 Biosorbents
The sources of nonliving biosorbents may include fungi [30], bacteria [31], algae [32], [33] plant biomass [34], [35], [36], [37] and vegetal waste [38], which are usually selected on the basis of availability and low cost and whose biosorption experiment results depict them as natural materials with good biosorption properties over sorbates including metals (Pb(II) [30], [33], Cd (II) [33], [38], Cr(III) [32], Ni(II) [35], Cu(II) [35], [38] and Zn(II) [35]) metalloids (As(III), As(V), [39]), fluoride [40] or dyes [41], etc. In all cases, the sorbates are regularly in ionic state (cationic/anionic), so they can be attached to the sorbent [34]. Sorbates under study are mostly metals or metalloids, since these species pose significant effects on the living organims including humans and still remain challenges for the effective treatment of this ionic pollutants in wastewater.
Int. J. Modern Chem. 2012, 3(1): 51-64
Copyright © 2012 by Modern Scientific Press Company, Florida, USA
54
2.5.1. Calculation
From the measured concentration of Cd(II) and Cr(VI) ions, amount of the metal adsorbed (qe)
and the percentage metal ion removal (% Rem) was calculated using equations 1 and 2, respectively [13]. V(Co – Ce) qe = (1) 100 M (Co – Ce) % Rem = 100 (2) Co
where qe is the amount of adsorbate ion adsorbed in milligram per gram of the adsorbent, Co is the
initial concentration of the metal ion before the adsorption process, Ce is the equilibrium concentration
of the metal ion in the filtrate after adsorption process, M is the mass in gram of the adsorbent and V is the volume of the solution in mL.
3. Results and Discussion
3.1. Effects of Different Parameters on Cd(II) and Cr(VI) Adsorption
3.1.1. Effect of initial metal ion concentration on Cd(II) and Cr(VI) adsorption
Fig. 1 shows the effect of initial metal ion concentration on Cd(II) and Cr(VI) adsorption
respectively. It can be deduced from the figure that the amount of metal ion adsorbed onto the activated locust bean husk (ALBH) increases with an increase in the initial metal ion concentration. In the given time duration of 2 h, both metals showed the highest metal uptake at initial metal concentration of 100 mg/L. Previous reports have shown that with increasing metal ion concentration, the specific sites are saturated and vacant sites are filled and at low concentrations, adsorption sites take up the available metal more rapidly while at higher concentrations metal ions need to diffuse to the adsorbent surface by intra particle diffusion and greatly hydrolyzed ions will diffuse at a slower rate [14-16]. The metal uptake values for cadmium and chromium are in the range of 1.73 - 15.00 mg/g and 2.14 - 22.58 mg/g respectively. However it was discovered that Cr(VI) has a higher uptake value than Cd(II).
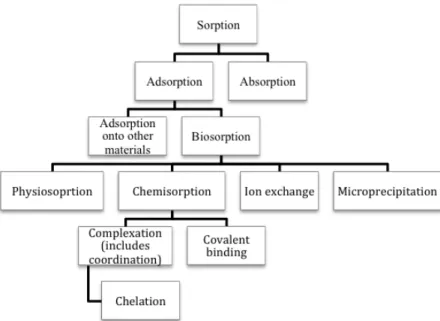
There is an important number of studies focused on biosorption of metals and metalloids exploring the potential of biomass for reducing the pollution load of aqueous solutions [34]. In all cases, the biosorption is explained due to the affinity between the sorbate ion and the biosorbent whose binding mechanisms depends on the chemical composition of the sorbent surface, the spetiation of the ion, as well as the chemistry of the aqueous solution. Figure 10 illustrates a classification system of the metal biosorption mechanisms [42].
Figure 10. Classification system of metal biosorption mechanisms
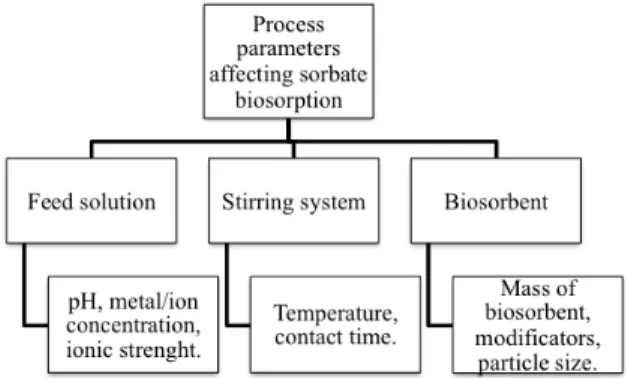
1.5.2 Process parameters that affect the biosorption
Although, many variables can influence the effectivness of sorbate biosorption [34], [40] (Figure 11), a few of them have a significant effect. For example, pH is one of the decisive factors that influences not only the chemistry of the solution but also strongly influences the activities of the functional groups on the biosorbent surface, as well as the speciation and the biosorption affinity of metal/metalloid ions. Some of the most important process parameters affecting metal binding are discussed below.
21
Figure 11. Parameters to assess for experimenting with sorbate uptake by biomass
1.5.2.1 pH
In the experiments, the pH of the sorbate-bearing solution can range from acidity to alkaline conditions. However, attention should be pay to sorbate (i.e; metal/metalloid) behavior as a function of the pH (speciation diagram) in order to prevent undesirable reactions not involving the biosortion process itself, i.e. at pH values over 5.5 because of higher concentration of OH− ions in the biosorption system chromium (III) ions precipitated as Cr(OH)3. For this reason, in this particular case the experiments should not be conducted at alkaline conditions [32].
The uptake of ions by biomass generally is a function of the solution pH, which influences both cell surface sorbate binding sites and sorbate chemistry in aqueous solutions [32].
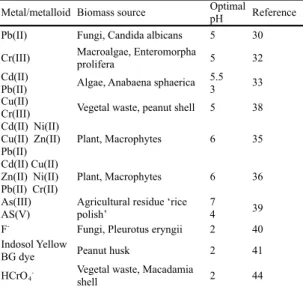
When the pH value increases the proton concentration decreases and the biomass surface is more negatively charged. In this context, the biosorption of the positively charged ions increase till reaching a maximum biosorption around [43]. It is accepted that the sorption of metal/metalloid cations (e.g. Cd, Cu, Zn) increases with increasing pH and only those ions which can occur as negatively charged complexes or that have a strong "b" character (i.e. tendency to form strong covalent bonds), may show either a decrease in binding with increasing pH or may have no significant pH effect at all [43]. Alternatively, in acidic conditions the biomass surface is more positively charged and the removal of anions increases due to the electrostatic attractions between opposite charges. Table 6 presents some optimal pH values found for the biosorption of some cations and anions including metals, arsenic and non metals (F- and indosol yellow, dye).
Table 6. Optimal pH values found for the biosorption of some ions including metals and metalloid
1.5.2.2 Sorbate concentration
This parameter also plays a significant role in the biosorption process. It acts as an important driving force to prevail over all mass transfer resistance of all ions between aqueous and solid phases. The higher initial ion concentrations may result in boosting up the biosorption process [43]. Then, sorbate removal increases with the increase in ion concentration [41], [43], but a decrease in sorption of ions at very high concentration can also be observed due to the saturation of active binding sites [44]. Increasing concentration of the solute in the solution could reduce the diffusion of solute in the boundary layer and to enhance the diffusion in the solid. At very high sorbate concentrations, the available sites for biosorption became fewer and the saturation of the sorption sites may be observed [32].
1.5.2.3 Temperature
To investigate the effect of temperature, the biosorption of ions onto biomass is generally studied at different temperatures between 15 °C and 60 °C [32], [39], [40], but experiments at higher temperatures can cause a change in the texture of the sorbent and a loss in the sorption capacity [43]. Temperature affects the biosorption equilibrium allowing a lower or higher retention of the sorbate due to the effect over the frequency of interactions between biosorbent and sorbate [32]. In this sense, the effect can be significant or not, but generally is not strong [32], [40].
Metal/metalloid Biomass source Optimal pH Reference
Pb(II) Fungi, Candida albicans 5 30
Cr(III) Macroalgae, Enteromorpha prolifera 5 32 Cd(II)
Pb(II) Algae, Anabaena sphaerica
5.5
3 33
Cu(II)
Cr(III) Vegetal waste, peanut shell 5 38
Cd(II) Ni(II) Cu(II) Zn(II) Pb(II) Plant, Macrophytes 6 35 Cd(II) Cu(II) Zn(II) Ni(II) Pb(II) Cr(II) Plant, Macrophytes 6 36 As(III) AS(V)
Agricultural residue ‘rice polish’
7
4 39
F- Fungi, Pleurotus eryngii 2 40
Indosol Yellow
BG dye Peanut husk 2 41
23
1.5.2.4 Contact time
During the biosorption of ions onto biomass the contact time runs from minutes to several hours until it is observed that the concentration of the ions in the solution is relatively constant, this implies that contact time or contact period between the ions in solution and the biomass should be enough for the ions to attain biosorption equilibrium [32], [39], [44] and subsequently to obtain the maximum uptake.
It can also be find that the uptake of adsorbate species is generally rapid in the initial stages and gradually decreases with the lapse of time until equilibrium [39].
1.5.2.5 Mass of biosorbent
The amount of biosorbent solid is important to guarantee that enough adsoption sites are available to adsorb the sorbate concentration desired. Hence, different biomass dosages are applied to study the influence of biomass concentration on the removal of ions by biosorbent [32]. From literature sources, it is expected that the biosorption of ions is increased with subsequent increasing the biosorbent dose until the uptake becomes constant [33], [38], [40], [45].
1.5.2.6 Particle size
The contact surface between any sorbent and the liquid phase plays an important role in the phenomena of adsorption. For instance, the rate of sorbate biosorption usually increases with the reduction in the diameter of the particles, which probably occurs due to the increase of the number of active sites and thus the increase of the biosorbent surface [46]. In this sense, a maximum elimination rate of sorbate may be reached using fine particles [46]
1.5.2.7 Modificators
The biosorbent can be used without previous treatment, but also a modifier to customize the chemical properties of its surface can also be used in order to increase adsorption capacity of the adsorbent. In general, biosorbents are usually prepared from the naturally abundant waste biomass by inactivation and are usually pretreated by washing with acid or base before the final drying [34].

![Table 1. Average values for boron on environmental matrices and some natural sources [9], [10]](https://thumb-eu.123doks.com/thumbv2/123dok_br/18136265.870759/16.918.187.718.304.627/table-average-values-boron-environmental-matrices-natural-sources.webp)
![Table 2. Industries utilising boron [11]](https://thumb-eu.123doks.com/thumbv2/123dok_br/18136265.870759/17.918.239.653.133.338/table-industries-utilising-boron.webp)