www.ambi-agua.net E-mail: [email protected]
This is an Open Access article distributed under the terms of the Creative Commons Attribution License, which permits unrestricted use, distribution, and reproduction in any medium, provided the original work is properly cited.
Baker’s yeast
-MnO
2composites as biosorbent for Malachite green: An
ecofriendly approach for dye removal from aqueous solution
ARTICLES doi:10.4136/ambi-agua.2254
Received: 13 Mar. 2018; Accepted: 01 Nov. 2018
Bruna Assis Paim dos Santos1 ; Aline Silva Cossolin1 ; Hélen Cristina Oliveira dos Reis1 ; Ketinny Camargo de Castro1 ;
Evanleide Rodrigues da Silva2 ; Gabriele de Menezes Pereira3 ; Paulo Teixeira de Sousa Junior3 ; Evandro Luiz Dall'Oglio3 Leonardo Gomes de Vasconcelos3 ; Eduardo Beraldo de Morais1*
1Universidade Federal de Mato Grosso (UFMT), Cuiabá, MT, Brasil
Departamento de Engenharia Sanitária e Ambiental (DESA). E-mail: [email protected], [email protected], [email protected], [email protected],
2Universidade Federal de Mato Grosso (UFMT), Cuiabá, MT, Brasil
Programa de Pós-Graduação em Recursos Hídricos (PPGRH). E-mail: [email protected]
3Universidade Federal de Mato Grosso (UFMT), Cuiabá, MT, Brasil
Departamento de Química. E-mail: [email protected], [email protected], [email protected], [email protected]
*Corresponding author
ABSTRACT
In this study, baker’s yeast-MnO2 composites, produced by direct oxidation of yeast with
KMnO4 under acidic conditions, were used as biosorbent to remove the triphenylmethane dye
Malachite green (MG) from an aqueous solution. Parameters that influence the adsorption process, such as pH, contact time, temperature, initial dye concentration and biosorbent dosage,
were evaluated in batch experiments. The optimum removal of MG was found to be 86.7 mg g-1 at pH 10, 1.0 g L-1 of biomass dosage and 45°C. The kinetic data of dye removal
was better described by the pseudo-second-order model. The adsorption process followed the
Langmuir isotherm model and the maximum biosorption capacity was estimated to be 243.9 mg g-1 (at 25°C). The negative values of ∆G° and the positive value of ∆H° indicated that
the MG biosorption onto yeast-MnO2 composites is spontaneous and endothermic. Fourier
transform infrared spectroscopy (FTIR) indicated that the nano-MnO2 particles deposited on
yeast-MnO2 composites surface facilitated the MG adsorption. It was concluded that baker’s
yeast-MnO2 composites have potential for application as adsorbent for removal of MG from
aqueous solution.
Rev. Ambient. Água vol. 14 n. 1, e2254 - Taubaté 2019
Compósitos de MnO
2-levedura de pão como biossorvente de verde
Malaquita: uma abordagem ambientalmente amigável para a remoção de
corante de solução aquosa
RESUMO
Neste estudo, compósitos de MnO2-levedura de pão, produzidos pela oxidação direta da
levedura com KMnO4 sob condições ácidas, foram usados como biossorvente para remover o
corante trifenilmetano verde Malaquita (VM) de solução aquosa. Os parâmetros que influenciam o processo de adsorção tais como pH, tempo de contato, temperatura, concentração inicial do corante e concentração do biossorvente foram avaliados em experimentos de bancada. As condições ótimas de descoloração foram observadas em pH 10 e concentração de biomassa igual a 1,0 g L-1. Os resultados de remoção do corante foram ajustados ao modelo cinético de pseudo segunda ordem. O processo de adsorção foi descrito pelo modelo isotérmico de Langmuir e a capacidade máxima de biossorção foi estimada em 243,9 mg g-1 (na temperatura
de 25°C). Os valores negativos de ∆G° e valores positivos de ∆H° indicaram que a biossorção do VM pelo compósito MnO2-levedura é espontâneo e endotérmico. A técnica de
espectroscopia no infravermelho com transformada de Fourier indicou que nanopartículas de MnO2 depositadas na superfície do compósito MnO2-levedura facilitaram a adsorção do VM.
Concluiu-se que o compósito MnO2-levedura de pão possui potencial para ser usado como
adsorvente na remoção de VM de solução aquosa.
Palavras-chave: biossorção, modelos isotérmicos e cinéticos, modelo termodinâmico.
1. INTRODUCTION
Most dyes are synthetic chemicals widely used in textile, rubber, tanneries, paper, plastic, and paint industries for coloring purposes. It is estimated that there are more than 100,000 commercial dyes with a production of 7 x 10⁵–1 x 10⁶ t per year and approximately 280,000 t dyes are discharged together with industrial effluent annually worldwide (Fan et al., 2012). The presence of dyes in aquatic ecosystems is the cause of serious environmental and health concerns. The colored wastewaters do not only affect the transparency and aesthetics of natural water bodies, but also reduce photosynthesis by decreasing light penetration (Zhang et al., 2011). In addition, many dyes and their degradation products are potentially toxic, mutagenic and carcinogenic to living systems (Akar et al., 2015).
Some traditional chemical, physical and biological methods, such as coagulation, precipitation, ultrafiltration, electrolysis, color irradiation, ozonation and activated sludge have been employed for the treatment of dye-containing wastewater (Wu et al., 2011). However, there are disadvantages in all these methods, such as high cost, intensive energy requirements and formation of toxic by-products (secondary pollution) (Akar et al., 2009). On the other hand, biosorption technology utilizing different types of biomasses is an efficient and economic process to remove pollutants from wastewater. This is attributed to easy availability of some biosorbents, simplicity of design and operation and ability to treat wastewater with high concentration of pollutants (Castro et al., 2017). In the past decade, biosorbents including agro-industrial by-products (Akar et al., 2009), and biomass of algae (Khataee et al., 2013), filamentous fungi (Yang et al., 2011) and yeast (Castro et al., 2017) have been successfully applied to decolorize aqueous solutions and textile wastewater.
Rev. Ambient. Água vol. 14 n. 1, e2254 - Taubaté 2019
cerevisiae can be produced cheaply using simple fermentation techniques or obtained as a waste from various industrial fermentation processes. Its dye-adsorptive ability is due to the chemical characteristics of its cell wall, which contains a high amount of polysaccharides, some proteins and other components. These biomacromolecules are sources of different functional groups such as amino, carboxyl, thiol, sulfhydryl and phosphate groups, which are responsible for dye adsorption (Fan et al., 2012). However, the amount of these functional groups on the biomass could be limited, and most biosorbents do not show a high sorption capacity for cationic dyes (Yu et al., 2009).
Since the adsorption of dyes takes place mainly on the biomass surface, current researches have focused on applying different chemical agents to modify the surface of biosorbents and to improve adsorption capacity. Yang et al. (2011) reported that modified biomass of Penicillium
YW01with cetylpyridinium chloride significantly improved the adsorption of Acid Blue 25 dye from aqueous solution and phosphoric-phosphate buffer. Akar et al. (2015) showed that pretreatment of sugar-beet pulp with quaternary ammonium-salt is able to improve adsorption efficiency for Acid Red 1.
In this work, Malachite green (MG) dye was used as a model compound. MG is a cationic triphenylmethane dye also called Basic Green 4. It is extensively used in the pigment industry, having numerous applications in paper printing, textile industry, and in leather and cosmetics manufacturing. Furthermore, MG is also used as a topical antiparasitic and antiprotozoal agent in aquaculture (Chowdhury and Saha, 2010). However, it has been found that MG is environmentally persistent and causes carcinogenesis, mutagenesis, chromosomal fractures, teratogenicity and respiratory toxicity (Baek et al., 2010). Despite this, due to its availability and low cost, it is still widely used.
This study evaluated the capability of baker’s yeast-MnO2 composites (yeast-MnO2
composites) to remove MG from an aqueous solution under different experimental conditions, such as initial pH, contact time, temperature, dye concentration and biosorbent dosage. In order to obtain a better understanding of the biosorption mechanisms for future applications in real scale, the kinetics, isotherm and thermodynamics of dye removal were also studied. The preparation of yeast-MnO2 composites was first described by Xia et al. (2015) and involved the
direct oxidation of baker’s yeast biomass with KMnO4 under acidic conditions. This
modification was first tested for Cd2+ removal and to the best of our knowledge, it has not been used yet for cationic dye removal from aqueous solutions.
2. MATERIAL AND METHODS
2.1. Baker’s yeast, reagents and preparation of yeast-MnO2 composites
Baker’s yeast was purchased from a commercial market. It was washed several times with
ultra-pure water to remove dirt and soluble impurities, and then dried at 80°C for 48 h. The powdered biomass was crushed and sieved to select particle fractions of less than 300 μm using an ASTM Standard sieve and then stored in desiccators for further use.
Stock solution of MG (1000 mg/L) was prepared using ultra-pure water and was used to prepare the aqueous solutions used in biosorption experiments. MG was purchased from VETEC – Sigma-Aldrich, Brazil. All other chemicals used were of analytical grade.
To prepare the yeast-MnO2 composites, 20 g of baker’s yeast was added to a
200 mL KMnO4 (0.05 M) solution and the solution pH was adjusted to 2.0, using HCl (0.1 M)
(Xia et al., 2015). The mixture was then agitated on a rotary shaker at 300 rpm for 30 min. The suspension was centrifuged (3600 rpm, 15 min) and biomass was washed repeatedly using ultra-pure water several times to remove the residual KMnO4. Lastly, the biomass was dried at 80°C
for 48 h, sieved to select particle fractions of less than 300 μm using an ASTM Standard sieve,
Rev. Ambient. Água vol. 14 n. 1, e2254 - Taubaté 2019
2.2. Batch biosorption experiments
Experiments were conducted with 150 mL Erlenmeyer flasks containing a 50 mL aqueous solution of MG. Flasks were agitated on a rotary shaker at 120 rpm and 25ºC. Because adsorption is directly influenced by physicochemical variables, variables such as different pH (2, 4, 6, 8 and 10, adjusted by the addition of 0.1 M HCl or 0.1 M NaOH solutions), initial dye concentration (100, 150, 200, 250, 300 and 350 mg L-1), biosorbent dosage (1.0, 1.5, 2.0 and 3.0 g biomass L-1) and temperature (25, 35 and 45°C) were evaluated. At the end of each equilibrium experiment, the biosorbent was removed from the suspension by centrifugation (3600 rpm, 15 min) and the residual dye in the solution was measured quantitatively by a UV– Vis spectrophotometer (Hach DR6000) at λmax = 617 nm. All biosorption experiments were
performed in triplicate and the dye removal efficiency, R (%), and dye biosorption capacity (qe,
mg g-1) of biomass at the equilibrium were calculated according to Equations 1 and 2, respectively:
𝑅(%) =𝐶𝑖−𝐶𝑒
𝐶𝑖 × 100 (1)
𝑞𝑒 =(𝐶𝑖−𝐶𝐵 𝑒) (2)
Where Ci and Ce are the initial and the equilibrium dye concentrations (mg L-1) and B is
the biosorbent concentration in solution (g L-1). 2.3. FTIR analysis
Fourier transform infrared spectroscopy (FTIR) analyses were performed on a Shimadzu Iraffinity-1 spectrophotometer (Model: IRAffinity-1; Catalogue Number: 206-73500-38; Serial Number: A21374902249S1; Brand: Shimadzu Corporation). FTIR was used to determine the functional groups on the yeast-MnO2 composites and their responsibility for MG adsorption.
After adsorption of MG until equilibrium, the residual dye solution was centrifuged (3600 rpm, 15 min), the supernatant was discarded and the residual biosorbent dried at 80°C for 48 h after being washed with ultra-pure water three times. The samples (1mg biosorbent) were mixed with spectroscopically pure KBr (100 mg), and pellets were fixed in a sample holder. The qualitative analyses were carried out using the following parameters: Measured Mode (% Transmittance),
Apodization (Happ_Genzel), Number of Scans (200), Resolution (16), Range (400 a 4700 cm-1), Gain (1). The acquisitions of spectra were made using IRSolution software
(Version 1.50). The background obtained from KBr disks was automatically subtracted from the sample disks spectra.
3. RESULTS AND DISCUSSION
3.1. Effect of initial pH
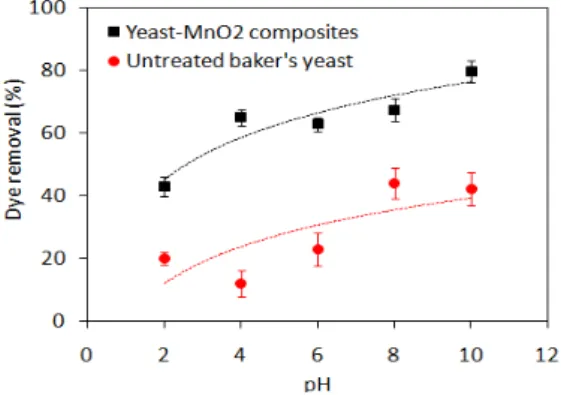
The pH is an important factor affecting the biosorption process since it influences the dye solubility and the ionizing functional groups of the biosorbent cell wall (Khataee et al., 2013). The pH also affects the structural stability of MG, and therefore its color intensity. Chen et al. (2014) observed color reduction when solution pH was more than 10 and lower than 2. Consequently, in our study the initial pH ranges from 2 to10. Figure 1 illustrates the effect of different initial pH on the removal of MG by untreated baker’s yeast and yeast-MnO2
composites at a dye concentration of 100 mg L-1 for 60 min, 25ºC and 1.0 g biosorbent L-1. As
Rev. Ambient. Água vol. 14 n. 1, e2254 - Taubaté 2019
and the positively charged MG dye cations lead to dye removal from the solution. Figure 1 also shows that MG removal efficiency of yeast-MnO2 composites was higher than the removal
efficiency of untreated baker’s yeast. This is explained by the destruction of yeast cell walls
and the exposure of more functional groups during oxidation with KMnO4 and the nano-MnO2
particles that are deposited on yeast surface, which can facilitate the biosorption of dye (Xia et al., 2015). Since the greatest removal efficiency was observed at pH 10, this pH was used in subsequent experiments.
Figure 1. Effect of pH on the biosorption of MG by untreated baker’s yeast and
yeast-MnO2 composites (biosorbent
dosage = 1.0 g L-1, dye concentration =
100 mg L-1, contact time = 60 min,
temperature = 25°C).
3.2. Effect of contact time
Considering the practical application, the ideal biosorption materials should be capable of rapidly adsorbing high concentrations of dyes from the wastewater and establishing equilibrium (Khataee et al., 2013). Therefore, the influence of the contact time on the MG biosorption capacity by yeast-MnO2 composites was tested at 25, 35 and 45°C by varying the contact time
between 10 and 120 min. Figure 2 shows that for the given temperatures, a rapid biosorption of MG occurred at 10 min and was gradually slowed down until equilibrium, which was achieved at 50-60 min. Also, it can be seen that the equilibrium biosorption capacity of yeast-MnO2
composites increased from 86.5 to 95.7 mg g-1 when the temperature was increased from 25 to 45°C. An increase in MG biosorption capacity of the biosorbent with temperature indicates that the biosorption of MG on yeast-MnO2 composites is kinetically controlled by an endothermic
process.
Figure 2. Effect of contact time on the
biosorption of MG by yeast-MnO2
composites at different temperatures (pH = 10, biosorbent dosage = 1.0 g L-1, dye
Rev. Ambient. Água vol. 14 n. 1, e2254 - Taubaté 2019
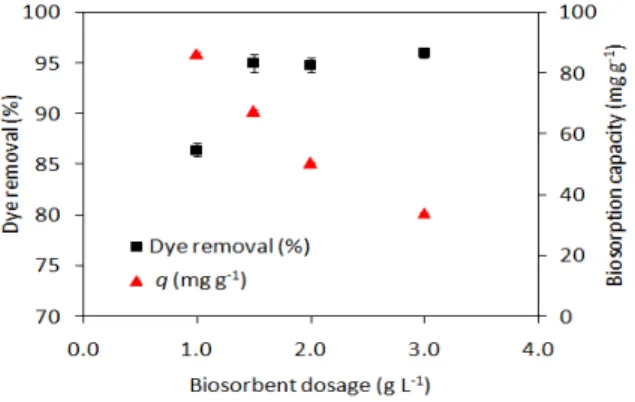
3.3. Effect of biosorbent dosage
Figure 3 illustrates the effect of biosorbent dosage on the biosorption of MG. As can be seen, the percentage of removal increased when the biomass dosage rose from 1.0 to 1.5 g L-1. A further increase in the biomass amount (2.0 and 3.0 g L-1), however, caused no significant
change in dye removal. On the order hand, the biosorption capacity decreased from 86.5 to 34.1 mg g-1 when the biomass dosage increased from 1.0 to 3.0 g L-1. The decrease in the
biosorption capacity at higher yeast-MnO2 composite dosages can be attributed to the
adsorption sites that remained unsaturated during the adsorption reaction, whereas the number of sites available for adsorption is increased by increasing the biosorbent dosage (Castro et al., 2017).
Figure 3. Effect of biosorbent dosage on the biosorption of MG by yeast-MnO2 composites
(dye concentration = 100 mg L-1, contact time =
120 min, pH = 10, temperature = 25ºC).
3.4. Effect of initial concentration of dye
The initial concentration of dye provides an important driving force to overcome all mass transfer resistances of the dye between the aqueous and the solid phases (Khataee et al., 2013). In this study, MG biosorption capacity of the yeast-MnO2 composites was investigated using
solutions of dye that ranged from 100 to 350 mg L-1 and temperature of 25°C. The results in Figure 4 indicated that dye removal efficiency decreased with the increase in the initial dye concentration. On the other hand, biosorption capacity was increased and reached a maximum value of 214.1 mg g-1 at an MG initial concentration of 300 mg L-1. MG removal efficiency was higher at lower initial dye concentrations because all dye molecules may interact with the binding sites on the cell surface, while at higher dye concentrations, the binding sites on the biosorbent surface are saturated and no further biosorption occurs. A decrease in the biosorption
capacity observed at a concentration of 350 mg L-1 when compared to concentration of 300 mg L-1 can be related to the repulsive forces between the dye molecules at the adjacent sites
on the cell surface, which lead to a removal of some dye molecules from the surface (Castro et al., 2017).
3.5. Biosorption kinetics
Rev. Ambient. Água vol. 14 n. 1, e2254 - Taubaté 2019
Figure 4. Effect of initial dye concentration on the biosorption of MG by yeast-MnO2 composites
(biosorbent dosage = 1.0 g biomass L-1, dye
concentration = 100 mg L-1, contact time = 120 min,
temperature = 25°C).
The linear form of the pseudo-first order model is represented by Equation 3:
log(𝑞𝑒− 𝑞𝑡) = log 𝑞𝑒− 2.303𝐾1 𝑡 (3)
Where qe and qt are the amounts of dye adsorbed by biosorbent (mg g-1) at equilibrium and
at time t (min), respectively, and K1 is the pseudo-first order rate constant (min-1). The values
of K1 and the predicted qe were determined from the plot of log (qe−qt) against t.
The linear form of the pseudo-second order model can be expressed as in Equation 4:
𝑡 𝑞𝑡=
1 𝐾2𝑞𝑒2+
1
𝑞𝑒𝑡 (4)
Where qe and qt are the amounts of dye adsorbed by biosorbent (mg g-1) at the equilibrium
and at time t (min), respectively, and K2 is the pseudo-second order rate constant
(g mg-1 min-1). From the plot of t/q
t against t, the model’s parameters K2 and qe could be
determined.
The intraparticle diffusion model allows for the identification of the diffusion mechanisms and can be represented by Equation 5:
𝑞𝑡 = 𝐾𝑖𝑑𝑡0.5+ 𝐶 (5)
Where C is the intercept (mg g-1) and Kid is the intraparticle diffusion rate constant
(mg g-1 min-0.5). By plotting q
t versus t0.5, the values of Kid and C could be obtained. If the plot
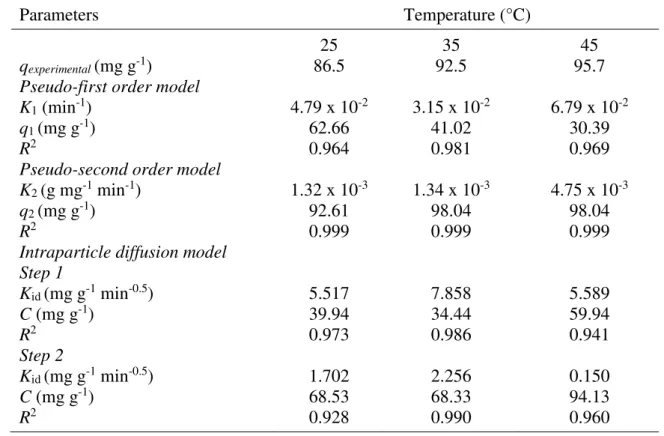
crosses the origin (C = 0), the adsorption process is controlled only by intraparticle diffusion. The kinetic parameters for the MG biosorption for different temperatures are given in Table 1. Although the pseudo-first order model resulted in good fits (R2 > 0.964, Figure 5a and
Table 1), the experimental qe values (86.5, 92.5 and 95.7 mg g-1 at 25, 35 and 45°C) did not
agree with the calculated ones (62.66, 41.02 and 30.39 mg g-1 at 25, 35 and 45°C). The pseudo-second order model, on the order hand, resulted in the best fits (R2 = 0.999 for all temperatures studied, Figure 5b) and the biosorption capacities (q2) estimated were much closer to
Rev. Ambient. Água vol. 14 n. 1, e2254 - Taubaté 2019
rate constant values changed from 1.32 x 10⁻³ to 4.75 x 10⁻³ (g mg-1 min-1). Similar results have
been reported in the literature (Khataee et al., 2013; Wu et al., 2011). In the case of the intraparticle diffusion model, the biosorption results showed similar overall features of multilinear plots with two steps (Figure 5c). The first step is attributed to the external surface adsorption or instantaneous diffusion stage, during which a large amount of MG is rapidly adsorbed by the outer surface of the biosorbent. This is considered the fast step, demonstrated by the highest Kid constant values. The second step is the gradual biosorption stage controlled
by intraparticle diffusion. As the plots did not cross the origin (C ≠ 0), they suggest that
intraparticle diffusion is not the only operative mechanism and that the biosorption kinetics of MG on yeast-MnO2 composites was controlled by both surface and intraparticle diffusion
processes.
Table 1. Kinetic parameters estimated by the pseudo first-order, pseudo second-order and intraparticle diffusion models for the MG biosorption on the yeast-MnO2 composites.
Parameters Temperature (°C)
25 35 45
qexperimental (mg g-1) 86.5 92.5 95.7
Pseudo-first order model
K1 (min-1) 4.79 x 10⁻² 3.15 x 10⁻² 6.79 x 10⁻²
q1 (mg g-1) 62.66 41.02 30.39
R2 0.964 0.981 0.969
Pseudo-second order model
K2 (g mg-1 min-1) 1.32 x 10⁻³ 1.34 x 10⁻³ 4.75 x 10⁻³
q2 (mg g-1) 92.61 98.04 98.04
R2 0.999 0.999 0.999
Intraparticle diffusion model Step 1
Kid (mg g-1 min-0.5) 5.517 7.858 5.589
C (mg g-1) 39.94 34.44 59.94
R2 0.973 0.986 0.941
Step 2
Kid (mg g-1 min-0.5) 1.702 2.256 0.150
C (mg g-1) 68.53 68.33 94.13
R2 0.928 0.990 0.960
3.6. Equilibrium isotherm
Rev. Ambient. Água vol. 14 n. 1, e2254 - Taubaté 2019
Figure 5. Plots for pseudo-first order (a), pseudo-second order (b) and intraparticle diffusion (c) models for the biosorption of MG onto yeast-MnO2 composites, at different temperatures.
The Langmuir isotherm model assumes monolayer coverage of adsorbate over a homogeneous adsorbent surface. Also, all the binding sites of the surface have equal energy of sorption. The linear form of the Langmuir equation can be given as in Equation 6:
1 𝑞𝑒 =
1 𝑞𝑚𝑎𝑥+ (
1 𝑞𝑚𝑎𝑥𝐾𝐿)
1
𝐶𝑒 (6) where qe (mg g-1) is the amount of dye adsorbed by the biosorbent at the equilibrium, Ce
(mg L-1) is the dye concentration in the solution at equilibrium, qmax (mg g-1) is the maximum
adsorption capacity, and KL (L mg-1) is the Langmuir constant related to free energy of
adsorption. The plot of 1/qe versus 1/Ce was employed to generate the values of qmax and KL
(Figure 6a).
The Freundlich isotherm, on the order hand, is an empirical equation employed to describe heterogeneous adsorption surface and is given by Equation 7:
ln 𝑞𝑒= ln 𝐾𝑓 + 𝑛1ln 𝐶𝑒 (7)
Where Kf ((mg g-1)(mg L-1)-1/n) is the Freundlich constant related to the adsorption capacity
of adsorbent and n (dimensionless) is intensity of adsorption. Kf and n were calculated by
Rev. Ambient. Água vol. 14 n. 1, e2254 - Taubaté 2019
The D-R model was used to estimate the mean free energy of biosorption. The linearized form of the D-R model is expressed by Equation 8:
𝑙𝑛 𝑞𝑒 = 𝑙𝑛 𝑞𝑚− 𝛽𝜀2 (8)
Where qe (mol g-1) is the amount of dye adsorbed on the biosorbent, qm (mol g-1) is the
maximum biosorption capacity, β (mol2 kJ−2) is the constant related to the mean free energy of biosorption and ɛ is the Polanyi potential. The values of qm and β were determined from the
linear plot of ln qe versus ɛ2 (Figure 6c). The ɛ value was calculated with Equation 9: 𝜀 = 𝑅𝑇 𝑙𝑛 (1 + 𝐶1
𝑒) (9)
Where R (8.314 J mol-1 K-1) is the ideal gas constant and T (K) is the absolute temperature. Using the activity coefficient β, it is possible to estimate the mean free energy of biosorption (E, kJ mol-1), according to Equation 10:
𝐸 = √2𝛽1 (10)
The E value gives information about the mechanism involved in the biosorption. When E
value falls in the range from 8 to 16 kJ mol-1, the biosorption process is controlled by a chemical
mechanism, while for E < 8 kJ mol, the biosorption process proceeds through a physical mechanism.
Rev. Ambient. Água vol. 14 n. 1, e2254 - Taubaté 2019
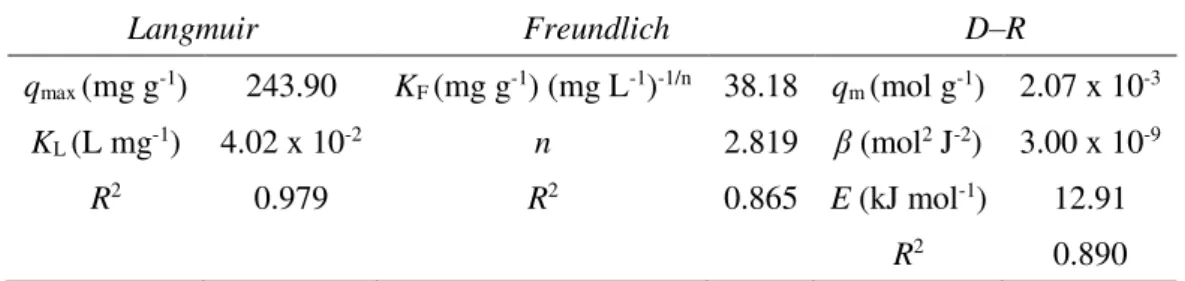
The parameters obtained from the isotherm models applied to the experimental data for MG biosorption onto yeast-MnO2 composites are listed in Table 2. The linear correlation
coefficients (R2) show that the equilibrium data could be better interpreted by the Langmuir isotherm (R2 = 0.979) than by the Freundlich isotherm (R2 = 0.866). This suggests that the biosorption process of MG onto yeast-MnO2 composites assumes a monolayer adsorption, and
the maximum biosorption capacity was 243.90 mg g-1. The maximum adsorption capacities of
MG onto various adsorbents reported in the literature are listed in Table 3. The adsorption capacity of yeast-MnO2 composites obtained for MG in this investigation is higher than those
of many corresponding adsorbent materials.
The free energy of MG biosorption was considered via D-R model. A relatively high correlation coefficient (R2 = 0.890) was found. As can be seen from Table 2, the mean biosorption energy (E) calculated was 12.91 kJ mol-1, which indicates that the biosorption
process of MG onto yeast-MnO2 composites was considered to be a chemical adsorption.
Table 2. Biosorption isotherm constants for the biosorption of MG onto yeast-MnO2
composites.
Langmuir Freundlich D–R
qmax (mg g-1) 243.90 KF (mg g-1) (mg L-1)-1/n 38.18 qm (mol g-1) 2.07 x 10⁻³
KL (L mg-1) 4.02 x 10⁻² n 2.819 β (mol2 J-2) 3.00 x 10⁻⁹
R2 0.979 R2 0.865 E (kJ mol-1) 12.91
R2 0.890
Table 3. Comparison of MG adsorption capacity of different adsorbents.
Adsorbent T (°C) pH qmax (mg g-1) Reference
Brown-rotted pine wood 30 4.0 29.85 Zhang et al. (2011)
Leaf of pineapple (Ananas comosus) 25 9.0 54.64 Chowdhury et al. (2011)
Potato peel 25 4.0 32.39 Guechi and Hamdaoui (2016)
Sea shell powder 30 8.0 42.33 Chowdhury and Saha (2010)
Rice straw modified with citric acid 20 6.0 256.41 Gong et al. (2006)
Degreased coffee bean 25 4.0 55.30 Baek et al. (2010)
Baker’s yeast-MnO2 composites 25 10 243.90 Present study
3.7. Thermodynamic study
To investigate the thermodynamics of MG biosorption onto yeast-MnO2 composites, the
main thermodynamic parameters, such as standard changes of free energy (∆G°), enthalpy
(∆H°) and entropy (∆S°) were calculated by the following Equations 11, 12 and 13:
∆𝐺° = −𝑅𝑇 𝑙𝑛𝐾𝐷 (11)
∆𝐺° = ∆𝐻° − 𝑇∆𝑆° (12)
The combination of Equations 11 and 12 gives:
𝑙𝑛𝐾𝐷 = ∆𝑆°𝑅 − ∆𝐻°𝑅 𝑥1𝑇 (13)
Where KD (qe/Ce) is the distribution coefficient, T (K) is the absolute temperature and R is
Rev. Ambient. Água vol. 14 n. 1, e2254 - Taubaté 2019
Figure 7. Plot of lnKD versus 1/T for estimation of thermodynamic parameters.
The calculated thermodynamic parameters are listed in Table 4. The negative values of
∆G° indicate that the MG biosorption onto yeast-MnO2 compositesis spontaneous and feasible
at all the studied temperatures (25, 35 and 45°C). The change in the standard enthalpy (∆H°) was 42.1 kJ mol−1. The positive value of ∆H° suggests that the biosorption is endothermic in nature and reflects the affinity of yeast-MnO2 composites for MG. This trend may be explained
by the availability of more active sites of biosorbent at higher temperatures due to increased
surface activity and increased kinetic energy of the MG molecules (Akar et al., 2009). The ΔS° parameter was also found to be positive, thus suggesting that the randomness at the biosorbent/solution interface increases during the biosorption of dye.
Table 4. Thermodynamic parameters estimated for MG biosorption onto yeast-MnO2 composites.
T (°C) KD ∆G° (kJ mol-1) ∆H° (kJ mol-1) ∆S° (J mol-1 K-1)
25 6.39 -4.70 42.10 157.0
35 12.76 -6.27
45 18.53 -7.84
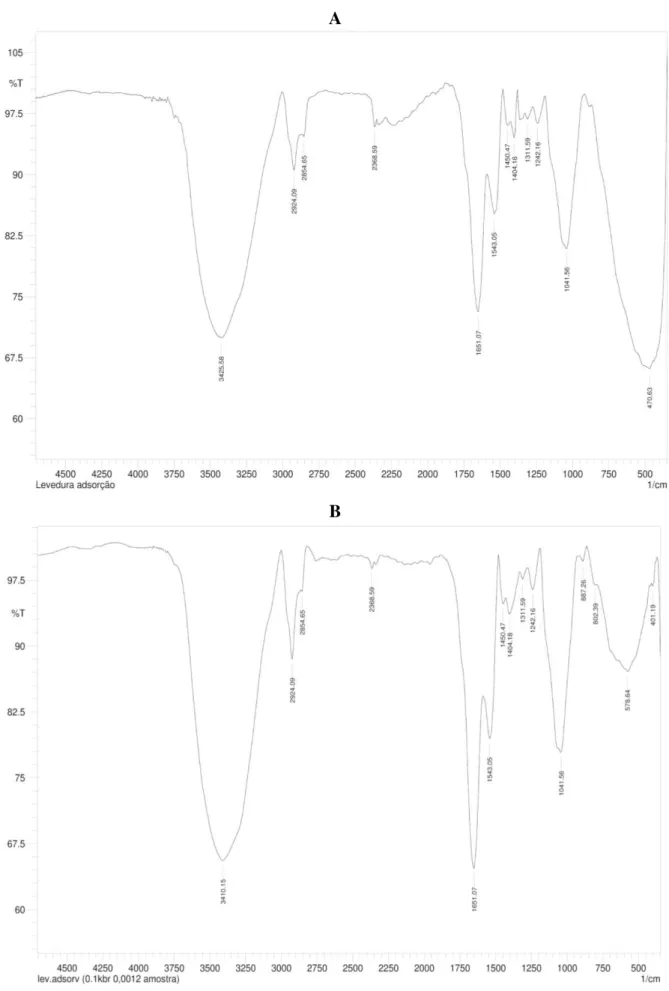
3.8. FTIR analysis
FTIR spectroscopy is an important technique to identify the functional groups in the surface of adsorbents and the possible interactions between them and the adsorbate. As seen in the spectrum of yeast-MnO2 composites before MG adsorption (Figure 8a), a broad and strong
band at around 3425.58 cm-1 is indicative of the overlapping of O–H and N–H stretching vibrations (Yang et al., 2011). The peaks at 2924.09 and 2854.65 cm-1 are attributed to the C–
H stretching vibrations of aliphatic groups (Yang et al. 2011). Protein-related bonds of amide I, II and III are observed at peaks 1651.07, 1543.05 and 1242.16 cm-1, respectively, while the band at 1404.18 cm-1 is attributed to C–OH bend from carboxylic groups (Xia et al., 2015). The
band at 1041.56 cm-1 can be due to stretching of glycitols (C–OH), the P–O–C (Zhang et al., 2011) and C–OH dimer carboxylic acid. The peak observed at the low-frequency region around 470.63 cm-1 is ascribed to Mn–O vibrations (Parikh and Chorover, 2005), indicating the presence of nano-MnO2 particles on the yeast surface (Xia et al., 2015). After MG adsorption
(Figure 8b), the peak at 470.63 cm-1 disappeared and the presence of a new peak at 578.64 cm-1 indicated that the nano-MnO2 particles on yeast-MnO2 composite surface were
responsible for MG biosorption. Additionally, the peak at 3425.58 cm-1 shifted to 3410.15,
Rev. Ambient. Água vol. 14 n. 1, e2254 - Taubaté 2019
A
B
Figure 8. FTIR spectra of yeast-MnO2 composites before MG adsorption (a) and after MG
Rev. Ambient. Água vol. 14 n. 1, e2254 - Taubaté 2019
4. CONCLUSION
Modification of baker’s yeast with KMnO4 under acidic conditions significantly increased
the biosorption capacity of MG compared to unmodified yeast. The biosorption process proved to be dependent on the pH of the solution, temperature, contact time, biosorbent dosage and initial concentration of dyes. The optimum removal of MG was found to be 86.7 mg g-1 at pH 10, 1.0 g L-1 of biomass dosage and 45°C. The experimental data fit well with
pseudo-second-order model and Langmuir models, and the maximum biosorption capacity was estimated to be 243.9 mg g-1 (at 25°C). Thermodynamic parameters, ∆G° and ∆H°, indicated that the MG biosorption onto yeast-MnO2 compositesis spontaneous and endothermic. In conclusion,
yeast-MnO2 composites may be an economic, effective and eco-friendly option for the removal of the
cationic dye MG from aqueous media.
5. ACKNOWLEDGMENTS
This work was supported by CNPq under Grant 486168/2013-1.
6. REFERENCES
AKAR, S. T.; YILMAZER, D.; CELIK, S.; BALK, Y. Y.; AKAR, T. Effective bio decolorization potential of surface modified lignocellulosic industrial waste biomass. Chemical Engineering Journal, v. 259, p. 286–292, 2015. http://dx.doi.org/10.1016/j.cej.2014.07.112
AKAR, T.; TOSUN, I.; KAYNAK, Z.; OZKARA, E.; YENI, O.; SAHIN, E. N.; TUNALI, S. An attractive agro-industrial by-product in environmental cleanup: Dye biosorption potential of untreated olive pomace. Journal of Hazardous Materials, v. 166, p. 1217–
1225, 2009. https://doi.org/10.1016/j.jhazmat.2008.12.029
BAEK, M. H.; IJAGBEMI, C. O.; O, S. J.; KIM, D. S. Removal of Malachite Green from aqueous solution using degreased coffee bean. Journal of Hazardous Materials, v. 176, n. 1–3, p. 820–828, 2010. https://doi.org/10.1016/j.jhazmat.2009.11.110
CASTRO, K. C.; COSSOLIN, A. S.; REIS, H. C. O.; MORAIS, E. B. Biosorption of anionic textile dyes from aqueous solution by yeast slurry from brewery. Brazilian Archives of Biology and Technology, v. 60, p. 1-13, 2017. https://doi.org/10.1590/1678-4324-2017160101
CHEN, Z.; DENG, H.; CHEN, C.; YANG, Y.; XU, H. Biosorption of malachite green from aqueous solutions by Pleurotus ostreatus using Taguchi method. Journal of Environmental Health Science and Engineering, v. 12, n. 1, p. 63, 2014. http://dx.doi.org/jehse.biomedcentral.com/articles/10.1186/2052-336X-12-63
CHOWDHURY, S.; CHAKRABORTY, S.; SAHA, P. Biosorption of Basic Green 4 from aqueous solution by Ananas comosus (pineapple) leaf powder. Colloids and Surfaces B:
Biointerfaces, v. 84, n. 2, p. 520–527, 2011. http://dx.doi.org/10.1016/j.colsurfb.2011.02.009
Rev. Ambient. Água vol. 14 n. 1, e2254 - Taubaté 2019
FAN, H.; YANG, J.; GAO, T.; YUAN, H. Removal of a low-molecular basic dye (Azure Blue) from aqueous solutions by a native biomass of a newly isolated Cladosporium sp.: Kinetics, equilibrium and biosorption simulation. Journal of the Taiwan Institute of Chemical Engineers, v. 43, n. 3, p. 386–392, 2012. http://dx.doi.org/10.1016/j.jtice.2011.11.001
GONG, R.; JIN, Y.; CHEN, F.; CHEN, J.; LIU, Z. Enhanced malachite green removal from aqueous solution by citric acid modified rice straw. Journal of Hazardous Materials, v. 137, n. 2, p. 865–870, 2006. https://doi.org/10.1016/j.jhazmat.2006.03.010
GUECHI, E. K.; HAMDAOUI, O. Sorption of malachite green from aqueous solution by potato peel: Kinetics and equilibrium modeling using non-linear analysis method. Arabian Journal of Chemistry, v. 9, p. S416–S424, 2016. https://doi.org/10.1016/j.arabjc.2011.05.011
KEDARI, C. S.; DAS, S. K.; GHOSH, S. Biosorption of long lived radionuclides using immobilized cells of Saccharomyces cerevisiae. World Journal of Microbiology and Biotechnology, v. 17, p. 789-793, 2001. https://dx.doi.org/10.1023/A:1013547307770
KHATAEE, A. R.; VAFAEI, F.; JANNATKHAH, M. Biosorption of three textile dyes from contaminated water by filamentous green algal Spirogyra sp.: Kinetic, isotherm and thermodynamic studies. International Biodeterioration and Biodegradation, v. 83, p. 33–40, 2013. http://dx.doi.org/10.1016/j.ibiod.2013.04.004
PARIKH, S. J.; CHOROVER, J. FTIR spectroscopic study of biogenic Mn-Oxide formation by Pseudomonas putida GB-1. Geomicrobiology Journal, v. 22, p. 207–218, 2005. https://doi.org/10.1080/01490450590947724
WU, Y.; HU, Y.; XIE, Z.; FENG, S.; LI, B.; MI, X. Characterization of biosorption process of
acid orange 7 on waste brewery’s yeast. Applied Biochemistry and Biotechnology, v. 163, n. 7, p. 882–894, 2011. https://doi.org/10.1007/s12010-010-9092-z
XIA, Y.; MENG, L.; JIANG, Y.; ZHANG, Y.; DAI, X.; ZHAO, M. Facile preparation of MnO2
functionalized baker’s yeast composites and their adsorption mechanism for Cadmium.
Chemical Engineering Journal, v. 259, p. 927–935, 2015. http://dx.doi.org/10.1016/j.cej.2014.08.071
YANG, Y.; JIN, D.; WANG, G.; LIU, D.; JIA, X.; ZHAO, Y. Biosorption of Acid Blue 25 by unmodified and CPC-modified biomass of Penicillium YW01: Kinetic study, equilibrium isotherm and FTIR analysis. Colloids and Surfaces B: Biointerfaces, v. 88, n. 1, p. 521–
526, 2011. http://dx.doi.org/10.1016/j.colsurfb.2011.07.047
YU, J. X.; LI, B. H.; SUN, X. M.; YUAN, J.; CHI, R. Polymer modified biomass of baker’s yeast for enhancement adsorption of methylene blue, rhodamine B and basic magenta. Journal of Hazardous Materials, v. 168, n. 2–3, p. 1147–1154, 2009. https://doi.org/10.1016/j.jhazmat.2009.02.144