Contents lists available atScienceDirect
Separation and Puri
fi
cation Technology
journal homepage:www.elsevier.com/locate/seppur
Cold extraction of phenolic compounds from watercress by high hydrostatic
pressure: Process modelling and optimization
José Pinela
a,b, M.A. Prieto
a,c, Lillian Barros
a, Ana Maria Carvalho
a, M. Beatriz P.P. Oliveira
b,
Jorge A. Saraiva
d, Isabel C.F.R. Ferreira
a,⁎aCentro de Investigação de Montanha (CIMO), Instituto Politécnico de Bragança, Campus de Santa Apolónia, 5300-253 Bragança, Portugal bREQUIMTE/LAQV, Faculdade de Farmácia, Universidade do Porto, Rua Jorge Viterbo Ferreira, n° 228, 4050-313 Porto, Portugal cNutrition and Bromatology Group, Faculty of Food Science and Technology, University of Vigo, Ourense Campus, E32004 Ourense, Spain dQOPNA, Departamento de Química, Universidade de Aveiro, Campus Universitário de Santiago, 3810-193 Aveiro, Portugal
A R T I C L E I N F O
Keywords: Nasturtium officinale
Phenolic acids Flavonoids
High hydrostatic pressure Extraction optimization
A B S T R A C T
High hydrostatic pressure (HHP) was applied to the extraction of phenolic compounds from watercress (Nasturtium officinale). The process was optimized by response surface methodology using afive-level central composite design combining the independent variables of processing time (t, 1.5–33.5 min), pressure (P, 0.1–600 MPa) and solvent (S, 0–100% of ethanol, v/v). The individual and grouped phenolic compounds, analyzed by HPLC-DAD-ESI/MS, and the extraction yield were used as response variables. The theoretical models werefitted to the experimental data, statistically validated, and used in the prediction and optimization steps. The optimal HHP conditions for the extraction of phenolic compounds were:t= 3.1 min,P= 600 MPa andS= 100%, and originated 64.68 ± 2.97 mg/g of extract. This study highlighted the HHP as a promising technology to cold extract phenolic compounds (phenolic acids andflavonoids) from watercress in a selective way using a green solvent and reduced extraction times.
1. Introduction
The recovery of bioactive compounds from natural sources and their further incorporation into foods[1], dietary supplements[2]and cos-meceuticals [3], either in isolated form or in enriched extracts, is a current hot topic that involves many research fields. Phenolic com-pounds are among the most desired plant secondary metabolites be-cause of their recognized bioactivities and capacity to protect against free radical-mediated diseases [4]. Several studies have been carried out in recent years to improve the extraction of these compounds from plant materials[5–7], but more efficient and sustainable methods need to be developed to achieve higher yields and superior quality products at lower processing costs.
Watercress (Nasturtium officinale R. Br.) is a semi-aquatic fast-growing plant of the Brassicaceae family with recognized health-pro-moting effects. Its consumption in a daily diet has been linked with a reduced risk of chronic diseases including different types of cancer [8–11]. This species is an interesting source of pharmacologically active phytochemicals [12–14]whose involvement in antigenotoxic and an-ticancer processes has been demonstrated in both in vivoandin vitro
assays[11,15–17]. A previous study reportedp-coumaric acid, quer-cetin-3-O-sophoroside and isorhamnetin-O-hydroxyferuloylhexoside-O -hexoside as the most abundant phenolic compound in wild watercress [14]. Higher concentrations of flavonoids than phenolic acids were reported in these extracts due to the high contents of isorhamnetin and quercetin glycosides and, in lesser extent, of kaempferol[14]. In turn, a dimer of caffeoylmalic acid, disinapoylgentibiose and ferulic acid were identified as the predominant polyphenols in watercress juice, which demonstrated capacity to inhibit digestive enzymes relevant to type 2 diabetes and obesity[12]. Despite the great potential of these com-pounds in various industrial sectors, the development of more efficient processes for their recovery from watercress and other natural sources remains challenging.
High hydrostatic pressure (HHP) is an emerging technology in-creasingly used in the food industry as a cold pasteurization method [18–21]. It consists on subjecting packaged or in bulk foods to pressures up to 1000 MPa inside a vessel filled with water,fluid that acts as pressure-transmitting medium[18,21]. During processing, the pressure is transmitted in an isostatic and quasi-instantaneous manner throughout the sample, which makes the processing time independent
http://dx.doi.org/10.1016/j.seppur.2017.10.007
Received 7 August 2017; Received in revised form 3 October 2017; Accepted 4 October 2017
⁎Corresponding author.
E-mail address:iferreira@ipb.pt(I.C.F.R. Ferreira).
Abbreviations: Igd, isorhamnetin glycoside derivatives;Kgd, kaempferol glycoside derivatives;P, pressure;Qgd, quercetin glycoside derivatives;S, solvent;T, processing time
Separation and Purification Technology 192 (2018) 501–512
Available online 05 October 2017
1383-5866/ © 2017 Elsevier B.V. All rights reserved.
Table 1
Experimental design (independent variables and their coded and natural values) and values for phenolic compounds (mg/g of extract) and extraction yield (%) achieved under the 20 runs involved in the HHP extraction optimization by RSM.
Five-level CCCD experimental design
Runs 1 2 3 4 5 6 7 8 9 10 11 12 13 14 15 16 17 18 19 20
Coded values X1: Time (t) −1 1 −1 1 −1 1 −1 1 −1.68 1.68 0 0 0 0 0 0 0 0 0 0
X2: Pressure (P) −1 −1 1 1 −1 −1 1 1 0 0 −1.68 1.68 0 0 0 0 0 0 0 0
X3: Solvent (S) −1 −1 −1 −1 1 1 1 1 0 0 0 0 −1.68 1.68 0 0 0 0 0 0
Natural values X1:t(min) 8 27 8 27 8 27 8 27 1.5 33.5 17.5 17.5 17.5 17.5 17.5 17.5 17.5 17.5 17.5 17.5 X2:P(MPa) 122 122 478 478 122 122 478 478 300 300 0.1 600 300 300 300 300 300 300 300 300
X3:S(% of ethanol, v/v) 20 20 20 20 80 80 80 80 50 50 50 50 0 100 50 50 50 50 50 50
Response variables for RSM application
Quercetin-3-O-sophoroside P1 1.30 1.24 0.99 1.06 1.13 1.10 1.21 1.25 1.17 1.16 1.17 1.12 1.01 0.99 1.13 1.13 1.14 1.13 1.13 1.16 Quercetin-3-O-manolylglucoside-7-O-glucoside P3 1.89 1.80 1.18 1.32 1.27 1.14 2.13 1.93 1.59 1.53 1.54 1.51 1.20 1.04 1.44 1.44 1.45 1.45 1.45 1.47 Quercetin-3-O-rutinoside-7-O-glucoside P7 0.00 0.01 0.01 0.01 0.88 0.91 0.93 0.92 0.91 0.90 0.90 0.89 0.88 0.92 0.89 0.90 0.90 0.90 0.91 0.91 Quercetin-3-O-rutinoside (rutin) P10 1.05 1.03 0.99 1.06 1.09 1.11 1.05 1.07 1.11 1.10 1.13 1.15 1.06 0.96 1.19 1.20 1.21 1.20 1.20 1.20 Quercetin-O-sophoroside-O-rutinoside P11 1.00 0.97 0.95 1.03 1.01 1.01 1.11 1.13 1.07 1.05 1.07 1.13 0.91 0.93 1.15 1.15 1.16 1.15 1.15 1.15 Quercetin-O-coumaroylsophoroside P12 1.39 1.33 1.11 1.22 1.03 0.97 1.32 1.30 1.17 1.13 1.19 1.38 1.71 1.00 1.48 1.47 1.46 1.48 1.30 1.51 Quercetin-O-sophoroside-O-malonylhexoside P13 2.14 1.96 1.57 1.99 2.24 1.94 6.09 5.13 2.98 2.74 2.73 3.33 1.39 0.93 3.29 3.15 3.22 3.30 2.82 3.29 Quercetin-O-dihexosyl-O-malonylhexoside P14 0.95 0.89 0.87 0.89 0.92 0.91 1.05 1.01 0.94 0.92 0.93 0.93 0.86 0.00 0.94 0.95 0.95 0.94 0.93 0.99 Quercetin-O-sinapoylhexoside-O-rutinoside P15 1.17 1.13 1.04 1.18 1.19 1.16 1.32 1.35 1.25 1.23 1.24 1.29 0.99 0.99 1.32 1.30 1.32 1.31 1.26 1.30
Total quercetin glycoside derivatives (Qgd) – 10.88 10.36 8.70 9.76 10.77 10.24 16.20 15.09 12.20 11.76 11.90 12.72 10.01 13.76 12.83 12.68 12.79 12.85 12.15 12.96
Isorhamnetin-O-hydroxyferuloylhexoside-O-hexoside P16 1.58 1.53 1.38 1.83 1.73 1.61 2.79 2.72 2.08 1.98 2.06 2.43 1.12 1.05 2.54 2.47 2.51 2.52 2.47 2.54 Isorhamnetin-O-hydroxyferuloylhexoside-O-malonylhexoside P17 2.97 2.89 1.96 3.01 3.60 3.00 9.22 7.88 4.31 3.99 4.01 4.70 1.77 0.98 4.80 4.59 4.78 4.73 4.73 4.73 Isorhamnetin-O-sophoroside-O-malonylhexoside P18 2.31 2.25 1.67 2.49 2.94 2.43 7.35 6.25 3.44 3.13 3.09 3.52 1.47 1.03 3.53 3.47 3.53 3.51 3.51 3.53
Total isorhamnetin glycoside derivatives (Igd) – 6.86 6.67 5.01 7.33 8.27 7.03 19.36 16.85 9.83 9.11 9.15 10.65 4.36 8.06 10.88 10.54 10.82 10.76 10.71 10.81
Kaempferol-O-feruloylhexoside-O-rutinoside P19 1.04 1.00 0.95 1.02 1.03 1.01 1.21 1.20 1.08 1.06 1.07 1.13 0.92 0.96 1.14 1.14 1.14 1.14 1.14 1.14 Kaempferol-O-feruloylhexoside-O-hexoside P20 0.99 0.97 0.93 1.00 0.99 0.98 1.14 1.13 1.05 1.03 1.04 1.10 0.91 0.93 1.11 1.12 1.12 1.11 1.11 1.11 Kaempferol-O-hydroxyferuloylglucuronide-O-malonylhexoside P21 1.27 1.24 1.06 1.26 1.42 1.31 2.24 2.12 1.48 1.43 1.43 1.52 1.03 0.93 1.53 1.51 1.54 1.52 1.51 1.54 Kaempferol-O-feruloylhexoside-O-malonylhexoside P22 1.20 1.21 1.03 1.18 1.27 1.18 1.92 1.81 1.42 1.39 1.33 1.48 0.90 1.10 1.43 1.42 1.43 1.42 1.42 1.43
Total kaempferol glycoside derivatives (Kgd) – 4.51 4.42 3.97 4.46 4.72 4.49 6.51 6.27 5.04 4.91 4.88 5.23 3.76 5.92 5.22 5.19 5.23 5.19 5.18 5.21
Totalflavonoids – 22.3 21.4 17.7 21.6 23.8 21.8 42.1 38.2 27.1 25.8 25.9 28.6 18.1 24.7 28.9 28.4 28.8 28.8 28.0 29.0
p-Coumaric acid hexoside P2 0.00 0.00 0.00 0.00 0.06 0.07 0.03 0.03 0.04 0.04 0.04 0.04 0.02 0.05 0.04 0.05 0.04 0.04 0.04 0.04
Ferulic acid hexoside P4 0.00 0.01 0.01 0.08 0.11 0.11 0.09 0.10 0.09 0.09 0.09 0.09 0.02 0.08 0.18 0.18 0.18 0.18 0.18 0.18 Caffeic acid P5 2.63 2.62 1.39 2.15 2.21 1.91 3.32 3.13 2.68 2.58 2.64 2.44 2.00 2.05 2.56 2.40 2.51 2.51 2.50 2.48
p-Coumaric acid P6 3.91 3.72 2.05 3.40 4.25 4.07 4.82 4.91 4.54 4.38 4.51 4.07 3.06 2.88 4.30 4.11 4.24 4.12 4.16 4.12
Ferulic acid P8 1.07 1.12 0.59 0.96 1.33 1.28 1.80 1.72 1.39 1.28 1.31 1.19 0.95 0.17 1.23 1.18 1.21 1.18 1.17 1.22 Sinapoylmalic acid P9 0.33 0.32 0.16 0.27 0.49 0.43 0.89 0.78 0.51 0.46 0.51 0.45 0.24 0.18 0.43 0.43 0.43 0.44 0.45 0.46
Total phenolic acids – 7.9 7.8 4.2 6.9 8.4 7.9 11.0 10.7 9.2 8.8 9.1 8.3 6.3 10.4 8.7 8.3 8.6 8.5 8.5 8.5
Total phenolic compounds – 30.2 29.2 21.9 28.4 32.2 29.6 53.0 48.9 36.3 34.6 35.0 36.9 24.4 33.2 37.7 36.7 37.5 37.3 36.5 37.5
Extraction yield (crude extract) – 19.4 21.5 27.5 26.8 14.9 16.9 16.1 19.5 23.8 26.2 18.9 21.0 26.0 12.0 22.6 24.2 21.8 24.5 22.1 23.9
et
al.
Se
parat
ion
an
d P
uri
ficat
ion
Te
chn
olo
gy 1
92
(2
01
8) 5
01
–5
12
of the sample shape or size. In addition, the temperature increase with increasing pressure is minimal (∼3 °C/100 MPa)[22,23], thus being a good alternative to heat-based treatments.
HHP has been explored for some time by the food industry. Its ap-plication for extraction of high added-value compounds from plant materials is relatively recent and very promising, but more research focusing on different compounds and plant materials is still needed. The applied pressure promotes the rupture of the plant tissues, cell walls and organelles, a phenomenon that enhances the mass transfer of the solvent into the sample and of compounds to the solvent[24]. In ad-dition, the higher the hydrostatic pressure is, the more solvent can enter cells and the more compounds can permeate out to the solvent[25,26]. Despite the considerable cost of the HHP equipment, processing can become cheaper compared to conventional methods that demand temperature and long processing times[27]. Therefore, the equipment costs could be repaid back in long-term usage.
Previous studies reported that HHP is a good alternative to con-ventional extraction methods since it avoids the degradation of ther-mosensitive molecules, reduces the extraction time and solvent con-sumption, and improves the extraction efficiency in terms of yield, quality and selectivity[24–26,28–30]. Moreover, a low-energy input is required by this eco-friendly technology to compress a sample to 500 MPa as compared to heating to 100 °C[31]. As examples, HHP was successfully applied to extract antioxidant compounds from pome-granate[32]and citrus[33]peels andfig by-products[30],flavonoids from propolis[29], anthocyanins from grape skins[34], catechins[25] and caffeine [35] from green tea leaves, ginsenosides from ginseng (Panax ginsengC.A. Meyer)[36], ferulic acid from RadixAngelica si-nensis [37], and carotenoids from tomato wastes[22]. However, the performance of this extraction method can be affected by a number of independent variables such as processing time, pressure and solvent [30,32], whose effect on one or more dependent (response) variables can be evaluated using the response surface methodology (RSM). This is a time- and reagent-saving statistical tool increasingly used in process optimization since one-factor-at-a-time experiments cannot predict optimal conditions and neglect interactions between variables.
The present study was carried out to optimize the HHP extraction of phenolic compounds from watercress using RSM. The response vari-ables used in the development of mathematical models describing the extraction process (namely individual and grouped phenolic com-pounds) were obtained by high-performance liquid chromatography coupled to mass spectrometry (HPLC-DAD-ESI/MS).
2. Material and methods
2.1. Standards and reagents
HPLC-grade acetonitrile was purchased from Fisher Scientific (Lisbon, Portugal). Formic acid was purchased from Prolabo (VWR International, France). The phenolic compound standards (ferulic, si-napic, p-coumaric and caffeic acids, and kaempferol-3-O-rutinoside, quercetin-3-O-rutinoside, and quercetin-3-O-glucoside) were purchased from Extrasynthese (Genay, France). All other chemicals were of ana-lytical grade and were purchased from common sources. Water was treated in a Milli-Q water purification system (Millipore, model A10, Billerica, MA, USA).
2.2. Plant material
Fresh samples of watercress (Nasturtium officinale R. Br.) were commercially obtained from a local supermarket in Bragança, Portugal. The taxonomic identification of the plant material was confirmed by the botanist Dr. Ana Maria Carvalho from the Polytechnic Institute of Bragança, Portugal. The samples were lyophilized (FreeZone 4.5, Labconco, Kansas City, MO, USA), reduced to a fine powder (∼20 mesh), and kept at−20 °C until processing.
2.3. High hydrostatic pressure extraction
The extractions were carried out on a pilot-scale high-pressure equipment (Model 55, Hyperbaric, Burgos, Spain) with a pressure vessel of 55 L, connected to a refrigeration unit (RMA KH 40 LT, Ferroli, San Bonifacio, Italy) to control the temperature of the input water used as pressure-transmittingfluid. Heat-sealed plastic bags containing 0.6 g of dry powder sample and 20 mL of solvent were placed in the pressure vessel and then subjected to different conditions of processing time (1.5–33.5 min), pressure (0.1–600 MPa) and solvent (0–100% of ethanol, v/v) as defined in the circumscribed central composite design (CCCD) presented inTable 1. Ethanol:water mixtures were used since ethanol has low toxicity and GRAS (generally recognized as safe) status. The solid/liquid ratio was maintained at 30 g/L. All extractions were performed at 20 °C (cold extraction). However, since the pressure in-creases the temperature by ∼3 °C/100 MPa [22,23], processing at 600 MPa resulted in an adiabatic temperature increase from 20 °C to ∼38 °C, which should still be not enough to promote the thermal de-gradation of bioactive compounds. After HHP processing, the mixture wasfiltered throughfilter paper (Whatman No. 4) and thefiltrate was collected and kept at−80 °C until analysis.
2.4. Calculation of the extraction yield
The extraction yields (%) were calculated based on the dry weight (crude extract) obtained after evaporation of the solvent. First, thefi l-trates were concentrated at 35 °C under reduced pressure (rotary eva-porator Büchi R-210, Flawil, Switzerland) and the aqueous phase was then lyophilised to obtain a dried extract.
2.5. Chromatographic analysis of phenolic compounds
The dried extracts (∼10 mg) were dissolved in a methanol:water mixture (20:80 v/v) andfiltered through 0.22 µm disposable LCfilter disks. The chromatographic analysis was performed in a Dionex Ultimate 3000 UPLC (Thermo Scientific, San Jose, CA, USA) system equipped with a diode array detector (DAD) coupled to an electrospray ionization mass detector (ESI-MS) (ThermoFinnigan, San Jose, CA, USA) as described by Bessada et al.[38]. The phenolic compounds were identified using 280 nm and 370 nm as preferred wavelengths and by comparing their retention time and UV–vis and mass spectra with those obtained from authentic standards, when available. For quantitative analysis, a baseline to valley integration with baseline projection mode was used to calculate the peak areas and the external standards men-tioned above were used for quantification. The results were expressed in mg per g of extract.
2.6. Experimental design, modelling and optimization
2.6.1. Experimental design
A five-level CCCD (Box-Behnken design) coupled with RSM was implemented to optimize the HHP conditions for the extraction of phenolic compounds from watercress. The coded and natural values of the independent variables X1(processing time (t), min), X2(pressure (P), MPa) and X3 (solvent (S), % of ethanol, v/v) are presented in Table 1. This CCCD includes 6 replicated center points and a group of axial points chosen to allow rotatability, which ensures that the var-iance of the model prediction is constant at all points equidistant from the design center. The experimental runs were randomized to minimize the effects of unexpected variability in the observed responses.
2.6.2. Mathematical modelling
The response surface models werefitted by means of least-squares calculation using the following Box-Behnken design equation:
J. Pinela et al. Separation and Purification Technology 192 (2018) 501–512
∑
∑ ∑
∑
= + +
= >
+ =
−
= =
Y b b X i
j i
b X X b X 1
i n
i i n
j n
ij i j i
n
ii i 0
1
1
2 1
2
(1) In this equation, Y represents the dependent variable (response variable) to be modelled,XiandXjare the independent variables,b0is the constant coefficient,biis the coefficient of linear effect,bijis the coefficient of interaction effect,biiis the coefficient of quadratic effect, andnis the number of variables. The extraction yield and the individual and grouped phenolic compounds (22 compounds and 6 groups) were used as dependent variables.
2.6.3. Procedure to optimize the variables to a maximum response A simplex method was used to optimize the predictive model by solving nonlinear problems in order to maximize the extraction yield and the recovery of phenolic compounds[5]. Certain limitations were imposed (i.e., times lower than 0) to avoid variables with unnatural and unrealistic physical conditions.
2.7. Cluster analyses
A cluster analysis was performed to group the phenolic compounds according to the extraction conditions that maximize their response values using the “XLSTAT 2016”, a Microsoft Excel add-in. A com-parative agglomerative hierarchical clustering analysis (HCA) with Pearson correlation coefficient was used for clustering (similarity ana-lysis). The algorithm used was a complete linkage with automatic truncation based on entropy.
2.8. Fitting procedures and statistical analysis
Fitting procedures, coefficient estimates and statistical calculations were performed as previously described by Pinela et al.[5]. In brief, a) the coefficient measurement was performed using the nonlinear least-square (quasi-Newton) method provided by the macro“Solver”in Mi-crosoft Excel, which allows minimizing the sum of the quadratic dif-ferences between the observed and model-predicted values; b) the coefficient significance was evaluated using the ‘SolverAid’ to de-termine the parametric confidence intervals. The not statistically sig-nificant terms (p-value > 0.05) were dropped to simplify the model; and c) the model reliability was verified using the following criteria: i)
the FisherF-test (α= 0.05) was used to determine whether the
con-structed models were adequate to describe the observed data; ii) the
‘SolverStat’macro was used for the assessment of parameter and model prediction uncertainties; iii) the R2was interpreted as the proportion of variability of the dependent variable explained by the model.
3. Results and discussion
3.1. Response criteria for the RSM analysis
The experimental values achieved for the 20 experimental runs of the CCCD design are presented inTable 1. The HPLC phenolic profile (recorded at 370 nm) of the watercress extract obtained under the ex-perimental run No. 20 is shown inFig. 1(see HHP extraction conditions inTable 1). This profile is concordant with that previously character-ized by Pinela et al.[14]for wild watercress. Up to twenty-two com-pounds were identified (Table 1) based on their chromatographic, UV–vis and mass spectra characteristics, six of which were phenolic acid derivatives (hydroxycinnamic acids) and sixteen wereflavonoid glycoside derivatives. Many of these compounds were also reported by other authors in this species [12,39,40]. Isorhamnetin-O -hydro-xyferuloylhexoside-O-malonylhexoside,p-coumaric acid, isorhamnetin-O-sophoroside-O-malonylhexoside, quercetin-O-sophoroside-O -mal-onylhexoside and caffeic acid were identified as the most abundant compounds. Flavonoids predominated over phenolic acids and, in general, more quercetin and isorhamnetin glycoside derivatives were quantified than phenolic acids.
For optimization purposes, the phenolic compounds quantified by chromatographic methods (Table 1) were grouped in total phenolic acids (compounds 2, 4, 5, 6, 8 and 9), totalflavonoids, comprising the subgroups of quercetin glycoside derivatives (Qgd: compounds 1, 3, 7, 10, 11, 12, 13, 14 and 15), isorhamnetin glycoside derivatives (Igd: compounds 16, 17 and 18) and kaempferol glycoside derivatives (Kgd: compounds 19, 20, 21 and 22), and total phenolic compounds (in-cluding all quantified phenolics). The individual and grouped com-pounds were used as response criteria to optimize the HHP conditions for their extraction from watercress using RSM. The values of the ex-traction yield were also considered, which ranged from 12 to 27.5% with the experimental runs n° 14 and 3, respectively (Table 1). There-fore, a total of 29 response variables were computed and used as op-timization criteria.
2 4 6 8 10 12 14 16 18 20 22 24 26 28 30
Time (min) 0
50000 100000 150000 200000 250000 300000 350000 400000
mA
U
3
1
5
8
6
10
9 11
12 13
14 15
16 17
18
19 20 21 22
7 4
2
Table 2
Fitting coefficients and R2determined for the models obtained for individual and grouped phenolic compounds and extraction yield (Table 3), and optimal HHP conditions and response values.
Response variables Fitting coefficients obtained after applying the Box-Behnken design equation
Intercept Linear effect Quadratic effect
b0 b1(t) b2(P) b3(S) b11(t2) b22(P2) b33(S2)
Compound P1 1.14 ± 0.01 ns −0.02 ± 0.01 ns 0.02 ± 0.01 0.02 ± 0.01 −0.04 ± 0.01
Compound P3 1.51 ± 0.05 −0.03 ± 0.00 ns ns ns 0.06 ± 0.04 −0.09 ± 0.04
Compound P7 0.90 ± 0.07 ns 0.02 ± 0.01 0.02 ± 0.01 ns ns ns
Compound P10 1.20 ± 0.01 ns ns ns −0.04 ± 0.01 −0.03 ± 0.01 −0.07 ± 0.01
Compound P11 1.15 ± 0.01 ns 0.02 ± 0.01 0.03 ± 0.01 −0.03 ± 0.01 −0.02 ± 0.01 −0.08 ± 0.01
Compound P12 1.45 ± 0.04 ns 0.04 ± 0.03 −0.12 ± 0.03 −0.12 ± 0.03 −0.07 ± 0.03 −0.04 ± 0.03
Compound P13 3.00 ± 0.10 −0.12 ± 0.12 0.57 ± 0.12 0.95 ± 0.13 ns ns ns
Compound P14 0.94 ± 0.01 −0.01 ± 0.01 0.01 ± 0.01 0.04 ± 0.01 ns −0.01 ± 0.01 ns
Compound P15 1.29 ± 0.02 ns 0.02 ± 0.01 0.04 ± 0.01 −0.01 ± 0.01 ns −0.10 ± 0.01
Total Qgd 12.52 ± 0.26 ns 0.65 ± 0.19 1.39 ± 0.23 −0.35 ± 0.03 ns −0.37 ± 0.24
Compound P16 2.51 ± 0.09 ns 0.21 ± 0.06 0.18 ± 0.06 −0.14 ± 0.06 −0.06 ± 0.06 −0.47 ± 0.06
Compound P17 4.46 ± 0.16 −0.16 ± 0.13 0.85 ± 0.19 1.53 ± 0.21 ns ns ns
Compound P18 3.44 ± 0.14 ns 0.63 ± 0.15 1.28 ± 0.20 ns ns ns
Total Igd 10.74 ± 0.27 −0.15 ± 0.03 1.72 ± 0.27 1.62 ± 0.27 ns ns −1.84 ± 0.27
Compound P19 1.13 ± 0.01 ns 0.03 ± 0.01 0.04 ± 0.01 −0.02 ± 0.01 ns −0.07 ± 0.01
Compound P20 1.11 ± 0.01 ns 0.03 ± 0.01 0.03 ± 0.01 −0.02 ± 0.01 −0.01 ± 0.01 −0.07 ± 0.01
Compound P21 1.50 ± 0.02 ns 0.12 ± 0.03 0.28 ± 0.03 ns ns ns
Compound P22 1.44 ± 0.03 ns 0.10 ± 0.03 0.14 ± 0.03 ns ns −0.13 ± 0.03
Total Kgd 5.20 ± 0.03 ns 0.27 ± 0.03 0.58 ± 0.03 −0.08 ± 0.01 −0.05 ± 0.03 −0.16 ± 0.03
Totalflavonoids 28.68 ± 0.84 ns 2.55 ± 0.51 5.23 ± 0.63 −0.91 ± 0.52 −0.61 ± 0.52 −0.85 ± 0.65
Compound P2 0.04 ± 0.01 ns −0.01 ± 0.00 0.02 ± 0.00 0.02 ± 0.01 ns −0.01 ± 0.01
Compound P4 0.18 ± 0.01 0.01 ± 0.00 ns 0.03 ± 0.00 −0.03 ± 0.01 −0.04 ± 0.01 −0.05 ± 0.00
Compound P5 2.54 ± 0.05 ns ns 0.13 ± 0.05 ns ns −0.15 ± 0.05
Compound P6 4.19 ± 0.07 ns −0.11 ± 0.07 0.55 ± 0.07 ns ns −0.19 ± 0.07
Compound P8 1.20 ± 0.03 ns ns 0.28 ± 0.02 0.03 ± 0.02 ns 0.04 ± 0.02
Compound P9 0.45 ± 0.02 ns 0.04 ± 0.02 0.17 ± 0.02 ns ns 0.03 ± 0.01
Total phenolic acids 8.56 ± 0.16 ns ns 1.27 ± 0.17 ns ns −0.26 ± 0.18
Total phenolic compounds
37.23 ± 1.02 ns 2.49 ± 0.62 6.49 ± 0.76 −0.85 ± 0.13 −0.66 ± 0.63 −1.11 ± 0.80
Extraction yield 23.90 ± 0.62 0.79 ± 0.49 1.52 ± 0.49 −4.00 ± 0.49 ns −0.97 ± 0.47 −3.45 ± 0.47
Response variables Fitting coefficients obtained after applying the Box-Behnken design equation Optimal processing conditions and response values
Interactive effect R2 t(min) P(MPa) S(%) Optimum
b12(tP) b13(tS) b23(PS)
Compound P1 0.03 ± 0.01 ns 0.09 ± 0.01 0.8649 1.5 ± 0.1 0.0 ± 6.7 0.0 ± 9.7 1.50 ± 0.52
Compound P3 ns −0.05 ± 0.05 0.36 ± 0.05 0.8073 1.5 ± 0.1 600.0 ± 3.0 100.0 ± 5.1 2.61 ± 0.87
Compound P7 −0.02 ± 0.01 0.02 ± 0.01 0.02 ± 0.01 0.9093 1.5 ± 0.1 600.0 ± 1.5 100.0 ± 0.2 0.98 ± 0.32
Compound P10 ns ns ns 0.8310 17.5 ± 0.3 300.0 ± 4.5 50.0 ± 0.7 1.20 ± 0.17
Compound P11 0.02 ± 0.01 ns 0.03 ± 0.01 0.9490 21.1 ± 0.2 521.4 ± 4.8 61.4 ± 0.6 1.17 ± 0.39
Compound P12 ns ns 0.12 ± 0.04 0.7933 17.5 ± 0.8 75.3 ± 3.3 0.0 ± 0.0 1.64 ± 0.55
Compound P13 ns ns 0.91 ± 0.16 0.8956 1.5 ± 0.2 600.0 ± 6.3 100.0 ± 10.4 8.31 ± 2.35
Compound P14 ns ns 0.04 ± 0.01 0.8187 1.5 ± 0.1 600.0 ± 3.8 100.0 ± 0.6 1.13 ± 0.58
Compound P15 0.03 ± 0.02 ns 0.05 ± 0.02 0.8682 33.5 ± 0.6 600.0 ± 9.1 67.3 ± 1.1 1.41 ± 0.51
Total Qgd ns ns 1.63 ± 0.24 0.8993 17.5 ± 0.9 600.0 ± 13.4 100.0 ± 5.6 19.53 ± 2.18
Compound P16 ns ns 0.26 ± 0.08 0.8736 17.5 ± 1.7 600.0 ± 5.7 69.3 ± 6.5 2.88 ± 0.73
Compound P17 ns ns 1.26 ± 0.24 0.8952 1.5 ± 0.3 600.0 ± 9.8 100.0 ± 6.4 12.30 ± 2.86
Compound P18 ns −0.30 ± 0.20 1.08 ± 0.20 0.9031 1.5 ± 0.2 600.0 ± 8.6 100.0 ± 4.3 10.54 ± 2.65
Total Igd ns −0.82 ± 0.14 2.24 ± 0.27 0.8926 1.5 ± 0.1 600.0 ± 11.8 97.1 ± 24.3 16.89 ± 2.26
J.
Pinela
et
al.
Se
parat
ion
an
d P
uri
ficat
ion
Te
chn
olo
gy 1
92
(2
01
8) 5
01
–5
12
3.2. Theoretical response surface models
As in many research fields, when trying to develop theoretical models to predict and comprehend the effects of independent variables on certain response variables, it is necessary to evaluate its precision by
fitting these models to the experimental values. In this study, the re-sponse values (Table 1) werefitted to a second-order polynomial model using a nonlinear algorithm (least-squares estimations) to develop mathematical models for each response criteria (Table 2). Table 3 shows the estimated coefficient values obtained from the polynomial model of Eq.(1)and the coefficient of correlation (R2) for each para-metric response of the extraction process. These parapara-metric values translate the response patterns and show the complexity of the possible interactions between variables. However, not all the parameters of Eq. (1)were used for building the model since some coefficients were non-significant (ns). The significant ones were assessed at a 95% confidence level (α= 0.05). The statistic lack offit, used to test the adequacy of
the obtained models, demonstrated that no considerable improvement was achieved by the inclusion of the statisticallynsparametric values. The resulting models for each of the 29 assessed responses are pre-sented inTable 2. In all cases, R2coefficients higher than 0.79 were obtained (Table 3), which indicates that the percentage of variability of each response can be explained by the model. These workable models were applied in the subsequent prediction and optimization steps, showing a good agreement between the experimental and predicted values, which indicates that the variation is explained by the in-dependent variables.
The obtained model coefficients (Table 3) are empirical and cannot be associated with physical or chemical significance. However, they are useful for predicting the results of untested extraction conditions[41]. The sign of the effect marks the performance of the response. In this way, when a factor has a positive effect, the response is higher at the high level, and when a factor has a negative effect, the response is lower at the high level. The higher the absolute value of a coefficient, the more important the weight of the corresponding variable. Based on the mathematical expressions (Table 2), no associations were found be-tween the response variables of phenolic acids, flavonoids, quercetin glycoside derivatives (Qgd), isorhamnetin glycoside derivatives (Igd) and kaempferol glycoside derivatives (Kgd). However, certain features regarding the general effects of the variables are displayed. The re-levance of the significant parametric values can be order as a function of the variables involved in a decreasing form asS>P≫t. Alexandre et al.[32]also foundSas the most relevant variable on the HHP ex-traction of bioactive compounds from pomegranate (Punica granatum L.) peels. Regarding the linear, quadratic, and interactive parametric effects of the developed equations, it was found that they play an im-portant and significant role in all evaluated responses. For the linear effect, the variablesPandShad strong values; meanwhile, the effect of t was negligible in almost all cases. All independent variables had moderate quadratic or nonlinear effects. Regarding the interactive ef-fects, the interactions of the variabletwith the other variables (tPand tS) were of minor relevance; meanwhile, thePSinteraction had a strong significance in describing the behavior of almost all responses (with the exception of compound 10). The interactive parametric values of PS were accentuated in the responses of flavonoids, Qgd, Igd, phenolic acids, and total phenolic compounds. To make the combined effects more explicit and to visually describe the extraction trends, the results were presented in the response surface plots discussed below.
3.3. Effect of the independent variables on the target responses and optimal extraction conditions
Although parametric results can depict the patterns of the re-sponses, 3D and 2D graphical representations may aid on their com-prehension.Fig. 2shows the response surface plots of extraction yield and grouped phenolic compounds (total phenolic acids, totalflavonoids
and total phenolic compounds) as well as their statistical analysis.Fig. 3 illustrates in a similar way the results forQgd,IgsandKgd. BothFigs. 2 and 3are divided in three subsections: i) the subsection A illustrates the 3D response surface plots, whose grid surfaces were predicted with the respective second-order polynomial model described by Eq.(1)using the theoretical values presented inTable 3. For representation of these binary combinations, the excluded variable was positioned at the op-timum of their experimental domain (Table 3); ii) the subsection B il-lustrates the goodness offit through two graphical statistical criteria, namely the ability to simulate response changes between observed and predicted values and the residual distribution as a function of each variable; and iii) the subsection C shows the individual 2D responses and the optimum values (⊙). In each plot, each independent variable was positioned at the optimal value of the other two variables.
Observing the response surface plots of the extraction yield (Fig. 2), it is possible to verify that the amount of extracted material increases to an optimum value and then, in most cases, it decreases as a function of the involved independent variable. Consequently, the optimum value can be found as being a single point in almost all combinations, which allows computing the extraction conditions that lead to an absolute maximum. Fig. 2C simplifies the interpretation of the effects of the independent variables on the extraction process and highlights the optimum value of each variable. The extraction yield was maximal (27.82 ± 2.26%) when the optimal HHP conditions (t= 33.5 min, P= 530.6 MPa andS= 26.1% of ethanol, v/v) presented inTable 3 were applied for extraction. Zhang et al.[42]have shown that the crude extract obtained from Rhodiola sachalinensis is greater when HHP is used than when the extraction is done by the conventional methods of reflux or Soxhlet. High extraction yields were also achieved by Prasad et al. [26] when processing longan fruit (Dimpcarpus longan Lour.) pericarps under pressures up to 500 MPa and using lower extraction times than those required in a conventional extraction.
The response surface plots of grouped phenolic acids andflavonoids and total phenolic compounds are showed inFig. 2and the optimal
HHP conditions that maximize their recovery from watercress are presented inTable 3. These responses were similarly affected by the screened variables; they were favoured by high values ofPandSand short values oftas summarized below:
–For phenolic acids, the optimal HHP conditions were: t= 1.5 ± 0.3 min,P= 600.0 ± 5.0 MPa and S= 100.0 ± 8.6% of ethanol (v/v), and originated 13.58 ± 1.99 mg/g of extract.
–For flavonoids, the optimal HHP conditions were: t= 7.8 ± 0.5 min,P= 600.0 ± 5.0 MPa and S= 100.0 ± 8.6% of ethanol (v/v), and originated 52.45 ± 2.63 mg/g of extract.
–For total phenolic compounds, the optimal HHP conditions were: t= 3.1 ± 3.2 min,P= 600.0 ± 6.3 MPa andS= 100.0 ± 2.2 of ethanol (v/v), and originated 64.68 ± 2.97 mg/g of extract. The optimum extraction values for theflavonoid derivativesQgd,Igs andKgdwere achieved using very similar HHP conditions (Fig. 3and Table 3), probably due to structural similarities between these com-pounds. Once more, the extraction was favoured by high values ofPand Sand short values oft, as summarized below:
–ForQgd, the optimal HHP conditions were: t= 17.5 ± 1.0 min, P= 600.0 ± 13.4 MPa and 100.0 ± 5.6% of ethanol (v/v), and originated 19.53 ± 2.18 mg/g of extract.
–For Igd, the optimal HHP conditions were: t= 1.5 ± 0.1 min, P= 600.0 ± 11.8 MPa and 97.1 ± 24.3% of ethanol, and origi-nated 16.89 ± 2.26 mg/g of extract.
–ForQgd, the optimal HHP conditions were: t= 13.7 ± 0.4 min, P= 600.0 ± 16.4 MPa and S= 100.0 ± 2.7% of ethanol (v/v), and originated 7.49 ± 0.88 mg/g of extract.
According to the literature, the use of high pressures increases the extraction of bioactive compounds from plants matrices[30]. Briones-Labarca et al. [28] demonstrated that HHP is more effective than Table 3
Mathematical models of the extraction process derived from the second-order polynomial model with interactions of Eq.(1).
Quercetin-3-O-sophoroside YP1=1.14 0.02− P+0.02t2+0.02P2−0.04S2+0.09tP+0.09PS Eq. (2)
Quercetin-3-O-manolylglucoside-7-O-glucoside YP3=1.51 0.03− t+0.06P2−0.09S2−0.05tS+0.36PS Eq. (3)
Quercetin-3-O-rutinoside-7-O-glucoside YP7=0.90+0.02P+0.02S2−0.02tP+0.02tS+0.02PS Eq. (4)
Quercetin-3-O-rutinoside (rutin) YP10=1.20 0.04− t2−0.03P2−0.07S2 Eq. (5)
Quercetin-O-sophoroside-O-rutinoside YP11=1.15+0.02P+0.03S−0.03t2−0.23P2−0.02S2−0.08tP+0.02tS Eq. (6)
Quercetin-O-coumaroylsophoroside YP12=1.45+0.04P−0.12S−0.12t2−0.07P2−0.04S2+0.12PS Eq. (7)
Quercetin-O-sophoroside-O-malonylhexoside YP13=3.00 0.12− t+0.57P+0.95S Eq. (8)
Quercetin-O-dihexosyl-O-malonylhexoside YP14=0.94 0.01− t+0.01P+0.04S−0.01P2+0.04PS Eq. (9)
Quercetin-O-sinapoylhexoside-O-rutinoside YP15=1.29+0.02P+0.04S−0.01t2−0.10S2−0.03tP+0.05PS Eq. (10) Total quercetin glycoside derivatives (Qgd) YQgd=12.52+0.65P+1.39S−0.35t2−0.37S2+1.63PS Eq. (11)
Isorhamnetin-O-hydroxyferuloylhexoside-O-hexoside YP16=2.51+0.21P+0.18S−0.14t2−0.06P2−0.47S2+0.26PS Eq. (12)
Isorhamnetin-O-hydroxyferuloylhexoside-O-malonylhexoside YP17=4.46 0.16− t+0.85P+1.53S+1.26PS Eq. (13)
Isorhamnetin-O-sophoroside-O-malonylhexoside YP18=3.44+0.63P+1.28S−0.30tS+1.08PS Eq. (14)
Total isorhamnetin glycoside derivatives (Igd) YIgd=10.74 0.15− t+1.72P+1.62S−1.84S2−0.82tS+2.24PS Eq. (15)
Kaempferol-O-feruloylhexoside-O-rutinoside YP19=1.13+0.03P+0.04S−0.02t2−0.07S2+0.02tP+0.05PS Eq. (16)
Kaempferol-O-feruloylhexoside-O-hexoside YP20=1.11+0.03P+0.03S−0.02t2−0.01P2−0.07S2+0.02tP+0.04PS Eq. (17)
Kaempferol-O-hydroxyferuloylglucuronide-O-malonylhexoside YP21=1.50+0.12P+0.28S−0.05tS+0.23PS Eq. (18)
Kaempferol-O-feruloylhexoside-O-malonylhexoside YP22=1.44+0.10P+0.14S−0.13S2−0.04tS+0.19PS Eq. (19)
Total kaempferol glycoside derivatives (Kgd) YKgd=5.20+0.27P+0.58S−0.08t2−0.05P2−0.16S2+0.07tP−0.11tS+0.51PS Eq. (20)
Totalflavonoids YFl=28.68+2.55P+5.23S−0.91t2−0.61P2−0.85S2−1.11tS+4.90PS Eq. (21) p-Coumaric acid hexoside YP2=0.04 0.01− P+0.02S+0.02t2−0.01S2−0.02PS Eq. (22)
Ferulic acid hexoside YP4=0.18+0.01t+0.03S−0.03t2−0.04P2−0.05S2+0.02tP−0.01tS−0.01PS Eq. (23)
Caffeic acid YP5=2.54+0.13S−015S2+0.08tP−0.12tS+0.47PS Eq. (24) p-Coumaric acid YP6=4.19 0.11− P+0.55S−0.19S2+0.23tP−0.16tS+0.45PS Eq. (25)
Ferulic acid YP8=1.20+0.28S−0.03t2−0.04S2−0.03tP−0.07tS+0.19PS Eq. (26)
Sinapoylmalic acid YP9=0.45+0.04P+0.17S−0.03S2−0.01tS+0.10PS Eq. (27)
Total phenolic acids YPa=8.56+1.27S−0.26S2+0.39tP−0.42tS+1.25PS Eq. (28)
Total phenolic compounds YPh=37.23+2.49P+6.49S−0.85t2−0.66P2−1.11S2−1.53tS+6.15PS Eq. (29)
Extraction yield (crude extract) YEY=23.90+0.79t+1.52P−4.01S−0.97P2−3.45S2+1.21PS Eq. (30)
J. Pinela et al. Separation and Purification Technology 192 (2018) 501–512
ultrasound-assisted extraction or conventional extraction (2 h) to re-cover antioxidants and total phenolic compounds from Chilean papaya (Vasconcellea pubescens) seeds. In addition, HHP was a time-saving ex-traction method. The lower energy consumption is another advantage of HHP comparatively to conventional methods[35]. In our study, it is also interesting to note that the HHP conditions that maximize the yield
of crude extract and the recovery of phenolic compounds differ mostly in the required processing time and ethanol concentration. In this way, the extracts obtained under the optimal conditions established for phenolic compounds (Table 3) will contain a lower quantity of com-pounds other than phenolics, thus making the recovery process more selective for the target compounds.
The effects of the independent variables on the extraction of in-dividual phenolic compounds from watercress are 2D represented in Fig. 4. The processing conditions that generated optimal response va-lues (⊙) are numerically described inTable 3. The identifiedflavonoids were organized as a function of the maximum amount achieved (mg/g of extract) in a decreasing order as follows: P17 (12.3 ± 2.86) > P18 (10.54 ± 2.65) > P13 (8.31 ± 2.35)≫P21 (2.95 ± 1.40) > P16 (2.88 ± 0.73) > P3 (2.61 ± 0.87) > P22 (2.11 ± 0.79) > P12 (1.64 ± 0.55) > P1 (1.5 ± 0.52) > P15 (1.41 ± 0.51) > P19 (1.26 ± 0.48) > P10 (1.2 ± 0.17) > P11 (1.17 ± 0.39) > P20 (1.16 ± 0.39) > P14 (1.13 ± 0.58) > P7 (0.98 ± 0.32). Mean-while, the phenolic acids were organized as follows: P6 (5.02 ± 0.96) > P5 (3.79 ± 0.60)≫P8 (2.51 ± 0.68) > P9 (1.21 ± 0.60) > P4 (0.19 ± 0.14) > P2 (0.06 ± 0.08). Pinela et al.
[14]reported lower quantities of phenolic acids (5.6 ± 0.5 mg/g of extract),flavonoids (22 ± 1 mg/g of extract) and total phenolic com-pounds (28 ± 2 mg/g of extract) in an extract of wild watercress ob-tained by a conventional solid-liquid extraction of 2 h and using a methanol:water mixture (80:20, v/v) as a extraction solvent. These differences highlight the suitability of HHP as an innovative extraction technique to recover a greater amount of phenolic compounds from watercress using shorter processing times and greener solvents.
3.4. Clustering of phenolic compounds according to the HHP conditions that maximize their extraction
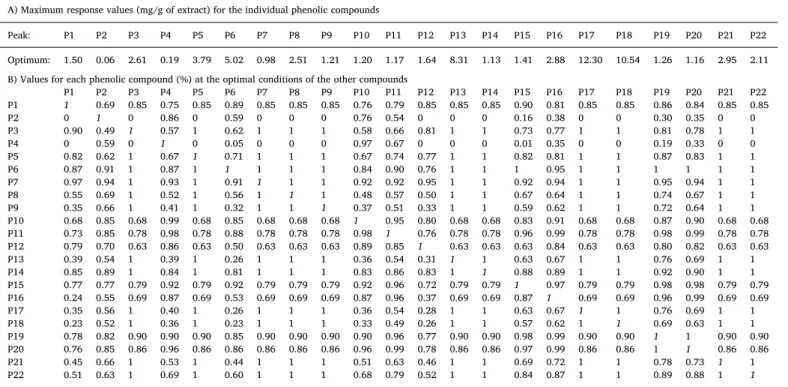
Table 4 shows the maximum response values of each phenolic compound and their values if extracted under the optimal HHP Fig. 3.Response surface plots of theflavonoid subgroups of quercetin, isorhamnetin and kaempferol glycoside derivatives. Part A: 3D analysis as a function of each independent variable. The grid surfaces were built using the theoretical values (Table 3) predicted with Eq.(1). For representation purposes, the excluded variable was positioned at the optimum of their experimental domain (Table 3). Part B: illustration of the goodness offit through two graphical statistical criteria, namely the ability to simulate response changes between observed and predicted values and the residual distribution as a function of each variable. Part C: individual 2D responses and optimum values (⊙). Each independent variable was positioned at the optimal value of the other two variables.
J. Pinela et al. Separation and Purification Technology 192 (2018) 501–512
conditions of the other compounds (Table 3). These values presented in part B were calculated dividing the optimum value of each compound by the maximum of the others compounds. Therefore, when two com-pounds display the value 1 (corresponding to values of 100%), the
conditions that maximize the extraction of a certain compound (com-pounds 1, 3, 0, 7, 8, 9, 12, 13, 14, 17, 18, 21 and 22) do not favour at all the extraction of the other one (compounds 2 and 4).
Using the complete dataset ofTable 4and performing a multi-objec-tive optimization problem using an appropriate clustering algorithm, dif-ferent clusters of phenolic compounds whose maximum response values are obtained under similar HHP extraction conditions were created. The results of HCA are presented inFig. 5. In the HCA dendrogram, the shorter distance between compounds indicates a higher similarity in terms of conditions that favour their extraction and the compounds clustered into the same group are better extracted under similar HHP conditions. Three significant clusters (C1, C2 and C3) were generated. C1 and C3 were also be divided in two (a and b) pertinent subgroups. Additionally, other less relevant subgroups were created in C2, C1b and C3b, but they can be considered as a residual noise produced by the algorithm.
–Cluster C1 included the compounds 15, 16, 11 and 10. Meanwhile, compound 15 was subdivided in C1a and compounds 16, 11 and 10
were grouped in C1b. The extraction of these compounds was maximized by mediumt, highPand mediumS(Table 3andFig. 3). The subgroups C1a and C1b were mainly differentiated by the t values.
–Cluster C2 included the compounds 4, 20 and 19. No significant subgroups were created. The extraction of these compounds was favoured by mediumt, highPand medium-largeSvalues.
–Cluster C3 included the compounds 22, 21, 18, 17, 14, 13, 9, 8, 7, 3, 5, 12, 6, 1 and 2, which were subdivided in C3a e C3b. The ex-traction of the compounds in C3a was maximized when using lowt, highPand highS. On the other hand, the compounds in C3b ex-hibited a broad set of conditions with no clear interconnections between each other.
Although it was expected that compounds with similar chemical characteristics would exhibit comparable optimal extraction conditions, no clear similarity was detected between the created groups of com-pounds and the conditions that maximize their extraction. However, this HCA analysis was an interesting and innovative approach in the
field of extraction of high added-value compound from natural sources (something not seen in this type of studies), since it allowed grouping the phenolic compounds into different clusters according to the HHP conditions that favour their recovery from watercress, which can be very useful from a practical point of view.
4. Conclusions
As far as we know, this is thefirst study regarding the optimization of the extraction of phenolic compounds from watercress by HHP using RSM, a suitable statistical tool that allowed reduce the number of ex-perimental trials and evaluate interactions among variables. The suit-ability of this cold extraction method (combining the independent variablest,PandSin afive-level CCCD design) was demonstrated. The developed polynomial response models were statistically validated and expressed as 2D and 3D surface plots to better visualize the effects on extraction yield and individual and grouped phenolic compounds (a total of 29 response variables). A good agreement between Table 4
Maximum response values for each phenolic compound and their values at the optimal processing conditions of the other compounds presented inTable 2.
A) Maximum response values (mg/g of extract) for the individual phenolic compounds
Peak: P1 P2 P3 P4 P5 P6 P7 P8 P9 P10 P11 P12 P13 P14 P15 P16 P17 P18 P19 P20 P21 P22
Optimum: 1.50 0.06 2.61 0.19 3.79 5.02 0.98 2.51 1.21 1.20 1.17 1.64 8.31 1.13 1.41 2.88 12.30 10.54 1.26 1.16 2.95 2.11 B) Values for each phenolic compound (%) at the optimal conditions of the other compounds
P1 P2 P3 P4 P5 P6 P7 P8 P9 P10 P11 P12 P13 P14 P15 P16 P17 P18 P19 P20 P21 P22 P1 1 0.69 0.85 0.75 0.85 0.89 0.85 0.85 0.85 0.76 0.79 0.85 0.85 0.85 0.90 0.81 0.85 0.85 0.86 0.84 0.85 0.85
P2 0 1 0 0.86 0 0.59 0 0 0 0.76 0.54 0 0 0 0.16 0.38 0 0 0.30 0.35 0 0
P3 0.90 0.49 1 0.57 1 0.62 1 1 1 0.58 0.66 0.81 1 1 0.73 0.77 1 1 0.81 0.78 1 1
P4 0 0.59 0 1 0 0.05 0 0 0 0.97 0.67 0 0 0 0.01 0.35 0 0 0.19 0.33 0 0
P5 0.82 0.62 1 0.67 1 0.71 1 1 1 0.67 0.74 0.77 1 1 0.82 0.81 1 1 0.87 0.83 1 1
P6 0.87 0.91 1 0.87 1 1 1 1 1 0.84 0.90 0.76 1 1 1 0.95 1 1 1 1 1 1
P7 0.97 0.94 1 0.93 1 0.91 1 1 1 0.92 0.92 0.95 1 1 0.92 0.94 1 1 0.95 0.94 1 1 P8 0.55 0.69 1 0.52 1 0.56 1 1 1 0.48 0.57 0.50 1 1 0.67 0.64 1 1 0.74 0.67 1 1 P9 0.35 0.66 1 0.41 1 0.32 1 1 1 0.37 0.51 0.33 1 1 0.59 0.62 1 1 0.72 0.64 1 1 P10 0.68 0.85 0.68 0.99 0.68 0.85 0.68 0.68 0.68 1 0.95 0.80 0.68 0.68 0.83 0.91 0.68 0.68 0.87 0.90 0.68 0.68 P11 0.73 0.85 0.78 0.98 0.78 0.88 0.78 0.78 0.78 0.98 1 0.76 0.78 0.78 0.96 0.99 0.78 0.78 0.98 0.99 0.78 0.78 P12 0.79 0.70 0.63 0.86 0.63 0.50 0.63 0.63 0.63 0.89 0.85 1 0.63 0.63 0.63 0.84 0.63 0.63 0.80 0.82 0.63 0.63 P13 0.39 0.54 1 0.39 1 0.26 1 1 1 0.36 0.54 0.31 1 1 0.63 0.67 1 1 0.76 0.69 1 1 P14 0.85 0.89 1 0.84 1 0.81 1 1 1 0.83 0.86 0.83 1 1 0.88 0.89 1 1 0.92 0.90 1 1 P15 0.77 0.77 0.79 0.92 0.79 0.92 0.79 0.79 0.79 0.92 0.96 0.72 0.79 0.79 1 0.97 0.79 0.79 0.98 0.98 0.79 0.79 P16 0.24 0.55 0.69 0.87 0.69 0.53 0.69 0.69 0.69 0.87 0.96 0.37 0.69 0.69 0.87 1 0.69 0.69 0.96 0.99 0.69 0.69 P17 0.35 0.56 1 0.40 1 0.26 1 1 1 0.36 0.54 0.28 1 1 0.63 0.67 1 1 0.76 0.69 1 1 P18 0.23 0.52 1 0.36 1 0.23 1 1 1 0.33 0.49 0.26 1 1 0.57 0.62 1 1 0.69 0.63 1 1 P19 0.78 0.82 0.90 0.90 0.90 0.85 0.90 0.90 0.90 0.90 0.96 0.77 0.90 0.90 0.98 0.99 0.90 0.90 1 1 0.90 0.90 P20 0.76 0.85 0.86 0.96 0.86 0.86 0.86 0.86 0.86 0.96 0.99 0.78 0.86 0.86 0.97 0.99 0.86 0.86 1 1 0.86 0.86 P21 0.45 0.66 1 0.53 1 0.44 1 1 1 0.51 0.63 0.46 1 1 0.69 0.72 1 1 0.78 0.73 1 1 P22 0.51 0.63 1 0.69 1 0.60 1 1 1 0.68 0.79 0.52 1 1 0.84 0.87 1 1 0.89 0.88 1 1
Fig. 5.Results of the hierarchical cluster analysis of phenolic compounds according to the HHP conditions that maximize their extraction from watercress.
J. Pinela et al. Separation and Purification Technology 192 (2018) 501–512
experimental and theoretical results was observed. In general, the re-covery of phenolic compounds was maximized when high pressures, high ethanol concentrations and short extraction times were applied, which validate this cold extraction method as a very promising tech-nique compared to the time-consuming conventional methods. This study also highlighted watercress as being an interesting source of phytochemicals, namely phenolic acids andflavonoids.
Acknowledgements
The authors are grateful to the Foundation for Science and Technology (FCT) of Portugal and FEDER under Programme PT2020 for
financial support to CIMO (UID/AGR/00690/2013); to FCT/MEC for
financial support to REQUIMTE/LAQV (UID/QUI/50006/2013 - POCI/ 01/0145/FERDER/007265) through national funds and co-financed by FEDER under Programme PT2020; to FCT/MEC for thefinancial sup-port to the QOPNA research Unit (FCT/ID/QUI/00062/2013), through national funds and where applicable co-financed by the FEDER, within the PT2020 Partnership Agreement; to FCT for the grant attributed to J. Pinela (SFRH/BD/92994/2013) through the Programa Operacional Capital Humano (POCH) supported by the European Social Fund and National Funds of MCTES (Ministério da Ciência, Tecnologia, e Ensino Superior); to FCT for L. Barros research contract; and to the Xunta de Galicia for financial support to M.A. Prieto. The authors are also grateful to the Interreg España-Portugal forfinancial support through the project 0377_Iberphenol_6_E.
References
[1] C. Caleja, A. Ribeiro, L. Barros, J.C.M. Barreira, A.L. Antonio, M. Beatriz, P.P. Oliveira, M.F. Barreiro, I.C.F.R. Ferreira, Cottage cheeses functionalized with fennel and chamomile extracts: Comparative performance between free and mi-croencapsulated forms, Food Chem. 199 (2016) 720–726.
[2] C. Pereira, L. Barros, M.J. Alves, L. Pereira, C. Santos-Buelga, I.C.F.R. Ferreira, Phenolic profile and antimicrobial activity of different dietary supplements based on Cochlospermum angolensis Welw, Ind. Crops Prod. 74 (2015) 412–416. [3] O. Taofiq, S. Heleno, R. Calhelha, M. Alves, L. Barros, M. Barreiro, A.M.
González-Paramás, I.C.F.R. Ferreira, Development of mushroom-based cosmeceutical for-mulations with anti-inflammatory, anti-tyrosinase, antioxidant, and antibacterial properties in food and pharmaceutical industries has increased year by year, Molecules 21 (2016) 1372.
[4] I.C.F.R. Ferreira, N. Martins, L. Barros, Phenolic compounds and its bioavailability: In vitro bioactive compounds or health promoters? in: F. Toldrá (Ed.), Adv. Food Nutr. Res. Academic Press, 2017, pp. 1–44.
[5] J. Pinela, M.A. Prieto, A.M. Carvalho, M.F. Barreiro, M.B.P.P. Oliveira, L. Barros, I.C.F.R. Ferreira, Microwave-assisted extraction of phenolic acids andflavonoids and production of antioxidant ingredients from tomato: A nutraceutical-oriented optimization study, Sep. Purif. Technol. 164 (2016) 114–124.
[6] C. Caleja, L. Barros, M.A. Prieto, M.F. Barreiro, M.B.P.P. Oliveira, I.C.F.R. Ferreira, Extraction of rosmarinic acid fromMelissa officinalisL. by heat-, microwave- and ultrasound-assisted extraction techniques: A comparative study through response surface analysis, Sep. Purif. Technol. 186 (2017) 297–308.
[7] V. Vieira, M.A. Prieto, L. Barros, J.A.P. Coutinho, O. Ferreira, I.C.F.R. Ferreira, Optimization and comparison of maceration and microwave extraction systems for the production of phenolic compounds fromJuglans regiaL. for the valorization of walnut leaves, Ind. Crops Prod. 107 (2017) 341–352.
[8] J.V. Higdon, B. Delage, D.E. Williams, R.H. Dashwood, Cruciferous vegetables and human cancer risk: epidemiologic evidence and mechanistic basis, Pharmacol. Res. 55 (2007) 224–236.
[9] P. Ravasco, D.R. João, I. Rowland, N. Giallourou, J. Swann, L.M. Dias, J. Sain, S. Rothwell, M. Fogarty, N. Harbourne, MON-LB019: Does watercress influence phase angle in breast cancer patients during radiotherapy? Clin. Nutr. 34 (2015) S257.
[10] P. Ravasco, D. João, M. Jorge, I. Rowland, N. Giallourou, J. Swann, L.M. Dias, J. Sain, S. Rothwell, M. Fogarty, N. Harbourne, MON-LB027: Watercress in breast cancer patients undergoing radiotherapy: relevance in DNA damage of dermatitis? Clin. Nutr. 34 (2015) S260–S261.
[11] C.I.R. Gill, S. Haldar, L.A. Boyd, R. Bennett, J. Whiteford, M. Butler, J.R. Pearson, I. Bradbury, I.R. Rowland, Watercress supplementation in diet reduces lymphocyte DNA damage and alters blood antioxidant status in healthy adults, Am. J. Clin. Nutr. 85 (2007) 504–510.
[12] V. Spínola, J. Pinto, P.C. Castilho,In vitrostudies on the effect of watercress juice on digestive enzymes relevant to type 2 diabetes and obesity and antioxidant activity, J. Food Biochem. 41 (2016) e12335.
[13] A. Zeb, Phenolic profile and antioxidant potential of wild watercress (Nasturtium officinale), Springerplus. 4 (2015) 714.
[14] J. Pinela, L. Barros, J.C.M. Barreira, A.M. Carvalho, M.B.P.P. Oliveira, C.
Santos-Buelga, I.C.F.R. Ferreira, Postharvest changes in the phenolic profile of watercress induced by post-packaging irradiation and modified atmosphere packaging, Unpublished results.
[15] L.A. Boyd, M.J. McCann, Y. Hashim, R.N. Bennett, C.I.R. Gill, I.R. Rowland, Assessment of the anti-genotoxic, anti-proliferative, and anti-metastatic potential of crude watercress extract in human colon cancer cells., Nutr. Cancer. 55 (2006) 232–241.
[16] P. Rose, K. Faulkner, G. Williamson, R. Mithen, 7-Methylsulfinylheptyl and 8-me-thylsulfinyloctyl isothiocyanates from watercress are potent inducers of phase II enzymes, Carcinogenesis 21 (2000) 1983–1988.
[17] P. Rose, Q. Huang, C.N. Ong, M. Whiteman, Broccoli and watercress suppress matrix metalloproteinase-9 activity and invasiveness of human MDA-MB-231 breast cancer cells, Toxicol. Appl. Pharmacol. 209 (2005) 105–113.
[18] H. Mújica-Paz, A. Valdez-Fragoso, C.T. Samson, J. Welti-Chanes, J.A. Torres, High-pressure processing technologies for the pasteurization and sterilization of foods, Food Bioprocess Technol. 4 (2011) 969–985.
[19] M. Hernández-Carrión, I. Hernando, A. Quiles, High hydrostatic pressure treatment as an alternative to pasteurization to maintain bioactive compound content and texture in red sweet pepper, Innov. Food Sci. Emerg. Technol. 26 (2014) 76–85. [20] J. Pinela, I.C.F.R. Ferreira, Nonthermal physical technologies to decontaminate and
extend the shelf-life of fruits and vegetables: Trends aiming at quality and safety, Crit. Rev. Food Sci. Nutr. 57 (2017) 2095–2111.
[21] S.M. Castro, J.A. Saraiva, High-pressure processing of fruits and fruit products, in: D.-W. Sun (Ed.), Emerg. Technol. Food Process., second ed., Academic Press, 2014, pp. 65–76.
[22] I.F. Strati, E. Gogou, V. Oreopoulou, Enzyme and high pressure assisted extraction of carotenoids from tomato waste, Food Bioprod. Process. 94 (2015) 668–674. [23] L. Wang, Energy efficiency technologies for sustainable food processing, Energy
Effic. 7 (2014) 791–810.
[24] H.-W. Huang, C.-P. Hsu, B.B. Yang, C.-Y. Wang, Advances in the extraction of natural ingredients by high pressure extraction technology, Trends Food Sci. Technol. 33 (2013) 54–62.
[25] X. Jun, Z. Shuo, L. Bingbing, Z. Rui, L. Ye, S. Deji, Z. Guofeng, Separation of major catechins from green tea by ultrahigh pressure extraction, Int. J. Pharm. 386 (2010) 229–231.
[26] K.N. Prasad, E. Yang, C. Yi, M. Zhao, Y. Jiang, Effects of high pressure extraction on the extraction yield, total phenolic content and antioxidant activity of longan fruit pericarp, Innov. Food Sci. Emerg. Technol. 10 (2009) 155–159.
[27] W.M. Elamin, J.B. Endan, Y.A. Yosuf, R. Shamsudin, A. Ahmedov, High pressure processing technology and equipment evolution: A review, J. Eng. Sci. Technol. Rev. 8 (2015) 75–83.
[28] V. Briones-Labarca, M. Plaza-Morales, C. Giovagnoli-Vicuña, F. Jamett, High hy-drostatic pressure and ultrasound extractions of antioxidant compounds, sulfor-aphane and fatty acids from Chilean papaya (Vasconcellea pubescens) seeds: Effects of extraction conditions and methods, LWT - Food Sci. Technol. 60 (2015) 525–534. [29] Z. Shouqin, X. Jun, W. Changzheng, High hydrostatic pressure extraction offl
a-vonoids from propolis, J. Chem. Technol. Biotechnol. 80 (2005) 50–54. [30] E.M.C. Alexandre, P. Araújo, M.F. Duarte, V. de Freitas, M. Pintado, J.A. Saraiva,
High-pressure assisted extraction of bioactive compounds from industrial fermented
fig by-product, J. Food Sci. Technol. 54 (2017) 2519–2531.
[31] R.N. Pereira, A.A. Vicente, Environmental impact of novel thermal and non-thermal technologies in food processing, Food Res. Int. 43 (2010) 1936–1943.
[32] E.M.C. Alexandre, P. Araújo, M.F. Duarte, V. de Freitas, M. Pintado, J.A. Saraiva, Experimental design, modeling, and optimization of high-pressure-assisted extrac-tion of bioactive compounds from pomegranate peel, Food Bioprocess Technol. 10 (2017) 886–900.
[33] R. Casquete, S.M. Castro, M.C. Villalobos, M.J. Serradilla, R.P. Queirós, J.A. Saraiva, M.G. Córdoba, P. Teixeira, High pressure extraction of phenolic compounds from citrus peels, High Press. Res. 34 (2014) 447–451.
[34] M. Corrales, A.F. García, P. Butz, B. Tauscher, Extraction of anthocyanins from grape skins assisted by high hydrostatic pressure, J. Food Eng. 90 (2009) 415–421. [35] X. Jun, Caffeine extraction from green tea leaves assisted by high pressure
pro-cessing, J. Food Eng. 94 (2009) 105–109.
[36] H.-S. Lee, H.J. Lee, H.J. Yu, D.W. Ju, Y. Kim, C.-T. Kim, C.-J. Kim, Y.-J. Cho, N. Kim, S.-Y. Choi, H.J. Suh, A comparison between high hydrostatic pressure extraction and heat extraction of ginsenosides from ginseng (Panax ginsengCA Meyer), J. Sci. Food Agric. 91 (2011) 1466–1473.
[37] J. Xi, S. Luo, The mechanism for enhancing extraction of ferulic acid from Radix
Angelica sinensisby high hydrostatic pressure, Sep. Purif. Technol. 165 (2016) 208–213.
[38] S.M.F. Bessada, J.C.M. Barreira, L. Barros, I.C.F.R. Ferreira, M.B.P.P. Oliveira, Phenolic profile and antioxidant activity ofColeostephus myconis(L.) Rchb.f.: An underexploited and highly disseminated species, Ind. Crops Prod. 89 (2016) 45–51. [39] J. Santos, M.B.P.P. Oliveira, E. Ibáñez, M. Herrero, Phenolic profile evolution of
different ready-to-eat baby-leaf vegetables during storage, J. Chromatogr. A. 1327 (2014) 118–131.
[40] A. Martínez-Sánchez, A. Gil-Izquierdo, M.I. Gil, F. Ferreres, A comparative study of
flavonoid compounds, vitamin C, and antioxidant properties of baby leaf
Brassicaceaespecies, J. Agric. Food Chem. 56 (2008) 2330–2340.
[41] M. Ranic, M. Nikolic, M. Pavlovic, A. Buntic, S. Siler-Marinkovic, S. Dimitrijevic-Brankovic, Optimization of microwave-assisted extraction of natural antioxidants from spent espresso coffee grounds by response surface methodology, J. Clean. Prod. 80 (2014) 69–79.