F U L L A R T I C L E
Physicochemical characterization and antioxidant activity of
honey with
Eragrostis
spp. pollen predominance
Smail Aazza
1|
Youssef Elamine
1|
Soukaïna El-Guendouz
1|
Badi
^
aa Lyoussi
1|
Maria D. Antunes
2|
Leticia M. Estevinho
3,4|
Of
elia Anjos
5,6|
Jorge D. Carlier
7|
Maria C. Costa
7|
Maria G. Miguel
21Laboratory of Physiology-Pharmacology-Environmental Health, Faculty of Sciences Dhar El Mehraz, BP 1796 Atlas, University Sidi Mohamed Ben Abdallah,
Fez 30 000, Morocco
2Universidade do Algarve, FCT, MeditBio, Edf 8, Campus de Gambelas 8005-139 Faro, Portugal
3Departamento de Biologia e Biotecnologia, Escola Superior Agraria, Instituto Politecnico de Bragança, Campus Santa Apolonia, Apartado 1172, Bragança 5301-855, Portugal
4Centre of Molecular and Environmental Biology, University of Minho, Campus de Gualtar, Braga, Portugal
5IPCB - Instituto Politecnico de Castelo Branco, Castelo Branco 6001-909, Portugal
6Centro de Estudos Florestais, Instituto Superior de Agronomia, Universidade de Lisboa, Tapada da Ajuda, Lisboa 1349-017, Portugal
7Centro de Ci^encias do Mar, Universidade do Algarve, FCT, Campus de Gambelas, Faro 8005-139, Portugal
Correspondence
Maria G. Miguel, Universidade do Algarve, FCT, MeditBio, Edf 8, Campus de Gambelas 8005-139 Faro, Portugal.
Email: [email protected]
Funding information
Portuguese National Funding Agency for Science, Research and Technology (Fundaç~ao para a Ciencia e a Tecnologia^ – FCT), Grant/Award Number: UID/AGR/ 00239-2013, UID/BIA/04325/2013– MEDTBIO, UID/Multi/04326/2013 and UID/BIA/04050/2013
Abstract
This study aimed to characterize the pollen and physicochemical profiles, and to evaluate the
anti-oxidant capacity of six samples of Moroccan honey. The pollen grains of Eragrostisspp. were
predominant in all samples (from a minimum of 46.5861.59% to 72.7262.43% as a maximum),
exceeding the minimum (generally 45%) required for the monoflorality nomination of a honey
sample, and suggestion a case of newly reported honey. The analyzed samples had low diastase
activity and hydroxymethylfurfural (HMF) content. Potassium was the dominant element in
practi-cally all samples, except the sample with the highest Eragrostisspp. pollen percentage, which
showed sodium predominance. The honey color ranged from water white to light amber, and
posi-tively correlated the concentrations of phenols, proline and the capacity for scavenging free
radicals. However, great variability observed in all the analyzed parameters, and could not be
explained by the variability of theEragrostisspp. pollen percentage, which suggests a hypothesis
of low concentrated nectar.
Practical applications
The melissopalynological profile of honey is an important parameter for determining the type of
honey (multifloral, monofloral, blossom, honeydew) and its relationship to the botanical and
geo-graphical provenance. There is generally a relationship between the pollen profile of honey and
the biological properties. The physicochemical characterization, antioxidant activity and
melissopa-lynological profile ofEragrostishoney was reported for the first time in this study. These data
intend to contribute for the introduction of a new type of honey labeled asEragrostishoney. At
the same time, the evaluation of the antioxidant activity may also trigger the search of other
bio-logical properties with medicinal attributes for the newEragrostisssp. honey.
K E Y W O R D S
food quality, melanoidins, natural antioxidants
J Food Biochem. 2018;42:e12431. https://doi.org/10.1111/jfbc.12431
1
|I N T R O D U C T I O N
Beekeeping in Morocco is one of the most important economical
activ-ities, being the current annual honey production about 2,500–3,500
tons. According to the estimations of the Ministry of Agriculture, Rural
Development and Maritime Fisheries, which is making major efforts to
modernize the sector and assist beekeepers, honeys’production may
reach 16,000 tones by 2020 (Moujanni, Essamadi, & Terrab, 2017).
Even so, despite the great potentiality of this sector, it is feared that
honey’s production may stagnate due to difficulties concerning
repopu-lating colonies and the lack of scientific studies that characterize the
product and ensure its good quality, safety and allow assessing their
biological activities and, therefore, expanding the range of applications.
Even though the legislation regarding honey production and
trad-ing in Morocco is scarce, the European legislation establishes, since
1995, that the labeling of the floral origin of honey is essential to
pro-tect consumers and marketers [Council Directive EEC/74/409
amended by the Proposal COM/95/0722 (1996)]. It is, therefore,
important to develop scientific tools to assess the floral origins of
honey and/or the presence of any adulteration in samples. Indeed,
melissopalynology provides information on the melliferous plants yet
there is no correlation between a pollen count and the quantity of the
delivered nectar. This gives rise to the problematic of the minimum
pol-len required for the monoflorality nomination. In the case ofLavandula
spp., as an example of a strong nectar delivering plant, the presence of
15% of its pollen in a honey sample is sufficient to obtain the lavender
monoflorality nomination. In contrastCastaneaspp. needs to be
repre-sented by more than 90% of total pollen content to provide the
mono-florality of a honey sample (Gomes, Dias, Moreira, Rodrigues, &
Estevinho, 2010). Due to these limitations other characteristics, like the
physicochemical parameters, are also essential to ascertain the
botani-cal origin of honey and are widely used in routine honey analysis
(Elamine et al., 2017).
The above-mentioned interest came, mainly, from the rich
chemi-cal composition of honey (carbohydrates, proteins, enzymes free amino
acids, essential minerals, vitamins, and polyphenols), which makes it an
important source of bioactive compounds responsible for several
bio-logical activities including antioxidant, anti-inflammatory, antimicrobial,
anti-ulcer, antihyperlipidemic, antidiabetic, and anticancer properties
(Alvarez-Suarez, Giampieri, & Battino, 2013).
These beneficial properties, particularly antioxidant, are due to the
presence of a great variety of compounds like phenolic acids (ellagic,
caffeic,p-coumaric and ferulic acids), ascorbic acid, flavonoids
(apige-nin, pinocembrin, kaempferol, quercetin, galangin, chrysin, and
hespere-tin), tocopherols, enzymes (catalase, superoxide dismutase), reduced
glutathione, amino acids and carotenoids (Almeida-Muradian, Stramm,
& Estevinho, 2014; Rao et al., 2016).
It is important to consider that honey’s physicochemical
character-istics are strongly related to the botanical source of the nectar, which
determines the content of secondary metabolites (El-Sohaimy, Masry,
& Shehata, 2015; Silva et al., 2013), but also to the climatic conditions
of the locations where the beehives are placed.
Therefore, the present work aimed at the characterization of a
Moroccan honey with predominance ofEragrostisspp. pollen, regarding
its physicochemical characteristics and antioxidant activity. The results
showed high variability among the analyzed samples, with low
contri-bution ofEragrostisspp. pollen presence.
2
|M A T E R I A L A N D M E T H O D S
2.1
|Reagents and solvents
NaOH, Na2CO3, sodium phosphate were purchased from Pronalab,
Madalena, Portugal; HCl was purchased from Fisher Scientific UK Ltd.;
Loughborough, UK; KCl was purchased from BHD Prolabo; Leuven,
Belgium; acetic acid, ascorbic acid, Folin–Ciocalteu, fuchsin, KOH,
meth-anol, 2-propanol were purchased from Merck KGaA; Darmstadt,
Germany; 2,2-azino-bis(3- ethylbenzothiazoline-6-sulphonic acid) (ABTS),
ferrozine, FeSO4, gallic acid, NBT, ninhydrine, PMS, proline were
purchased from Acros Organics; NJ; AlCl3and anhydride acetic were
purchased from Panreac Quimica, Montcada i Reixac; Barcelona, Spain;
catechin was purchased from Fluka; glucose, fructose, sucrose, were
pur-chased from Sigma Aldrich; H2SO4, sodium acetate, starch, potassium
iodide, I2, sodium nitroprusside (SNP), were purchased from
Riedel-de-Haen; Germany; acetic acid was purchased from CHEM-Lab, Belgium.
2.2
|Sampling
The six honey samples (n56) harvested in 2013 were directly
pur-chased from Moroccan beekeepers of the Tiznit region, in the southern
Moroccan region of Souss-Massa. The samples were centrifuged on
arrival at the laboratory, wrapped in aluminum for light protection, and
stored at 48C until analysis, which was about one month later.
2.3
|Melissopalynological analysis
The honey samples pollen qualitative and quantitative spectrum analysis
was carried out according to the International Commission for Bee
Bot-any (ICBB), as previously described (Louveaux, Maurizio, & Vorwohl,
1978) and using an optic microscope (Leitz Messtechnik GmbH; Wetzlar,
Germany). Reference standards obtained from Portugal honey flora were
used for grain identification, and the classes were determined as follows:
dominant pollen (> 45% of a specific pollen type), secondary pollen
(16–45%), important minor pollen (3–15%), and minor pollen (<3%).
2.4
|Physicochemical analysis
Free acidity, pH, lactone acidity, ash content, water content, electrical
conductivity, proline, diastase activity, HMF were performed according
to the harmonized method (Bogdanov, 2002).
2.5
|Estimation of honey color, and melanoidins
content
The determination of the honey color was carried out by measuring
the absorbance at 635 nm (A635) of an aqueous solution containing
10 g of honey and 20 mL of water, using a UV/Vis Shimadzu (Tokyo,
Japan) spectrophotometer (Naab, Tamame, & Caccavari, 2008). The
absorbance values were converted on to the Pfund Scale through the
equation: mm Pfund5 238.701371.39 3 A635. Additionally, color
was determined by spectrophotometry by calculating net absorbance
(A560–A720).
The determination of honey melanoidin content was carried out
based on the browning index (net absorbance5A450–A720) (Brudzynski
& Miotto, 2011). Spectrophotometric measurements were performed
in a 1 cm quartz cell and results were expressed as absorbance units
(AU).
2.6
|Sugars content
Fructose, glucose and sucrose contents were evaluated according to
the method described by Anjos, Campos, Ruiz, and Antunes (2015).
2.7
|Polyphenols content
The total phenol content was determined using the Folin–Ciocalteau
method, with some modifications (Singleton & Rossi, 1965) and the
results were expressed as mg gallic acid equivalents (GAE)/100 g. In
brief, 5 g of honey were treated with 10 mL of distilled water, mixed
and centrifuged. Five hundred microliters of this solution was mixed
with 2.5 mL Folin–Ciocalteau reagent (0.2 N) for 5 min and then 2 mL
of a Na2CO3 solution added (75 g/L). All samples were incubated at
room temperature in the dark for 2 hr and their absorbance was read
at 760 nm. The blank solution contained water instead of honey. To
obtain the calibration curve, a stock solution of gallic acid (1 mg/mL)
was prepared for further dilutions (8–250lg/mL). As reducing sugars
can interfere in this reaction, an artificial sugar solution was made
according to the sugar profile of each sample, and used to remove the
interference (Elamine et al., 2017).
2.8
|Flavonoids content
The flavonoid content (FC) of the different honey samples was
quanti-fied using the aluminum chloride assay through colorimetric method
(Samatha, Shyamsundarachary, Srinivas, & Swang, 2012). Possible
interaction of sample color with the reaction reagents was avoided
using a blank with water (substituting the other reaction components)
and the sample as described by Sancho et al. (2016). The FC was
expressed in mg of catechin equivalents (CE) per 100 g of honey.
2.9
|Minerals content
To analyze the mineral content, samples (5 g) were subjected to
calci-nation (5508C). After cooling, the residue was placed in a desiccator for
further analysis. Nitric acid (5 mL) was added to the ash and the
mix-ture was stirred on a heating plate to almost complete dryness. Then,
nitric acid (10 mL) was added and the mixture was brought up to
25 mL with distilled water. Afterwards, the mineral content was
deter-mined by flame atomic absorption (Ca, Mg, Mn, Zn, Cu, and Fe) or
emission (Na, K) spectrometry (air-acetylene) using a novAA 350
(Analytik Jena, Germany). Results were expressed as milligrams of
min-eral content per kilogram of honey.
2.10
|Antioxidant activity
This antioxidant activity was studied using four methodologies since the
use of more than one method has been recommended, as such at least
two methods must be performed (Sakanaka & Ishihara, 2008). All
meas-urements described in this section were performed in triplicate.
The determination of ABTS (2,20
-azino-bis(3-ethylbenzothiazoline-6-sulphonic acid) radical scavenging activity, and ferrous ions chelating
effect were carried out as reported previously (Miguel, Nunes, Dandlen,
Cavaco, & Antunes, 2010). As for the determination of DPPH and
super-oxide anion scavenging activities, protocols were detailed by
Brand-Williams, Cuvelier, and Berset (1995), and Soares (1996), respectively.
2.11
|Statistical analysis
Statistical analysis was carried out by ANOVA through the SPSS 22.0
program (SPSS Inc., Chicago, IL) and using the Tukey post hoc test at
p<.05. Correlations between phenol, flavonoid, proline, melanoidins
contents, color, and antioxidant activity were achieved by Pearson
cor-relation coefficient (r) at a significance level of 99% (p<.01). Principal
component analyses (PCA) were performed with Minitab 17.1.0.
(Mini-tab Inc., State College, PA, USA).
3
|R E S U L T S A N D D I S C U S S I O N
3.1
|Melissopalynological analysis
The melissopalynological analysis is currently the only technique
allow-ing for the direct assessment of the botanical and geographic origin of
honey (El-Sohaimy et al., 2015).
The percentages of the pollen types identified in the six Moroccan
honeys are presented in Table 1. The results show that in all samples,
pollen grains ofEragrostis spp. predominated, ranging from 46.586
1.59%, in sample S4, to 79.6761.82%, in sample S6, exceeding the
minimal pollen percentage (45%) required to declare honey
monofloral-ity, and suggesting that the analyzed sample areEragrostisspp.
mono-floral honey. The last claim needs to be further studied due to the
exceptions reported by some authors: chestnut honey needs 90% of
Castaneaspp. pollen to be monofloral, and lavender honey needs only
15% of Lavandulaspp. pollen (Gomes et al., 2010).Cardus spp. and
Oleaspp. are other pollen grains also detected, being the secondary
pollens in sample S4 (22.3960.99% and 16.7661.45%, respectively)
and only an important minor pollen in sample S6 (9.0561.57% and
7.8560.13%, respectively) (Table 1). The secondary pollen grains in
samples S1, S2 and S3 wereCardusspp. (17.8560.93%),Phoenixspp.
(22.1962.28%), andThymusspp. (19.2861.65%), respectively.
3.2
|Physicochemical characteristics
The values of pH ranged from 3.57, in S3, to 3.76, in S2 (Table 2),
honeys from diverse floral origin (Bettar et al., in press; Diez, Andres, &
Terrab, 2004; Malika, Mohamed, & Chakib, 2005) or within the pH
range reported by Terrab, Vega-Perez, Díez, and Heredia (2002). Free
acidity ranged from 8.25 mEq/kg (S5) to 28.65 mEq/kg (S3). These free
acidity values were within the European limits (<50 mEq/kg) (EU
Council, 2002). Such low values are important to prevent undesirable
fermentation. As for the lactone acidity, it ranged from 7.00 mEq/kg
(S2) to 15.33 mEq/kg (S5). Total acidity ranged from 20.80 mEq/kg (S6)
to 38.65 mEq/kg (S3).
Samples S4 and S5 had the highest (0.22%) and lowest (0.02%) ash
content, respectively (Table 2). Those results correlated, as reported
(Feas, Pires, Estevinho, Iglesias, & Araujo, 2010), the electrical
conduc-tivity parameter, and S4 had the highest value (792.33lS/cm), while
sample S5 had the lowest value (201.57lS/cm). The values of ash and
conductivity were within the range established by the European
Com-munity (below 0.6% and 800lS/cm, respectively [EU Council, 2002]).
The relative low ash content is like citrus honey (Aazza, Lyoussi,
Antunes, & Miguel, 2014; Felsner et al., 2004), although great
variabili-ty had been observed among samples. Despite being in the same floral
origin, the variability can be attributed to the different geographical
conditions (soil and edafoclimatic characteristics) where hives are
located (Almeida-Muradian et al., 2014).
Only sample S1 had the diastase activity (12.42 Shade units/g)
higher than the minimum value required by the European legislation (8
Schade units/g), or 3 Schade units/g in the case of citrus honey (EU
Council, 2002). In this last case, the level of HMF should not exceed
15 mg/kg, as a maximal tolerable value, whereas in the remaining types
of honey, the maximal allowed content of HMF is 40 mg/kg (Codex
Alimentarius, 2001; EU Council, 2002). In almost all the analyzed
sam-ples, HMF content was even below the 15 mg/kg, and only S2 and S6
had values of 25.94 mg/kg and 21.47 mg/kg, respectively, but still
below the generally recommended value (40 mg/kg) (Table 2).
Low diastase activities found in the samples may indicate
inad-equate storage conditions or processing (relative high temperatures),
because the enzyme is susceptible to heat. Nevertheless diastase
activities are also dependent on the geographic and floral origins of
honey samples (Fallico, Arena, Verzera, & Zappala, 2006). Keeping in
mind that in case of citrus honey, low diastase values are accepted,
coming to a conclusion on whether the low value measured in the
ana-lyzed samples is a characterizing feature of this honey, or if it is a result
of inadequate processing cannot be done. In fact, regarding the low
HMF values seen in the samples, it can be suggested that the freshness
and the adequate storage conditions of the studied samples,
strengthen the first hypothesis, as reported for Citrus honey.
The moisture or water content may vary from 15 to 21%
depend-ing on several factors, such as the botanical origin of the honey, the
level of maturity reached in the hive, processing techniques and
stor-age conditions (da Silva, Gauche, Gonzaga, & Costa, 2016); however,
high values may permit the growth of molds on the surface of the
honey (Mendes, Proença, Ferreira, & Ferreira, 1998). Therefore, the
established legislation fixed the suitable moisture at values below 20%
(EU Council, 2002). In this work, the moisture was close to the
permit-ted in the four samples, and exceeded that limit in two samples (S4 and
S5) (Table 3). Higher percentages of moisture had already been
reported for Moroccan honeys (Aazza et al., 2014; Diez et al., 2004;
Terrab et al., 2002) of diverse floral origins.
Proline is the most abundant amino acid in honey, representing a
total of 50–85% amino acids, and has been used as a criterion of honey
ripeness and sugar adulteration with values not lower than 200 mg/kg
(Hermosín, Chicon, & Cabezudo, 2003; Manzanares, García, Gald on,
Rodríguez, & Romero, 2014). In the analyzed samples, the proline
con-tent varied greatly (Table 3) from a minimum of 251.46 mg/kg in S5 to
maximum of 924.98 mg/kg in S3, respecting so the recommended limit,
and being also within the previously reported values for other botanical
origin Moroccan honey (Aazza, Lyoussi, Antunes, & Miguel, 2013,
2014; Hermosín et al., 2003).
Honey color is an indicator of the presence of polyphenols,
ter-penes and carotenoids (Naab et al., 2008; Wilczynska, 2014). In
addi-tion, the color and the electrical conductivity also give an indication of
the botanical origin of honey (Anjos et al., 2015b). In honey samples of TA B L E 1 Sample code, places of collection, year of production, and the most predominant pollen of sixEragrostisspp. honey samples from Morocco
Type of pollen grain (%1SD)
Sample code Eragrostisspp. (PP) SP IMP MP
S1 67.4661.82 Cardusspp. (17.8560.93) Phoenixspp. (9.7760.56)1Others (4.9360.34) –
S2 67.9761.84 Phoenixspp. (22.1962.28) Thymusspp. (7.0760.56) Oleaspp. (2.7860.11)
S3 67.5562.64 Thymusspp. (19.2861.65) Cardusspp. (6.4660.49)1Phoenixspp. (6.7160.49) –
S4 46.5861.59 Cardusspp. (22.3960.99)1
Oleaspp. 16.7661.45)
Thymusspp. (8.0660.28)1Others (6.2260.85) –
S5 72.7262.43 – Cardusspp. (14.9760.75)1Phoenixspp.
(7.3460.93)1Thymusspp. (4.9760.75)
–
S6 79.6761.82 – Cardusspp. (9.0561.57)1Thymusspp.
(7.8560.13)1Others (3.4460.37)
–
Abbreviations (SD5standard deviation; PP5predominant pollen (>45%); SP5secondary pollen (16–45%); IMP5important minor pollen (3–15%); MP5minor pollen (<3%);–5absent).
T A B L E 3 Some physicochemical parameters of sixEragrostisspp. honey samples from Morocco
Samples
Proline
(mg/kg) Melanoidins
Phenols (mg GAE/100 g)
Flavonoids (mg QE/100 g)
Color Pfund
scale (mm) ABTS DPPH Superoxide Chelating
S1 631.46633.44b 0.5260.00b 283.6866.02b 36.5762.29c 10.5664.90c Extra white 20.0860.24b 38.8061.96a 17.4860.25d 46.9560.66e
S2 379.52610.74c 0.3460.01d 223.4866.57c 29.8162.06c 2.6561.24c Water white 16.9761.13c 26.5463.59b 19.3460.22c 53.2161.60d
S3 924.9866.56a 1.1260.02a 495.51614.19a 76.9362.81a 71.2766.13a Light amber 9.2060.16d 8.6062.24c 13.7660.29e 43.9360.33f
S4 337.80620.33d 0.3760.02c 175.0167.25d 44.3861.55b 24.8664.77b White 20.7560.12b 33.4960.61ab 19.3060.61c 110.9161.72a
S5 251.4664.39e 0.0960.00f 73.5861.26f 7.5460.71c 1.0360.06c Water white – – 20.5660.12b 72.6761.26c
S6 384.90614.54c 0.2160.00e 143.76612.72e 28.4960.70b 1.8961.00c Water white 30.2060.64a 31.3564.86ab 21.9360.28a 91.4061.43b
Mean6SD 485.026249.95 0.4460.36 232.506147.18 37.29622.98 18.71627.28 19.4467.57 27.766 18.7362.85 69.84626.95
Min–Max 251.46–924.98 0.09–1.12 73.58–495.51 7.54–76.94 1.03–71.27 9.20–30.20 8.60–38.80 13.76–21.93 43.96–110.91
Values in the same column followed by the same letter are not significant different (p<.05) by the Tukey’s multiple range test;–5without activity in the concentrations assayed.
Abbreviations (Mean6SD5mean6standard deviation; Min–Max5Minimal-maximal).
T A B L E 2 Some physicochemical parameters of sixEragrostisspp. honey samples from Morocco
Samples Moisture % pH Ash (%)
Electrical conductivity (lS/cm)
Free acidity (mEq/kg)
Lactonic acidity (mEq/kg)
Total acidity (mEq/kg)
Diastase activity
(Shade units/g) HMF (mg/kg)
S1 18.5360.23cd 3.6860.03b 0.2060.01ab 510.0062.00b 21.2560.95c 15.0065.68a 36.2564.78ab 12.4260.66a 5.7760.30e
S2 19.8060.12d 3.7660.01a 0.2060.08ab 416.3361.15d 14.0560.83d 7.0064.33b 21.0563.51c 6.4860.32cd 25.9360.68a
S3 19.6760.23cd 3.5760.01e 0.1860.01ab 477.0061.00c 28.6560.52a 10.0061.73ab 38.6561.21a 7.8660.51b 2.2060.17f
S4 20.4060.12e 3.6160.01cd 0.2260.01a 792.3361.53a 24.3060.79b 9.0062.29ab 33.3061.51b 6.9160.21bc 11.7760.27d
S5 20.2760.11e 3.5860.02de 0.0260.01c 201.5760.64e 8.2560.45f 15.3364.58a 23.5864.75c 5.6060.69d 14.1360.40c
S6 19.1360.11c 3.6260.02c 0.1160.03b 508.6762.52b 11.3060.31e 9.5061.50ab 20.8061.60c 5.7760.17cd 21.4760.43b
Mean6SD 19.1261.14 3.6460.07 0.1560.08 484.326190.13 17.9767.99 10.3363.31 28.30868.69 7.5162.54 13.5469.04
Min–Max 17.27–20.53 3.57–3.76 0.02–0.22 201.57–792.33 8.25–28.65 7.00–15.33 21.05–38.65 5.60–12.42 2.20–25.93
Values in the same column followed by the same letter are not significant different (p<.05) by the Tukey’s multiple range test.
Abbreviations (Means6SD5Means6standard deviation; Min-Max5Minimal–maximal).
ET
AL
.
|
5o
f
1
the present work, some variability in color, determined at A635, was
observed: from extra water white (1.03, 1.89, and 2.65 mm Pfund) in
S5, S6, and S2 samples, respectively, to light amber (71.27 mm Pfund)
in S3 (Table 3).
Total polyphenol content varied from 73.58 mg GAE/kg (S5) to
495.51 mg GAE/kg (S3) in honey samples. Flavonoid content ranged
from 7.54 mg CE/kg (S5) to 76.94 mg CE/kg (S3) (Table 3). The values of
phenols and flavonoids in these honey samples were within the range
found for other monofloral Moroccan honeys Aazza et al. (2014), with
the exception of sample S5 that had significantly lower amounts, although
close to those found by the same authors for Portuguese honeys (Aazza
et al., 2013). Several studies have detected that polyphenol amounts in
honey depend on its floral (Escuredo, Míguez, Fernandez-Gonzalez, &
Seijo, 2013; K€uç€uk et al., 2007) and its geographical origins (Rodríguez,
Mendoza, Iturriga, & Castano-Tostado, 2012; Rosa et al., 2011).~
The same variability among the analyzed samples was observed
also in melanoidin content, and the values ranged from 0.09 for sample
S5 and 1.12 for sample S3 (Table 3). Melanoidins, Maillard reaction
products, are multicomponent polymers consisting of protein–
polyphenol–oligosaccharide complexes and phenols, which can be
measured at two wavelengths (A560–A720). They possess several
biological properties, such as antioxidant activity (Brudzynski &
Miotto, 2011; Moussa, Saad, & Noureddine, 2012).
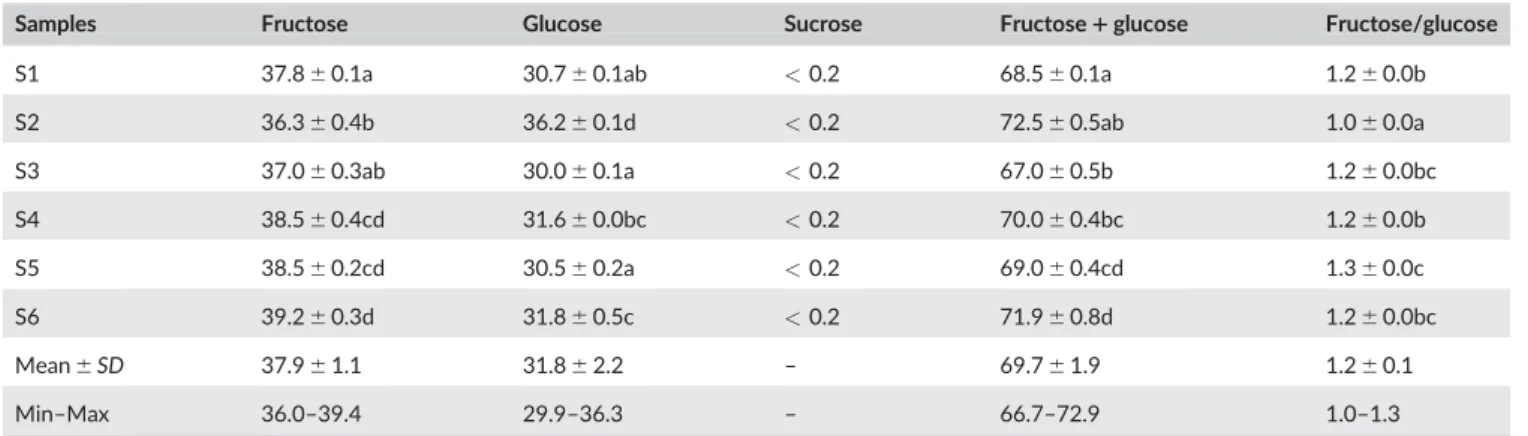
The total fructose and glucose content present in the honey
sam-ples ranged from 67.0% in S3 to 72.5% in S2 (Table 4). These results
are in accordance with those reported by other authors for honey
sam-ples from Morocco with different floral origin (Aazza et al., 2014) or
from other regions (Aazza et al., 2013; Anjos, Campos, et al., 2015;
Shin & Ustunol, 2005). In addition, and according to the results
obtained, all the samples had the minimal concentrations required for
blossom honeys (>60%) (Codex Alimentarius, 2001).
All the samples have higher amounts of fructose than glucose,
how-ever, one sample (S2) had practically the same amount of both. Codex
Ali-mentarius (2001) established 5% as maximal limit for sucrose in honey,
which was the case of the analyzed samples, with values below 0.2%.
Table 5 depicts the concentration of some minerals present in
honey samples from Morocco. The total mineral content was always
<1% (0.3–0.8%), with potassium present in higher amounts in
practi-cally all samples with the exception of sample S6, in which Na prevailed
(Table 5). The percentages of potassium ranged from 49.34 mg/kg, in
S6, to 607.24 mg/kg, in S1. Calcium and sodium were quantitatively
the second most representative minerals in the samples. Sample S4
showed the highest concentrations of calcium and sodium (188.02 and
252.25 mg/kg, respectively). Magnesium was the fourth most
abun-dant, with S4 presenting the highest concentration (30.32 mg/kg). The
most elevated amounts of iron were found in samples S1 (6.92 mg/kg)
and S5 (5.38 mg/kg). Zinc and copper, and particularly manganese
were in lower amounts in all the samples when compared to the
remaining mineral reported earlier. All the data is within the values
gen-erally reported for honey samples (Solayman et al., 2016 and
referen-ces therein). Usually the variability in the individual amounts of
minerals in the analyzed honey samples can be attributed to
differen-ces in floral type and soil composition (Solayman et al., 2016).
However, in this work the variability seen in almost all the
ana-lyzed parameters cannot be explained by the variability of theEragostis
spp. pollen ratios, suggesting its small nectar production or the nectar
in itself is diluted nectar. This feature may question the monoflorality
of those samples, and suggest the need of more pollen percentage to
have the monofloral label.
3.3
|Antioxidant activity
The antioxidant activities of the honey samples were measured using
five different methods: three assays assessed the capacity for
scaveng-ing free radicals (DPPH, ABTS, and superoxide), one assay assessed the
capacity for chelating metal ions, and lastly one assay that determined
the capacity of samples for reducing Fe(III) to Fe(II), in the test known
as reducing power. The results are shown in Table 3 and Figure 1.
Sample 3 (S3) always had lower IC50 values than the remaining
samples, independent on the method used, which indicates that it has
the best capacity for scavenging free radicals and chelating metal ions.
The capacity for reducing Fe(III) to Fe(II) is also better for S3 (Figure 1).
In contrast, S5 was unable to scavenge ABTS and DPPH free radicals,
at least at the concentrations assayed. TA B L E 4 Sugar content (g/100 g) in sixEragrostisspp. honey samples from Morocco
Samples Fructose Glucose Sucrose Fructose1glucose Fructose/glucose
S1 37.860.1a 30.760.1ab <0.2 68.560.1a 1.260.0b
S2 36.360.4b 36.260.1d <0.2 72.560.5ab 1.060.0a
S3 37.060.3ab 30.060.1a <0.2 67.060.5b 1.260.0bc
S4 38.560.4cd 31.660.0bc <0.2 70.060.4bc 1.260.0b
S5 38.560.2cd 30.560.2a <0.2 69.060.4cd 1.360.0c
S6 39.260.3d 31.860.5c <0.2 71.960.8d 1.260.0bc
Mean6SD 37.961.1 31.862.2 – 69.761.9 1.260.1
Min–Max 36.0–39.4 29.9–36.3 – 66.7–72.9 1.0–1.3
Values in the same column followed by the same letter are not significant different (p<.05) by the Tukey’s multiple range test. Abbreviations (Mean6SD5Means6standard deviation; Min–Max5Minimal–maximal).
In general, the antioxidant activity of honey samples depends on
the honey floral origin, due to the differences in the content of
poly-phenolics and enzyme activities (Alvarez-Suarez et al., 2010, 2013;
Sousa et al., 2016). However, differences in the activities and the
poly-phenol content were already reported by Aazza et al. (2014) for the
several monofloral thyme honeys and monofloral jujube honeys from
Morocco. The authors attributed such results to the different
geo-graphic origins from where samples had been collected. In the present
work, the geographic origin is the same; nevertheless, differences were
detected in the antioxidant activity as well as in other parameters
already discussed above. Such results indicate that even in the same
region, honeybees of diverse beekeepers have different plants available
to visit. Melissopalynological analysis gave us this information (Table 1).
Furthermore, the variability observed in the grain pollen ofEragrostis
spp. does not explain the variability seen in the antioxidant activity
results, suggesting the hypothesis that this honey type needs more
Era-grostisspp. pollen percentage to be labeled as monofloral honey.
A negative correlation between total polyphenols, proline amounts,
and IC50values (Table 6) determined when analyzing the capacity for
scavenging free radicals, demonstrates the importance of these
com-pounds on the found activity. The correlation between polyphenols
and antioxidant activity was previously reported (Aazza et al., 2013,
2014; Alvarez-Suarez et al., 2010). The negative correlation between
IC50values and proline content may reveal an important role of this
amino acid on the capacity for scavenging free radicals. Antioxidant
activity of some amino acids (histidine, taurine, glycine, alanine, proline)
has been reported (Meda, Lamien, Romito, Millogo, & Nacoulma, 2005;
Wu, Shiau, Chen, & Chiou, 2003).
A positive correlation between color and antioxidant activity and a
negative correlation between melanoidin and antioxidant activity (Table
6) were also observed in the present work and also previously reported
(Aazza et al., 2014), in Morrocan honeys of different floral origins.
An overview made by some authors (Maurya, Kushwaha, Singh, &
Singh, 2014) on antioxidant activity of honeys from different flora and
geographical origins showed a great variability in the abilities for
scav-enging DPPH and ABTS free radicals. The capacity for scavscav-enging
ABTS free radicals by Portuguese honeys, independent on the floral
origin, was superior to those of the present work (Aazza et al., 2013).
TA B L E 5 Mine ra l con tent (mg/k g) in six Eragrost is spp. hon eys from Mor occo Samples Ca Na Mg K Fe Zn Cu Mn Sum S1 59.05 6 1.08 de 64.41 6 0.47 c 13.80 6 0.55 d 607.27 6 1.25 a 6.92 6 0.06 a 1.50 6 0.02 b 1.80 6 0.02 a 0.35 6 0.00 c 755.11 6 208.87 d S2 67.00 6 1.04 d 37.67 6 0.13 e 13.44 6 1.11 d 327.62 6 0.82 c 3.41 6 0.09 e 0.69 6 0.00 e 0.87 6 0.00 e 0.33 6 0.05 d 451.03 6 112.13 e S3 103.21 6 1.30 c 42.60 6 0.23 d 27.39 6 2.21 b 266.75 6 0.65 d 2.23 6 0.04 f 2.21 6 0.02 a 1.70 6 0.08 b 0.92 6 0.06 a 447.30 6 92.10 c S4 188.02 6 6.80 a 252.25 6 0.59 a 30.32 6 0.60 a 331.84 6 1.28 b 3.93 6 0.05 c 1.16 6 0.02 d 1.34 6 0.06 c 0.91 6 0.06 a 809.76 6 135.26 a S5 57.13 6 1.90 e 24.23 6 0.12 f 8.05 6 0.28 e 251.95 6 2.05 e 5.38 6 0.05 b 0.49 6 0.00 f 0.94 6 0.07 d 0.27 6 0.02 e 348.44 6 86.39 f S6 115.48 6 5.38 b 148.74 6 0.982 b 21.57 6 0.46 c 49.34 6 0.98 f 3.61 6 0.07 d 1.38 6 0.02 c 0.62 6 0.05 f 0.57 6 0.00 b 341.31 6 58.33 b Mean 6 SD 98.32 6 50.16 94.98 6 88.99 21.57 6 8.75 305.79 6 180.13 4.25 6 1.66 1.29 6 0.72 1.21 6 0.48 0.56 6 0.29 525.49 6 205.16 Min – Max 57.13 – 188.02 24.23 – 252.25 8.05 – 30.32 49.34 – 607.27 2.23 – 6.92 0.49 – 2.21 0.62 – 1.80 0.27 – 0.92 341.31 – 809.76 Values in the same column followed by the same letter are not significant different ( p < .05) by the Tukey ’ s multiple range test. Abbreviations (Means 6 SD 5 Mean 6 standard deviation; Min – Max 5 Minimal – maximal).
The values found in the present work were within the range detected
for Moroccan honeys, regardless of the floral origin (Aazza et al., 2013).
Since the methodology followed in all assays was the same because
they were performed by the same team in the same laboratory, we can
conclude that for the same floral origin of honeys, the geographical
ori-gin has a very important role on the antioxidant activity. Such is in
accordance to that observed in the present work: for the same floral
origin of honeys (predominance ofEragrostisspp. pollen), diverse
activ-ities were found.
3.4
|Variance explained by principal component
analysis
The data of all measured parameters were subjected to the principal
component analysis (PCA). As a first step, all the variables were used to
run the PCA (data not showed), and only the variables correlating the
resulted factors with, at least, 0.7 as second step were chosen. The
results are shown in the Figure 2, where the first two principal
compo-nents accounted for 72.7% of the total variance, however, in the third
component (total of 87.3%) the content of K and Fe with the DPPH
free radicals correlated well.
The plot of the honey samples in the plane defined by the two
components exhibits the separation of all samples reported a variability
between samples. The first component split into two groups (Group 1:
S2, S5, and S6; Group 2: S1, S3, and S4). The second component which
accounted for 26.9% of the total variance, separated samples S4 and
S6 from the others. In fact, the two components are responsible for
dif-ferent groups of characteristics of honey. Component 1 correlated well
the ash content, acidity, proline, melanoidins, phenols, and flavonoids
content and the minerals Mg, Zn, Cu, and Mn together and superoxide
in inverse order. The sample S3 was characterized by a higher amount
in these components (Figure 2).
TA
B
L
E
6
Pe
arson
correl
ation
coeff
icient
s
Proline
Melanoidins
Phenols
ABTS
Chelating
DPPH
Superoxide
Color
(Pfund)
Proline
1
Melanoidins
0.959
a
1
Phenols
0.969
a
0.985
a
1
ABTS
2
0.717
a
2
0.854
a
2
0.856
a
1
Chelating
2
0.648
a
2
0.541
b
2
0.625
a
0.633
b
1
DPPH
2
0.658
a
2
0.779
a
2
0.769
a
0.710
a
–
1
Superoxide
2
0.915
a
2
0.954
a
2
0.936
a
0.907
a
0.633
a
0.653
a
1
Color
(Pfund)
0.834
a
0.931
a
0.861
a
2
0.767
a
–
2
0.789
a
2
0.876
a
1
aCorrelation
is
significant
at
the
p
<
.01.
bCorrelation
is
significant
at
the
p
<
.05.
–
5
not
significant.
F I G U R E 2 Scatterplot of honey samples and measured parameters on the plane defined by the two first components of principal component analysis.
Note. ash5ash content; FAC5free acidity; LACA5lactonic acidity; TAC5total acidity; PROLINE5proline content;
MEL5melanoidins; PHENOLS5phenols content; FLA5flavonoids content; ABTS5ABTS radical scavenging; DPPH5DPPH free radicals; SUPE5superoxide; CHEL5chelating; mineral content5Ca; Na; Mg; K; Fe; Zn; Cu; Mn
Component 2 correlated well ABTS, chelating, Ca and Na and in
inverse order the lactonic acidity. Samples S1 and S5 have an important
amount of K and Fe and S4 and S6 have the higher values of ABTS
and DPPH.
4
|C O N C L U S I O N S
The analyzed samples showed great variability in their physicochemical
parameters, and antioxidant profiles, independently on the high
repre-sentability ofEragrostisspp. pollen species. The changes in the analyzed
parameters seem to be more sensitive to the secondary important
pol-len species, suggesting that the melliferous plant Eragrostisspp. is a
weak nectar delivering plants. In addition, to eliminate the hypothesis
of other possible influencing factors (meteorological) on nectar
secre-tion, further work needs to be carried out on several apicultural season
samples.
Approaching this honey type for possible industrial or medicinal
uses seems to be delicate, and high attention needs to be payed to
sec-ondary important pollen, and if possible apply a preliminary tool to
assess its antioxidant activity.
AC KN O W L ED G M EN T S
The authors thank to theCentro de Apoio Tecnologico Agro-Alimentar
de Castelo Branco(CATAA) for the equipment availability for sugar
determination. The authors would like to express their gratitude to
Isabele Salavessa (IPCB Languages centre) for the English revision.
The research unit Centro de Estudos Florestais is supported by the
Portuguese National Funding Agency for Science, Research and
Technology (Fundaç~ao para a Ci^encia e a Tecnologia–FCT), projects
UID/AGR/00239–2013, UID/BIA/04325/2013 – MEDTBIO, UID/
Multi/04326/2013 and UID/BIA/04050/2013.
CO N F L I C T O F I N TE R ES T
The authors declare no potential conflicts of interest with respect to
the research, authorship, and/or publication of this article.
O RCI D
Ofelia Anjos http://orcid.org/0000-0003-0267-3252
Maria G. Miguel http://orcid.org/0000-0003-2507-4228
RE F E RE N CE S
Aazza, S., Lyoussi, B., Antunes, D., & Miguel, M. G. (2013). Physico-chemical characterization and antioxidant activity of commercial Por-tuguese honeys.Journal of Food Science,78, 1159–1165.
Aazza, S., Lyoussi, B., Antunes, D., & Miguel, M. G. (2014). Physico-chemical characterization and antioxidant activity of 17 commercial Moroccan honeys.International Journal of Food Science Nutrition,65, 449–457.
Almeida-Muradian, L. B., Stramm, K. M., & Estevinho, L. M. (2014). Effi-ciency of the FT-IR ATR spectrometry for the prediction of the phys-icochemical characteristics ofMelipona subnitidahoney and study of the temperature’s effect on those properties.International Journal of
Food Science Technology,49, 188–195.
Alvarez-Suarez, J. M., Giampieri, F., & Battino, M. (2013). Honey as a source of dietary antioxidants: Structures, bioavailability and evi-dence of protective effects against human chronic diseases.Current
Medicinal Chemistry,20, 621–638.
Alvarez-Suarez, J. M., Tulipani, S., Díaz, D., Estevez, Y., Romandini, S., Giampieri, F., . . . Battino, M. (2010). Antioxidant and antimicrobial capacity of several monofloral Cuban honeys and their correlation with color, polyphenol content and other chemical compounds.Food
Chemical Toxicology,48, 2490–2499.
Anjos, O., Campos, M. G., Ruiz, P. C., & Antunes, P. (2015). Application of FTIR-ATR spectroscopy to the quantification of sugar in honey.
Food Chemistry,169, 218–223.
Anjos, O., Iglesias, C., Peres, F., Martínez, J., García, A., & Taboada, J. (2015). Neural networks applied to discriminate botanical origin of honeys.Food Chemistry,175, 128–136.
Bettar, I. M., Gonzalez-Miret, L., Hernanz, D., Marconi, A., Heredia, F. J., & Terrab, A. (in press). Characterisation of Moroccan Spurge ( Euphor-bia) honeys by their physicochemical characteristics, mineral contents and colour.Arabian Journal of Chemistry, http://dx.doi.org/10.1016/j. arabjc.2015.01.003
Bogdanov, S. (2002). Harmonized methods of the international honey com-mission. Retrieved from http://www.apiculturacluj.com/ApiculturaCluj/ italiano/Documents/IHCmethods_e.pdf
Brand-Williams, W., Cuvelier, M. E., & Berset, C. (1995). Use of free radi-cal method to evaluate antioxidant activity.Lebensmittel-Wissenschaft
& Technologie,28, 25–30.
Brudzynski, K., & Miotto, D. (2011). The recognition of high molecular weight melanoidins as the main components responsible for radical-scavenging capacity of unheated and heat-treated Canadian honeys.
Food Chemistry,125, 570–575.
Codex Alimentarius. (2001). Revised Codex standard for Honey, Codex STAN 12–1981, revisions 1987 and 2001.
da Silva, R. M., Gauche, C., Gonzaga, L. V., & Costa, A. C. O. (2016). Honey: Chemical composition, stability and authenticity. Food
Chemistry,196, 309–232.
Diez, M. J., Andres, C., & Terrab, A. (2004). Physicochemical parameters and pollen analysis of Moroccan honeydew honey. International
Journal of Food Science and Technology,39, 167–176.
Elamine, Y., Aazza, S., Lyoussi, B., Antunes, M. D., Estevinho, L. M., Anjos, O.,. . .Miguel, M. G. (2017). Preliminary characterization of a Moroccan honey with a predominance ofBupleurum spinosumpollen.
Journal of Apicultural Research, https://doi.org/10.1080/00218839.
2016.1265759
El-Sohaimy, S. A., Masry, S. H. D., & Shehata, M. G. (2015). Physico-chemical characteristics of honey from different origins. Annals of
Agricultural Science,60, 279–287.
Escuredo, O., Míguez, M., Fernandez-Gonzalez, M., & Seijo, M. C. (2013). Nutritional value and antioxidant activity of honeys produced in an European Atlantic area.Food Chemistry,138, 851–856.
EU Council. (2002). Council directive 2001/11 O/EC of 20 December 2001 relating to honey.Official Journal of European Communities,10, 47–52.
Fallico, B., Arena, E., Verzera, A., & Zappala, M. (2006). The European food legislation and its impact on honey sector. Accreditation and
Quality Assurance,11, 49–54.
Feas, X., Pires, J., Estevinho, M. L., Iglesias, A., D. E., & Araujo, J. P. P. (2010). Palynological and physicochemical data characterization of honeys produced in the Entre-Douro e Minho region of Portugal.
International Journal of Food Science & Technology,45, 1255–1262.
monofloral honeys by ash contents through a hierarchical design.
Journal of Food Composite Analysis,17, 737–747.
Gomes, S., Dias, L. G., Moreira, L. L., Rodrigues, P., & Estevinho, L. (2010). Physico-chemical, microbiological and antimicrobial properties of commercial honeys from Portugal. Food Chemical Toxicology, 48, 544–548.
Hermosín, I., Chicon, R. M., & Cabezudo, M. D. (2003). Free amino acid composition and botanical origin of honey. Food Chemistry, 83, 263–268.
K€uç€uk, M., Kolayl, S., Karaoglu, S., Ulusoy, E., Baltac, C., & Candan, F. (2007). Biological activities and chemical composition of three honeys of different types from Anatolia.Food Chemistry,100, 526–534.
Louveaux, J., Maurizio, A., & Vorwohl, G. (1978). Methods of melissopali-nology.Bee World,59, 139–157.
Malika, N., Mohamed, F., & Chakib, E. A. (2005). Microbiological and physico-chemical properties of Moroccan honey.International Journal
of Agricultural Biology,5, 773–776.
Manzanares, A. B., García, Z. H., Galdon, B. R., Rodríguez, E. R., & Romero, C. D. (2014). Physicochemical characteristics of minor monofloral honeys from Tenerife, Spain. LWT – Journal of Food
Science Technology,55, 572–578.
Maurya, S., Kushwaha, A. K., Singh, S., & Singh, G. (2014). An overview on antioxidative potential of honey from different flora and geographical origins.Indian Journal of National Productive Research,5, 9–19.
Meda, A., Lamien, C. E., Romito, M., Millogo, J., & Nacoulma, O. G. (2005). Determination of the total phenolic, flavonoid and proline contents in Burkina Fasan honey, as well as their radical scavenging activity.Food Chemistry,91, 571–577.
Mendes, E., Proença, E. B., Ferreira, I. M. P. L. V. O., & Ferreira, M. A. (1998). Quality of evaluation of Portuguese honey.Journal of
Carbo-hydrates Polymer,37, 219–223.
Miguel, M. G., Nunes, S., Dandlen, S. A., Cavaco, A. M., & Antunes, M. D. (2010). Phenols and antioxidant activity of hydro-alcoholic extracts of propolis from Algarve, South of Portugal. Food and
Chemical Toxicology,48, 3418–3423.
Moujanni, A., Essamadi, A. K., & Terrab, A. (2017). L’apiculture au Maroc: Focus sur la production de miel. Beekeeping in Morocco: Focus on honey production.International Journal of Innovative Applied Studies,
20, 52–78.
Moussa, A., Saad, A., & Noureddine, D. (2012). How honey acts as an antioxidant?.Medicinal & Aromatic Plants,1, e121. https://doi.org/10. 4172/2167-0412.1000e121
Naab, O. A., Tamame, M. A., & Caccavari, M. A. (2008). Palynological and physico-chemical characteristics of three unifloral honey types from cen-tral Argentina.Spanish Journal of Agricultural Research,6, 566–576.
Proposal COM/95/0722. (1996, August 9). Amendments to prior Council Directive relating to honey (COM(95)0722 - C4-0403/96 - 96/0114 (CNS)), European Parliament, 9th December, 1997.
Rao, P. V., Salleh, N., & Gan, S. H. (2016). Biological and therapeutic effects of honey produced by honey bees and stingless bees: a com-parative review.Brazilian Journal of Pharmacognosy,26, 657–664.
Rodríguez, B. A., Mendoza, S., Iturriga, M. H., & Casta~no-Tostado, E. (2012). Quality parameters and antioxidant and antibacterial proper-ties of some Mexican honeys.Journal of Food Science,71, 121–127.
Rosa, A., Tuberoso, C. I. G., Atzeri, A., Melis, M. P., Bifulco, E., & Dessì, M. A. (2011). Antioxidant profile of strawberry tree honey and its
marker homogentisic acid in several models of oxidative stress.Food
Chemistry,129, 1045–1053.
Sakanaka, S., & Ishihara, Y. (2008). Comparison of antioxidant properties of persimmon vinegar and some other commercial vinegar in radical-scavenging assays and on lipid oxidation in tuna homogenates.Food
Chemistry,107, 739–744.
Samatha, T., Shyamsundarachary, R., Srinivas, P., & Swang, N.,R. (2012). Quantification of total phenolic and total flavonoid contents in extracts ofOroxylum indicumL.Kurz Asian Journal of Pharmaceutical
and. Clinical Research,5, 177–179.
Sancho, M. T., Pascual-Mate, A. N. A., Rodríguez-Morales, E. G., Oses, S. M., Escriche, I., Periche,A., & Fern andez-Mui~no, M. A. (2016). Critical assessment of antioxidant related parameters of honey.International
Journal of Food Science & Technology,51, 30–36.
Shin, H.-S., & Ustunol, Z. (2005). Carbohydrate composition of honey from different floral sources and their influence on growth of selected intestinal bacteria: An in vitro comparison. Journal of Food
Research International,38, 721–728.
Silva, T. M. S., Dos Santos, F. P., Evangelista-Rodrigues, A., da Silva, E. M. S., da Silva, G. S., de Novais, J. S., & Camara, C. A. (2013). Pheno-lic compounds, melissopalynological, physicochemical analysis and antioxidant activity of jandaíra (Melipona subnitida) honey.Journal of
Food Composites Analysis,29, 10–18.
Singleton, V. L., & Rossi, J. A. Jr. (1965). Colorimetry of total phenolics with phosphomolybdic-phosphotungstic acid reagents. American
Journal of Enology Viticulture,16, 144–158.
Soares, J. R. A. S. (1996). Constituiç~ao polifenolica e actividade
antioxi-dante de extractos de Thymus zygis(Master’s thesis). Universidade de
Coimbra, Coimbra.
Solayman, Md., Islam, Md., Paul, S., Ali, Y., Khalil, Md., Alam, N., & Gan, S. H. (2016). Physicochemical properties, minerals, trace elements, and heavy metals in honey of different origins: A comprehensive review. Comprehensive Reviews in Food Science and Food Safety,15, 219–233.
Sousa, J. M., DE Souza, E. V., Marques, G., Meireles, B., Cordeiro, A. T. M., Gullon, B.,. . .Magnani, M. (2016). Polyphenolic profile and anti-oxidant and antibacterial activities of monofloral honeys produced by
Meliponini in the Brazilian semiarid region.Journal of Food Research
International,84, 61–68.
Terrab, A., Vega-Perez, J. M., Díez, M. J., & Heredia, F. J. (2002). Characterisation of northwest Moroccan honeys by gas chromatographic-mass spectrometric analysis of their sugar components.
Journal of the Science of Food and Agriculture,82, 179–185.
Wilczynska, A. (2014). Effect of filtration on colour, antioxidant activity and total phenolics of honey.Journal of Food Science Technology,57, 767–774.
Wu, H. C., Shiau, C. Y., Chen, H. M., & Chiou, T. K. (2003). Antioxidant activities of carnosine, anserine, some free amino acids and their combination.Journal of Food Drug Analysis,11, 148–153.
How to cite this article:Aazza S, Elamine Y, El-Guendouz S, et al. Physicochemical characterization and antioxidant activity
of honey with Eragrostis spp. pollen predominance. J Food
Biochem. 2018;42:e12431.https://doi.org/10.1111/jfbc.12431