UNIVERSIDADE DE LISBOA
FACULDADE DE CIÊNCIAS
DEPARTAMENTO DE BIOLOGIA VEGETAL
Analysis of genomic changes during adaptive evolution in
Drosophila subobscura populations of contrasting biogeographical
history
Marta Maria Alves Antunes
Mestrado em Bioinformática e Biologia Computacional
Especialização em Bioinformática
Dissertação orientada por:
Margarida Maria Demony de Carneiro Pacheco de Matos
Sofia Gonçalves Seabra
Index
Agradecimentos...iii
Resumo...iv
Abstract...vii
List of Figures...viii
List of Tables...ix
List of abbreviations...x
1. Introduction...1
1.1 Genomic approaches to study adaptive evolution in experimental evolution...1
1.2 Impact of history in adaptive evolution...1
1.2.1. General introduction to Drosophila subobscura...2
1.2.2. Impact of contrasting genetic backgrounds on evolution at the phenotypic level...3
1.2.3. Impact of contrasting backgrounds at the karyotypic level...4
1.2.4. Impact of contrasting backgrounds at the genome-wide level using Pool-seq...5
1.3 Aims and Dissertation Structure...5
2. Pool-sequencing...7
2.1. Introduction...7
2.2. Material and Methods...8
2.2.1. Gene Ontology analysis...8
2.2.2. Type of substitution analysis...9
2.2.3. DsubSeqLoc Database...10
2.3. Results...11
2.3.1. Characterization of SNPs...11
2.3.2. Database...12
3. RAD-sequencing...13
3.1. Introduction...13
3.2. Material and Methods...14
3.2.1. Biological material and RAD-sequencing...14
3.2.2. RAD-seq analysis...15
3.2.3. Pipeline for removal of chcu haplotypes...16
3.2.4. Statistical analysis of RAD-seq data...16
3.2.5. Linkage disequilibrium analysis...17
3.3 Results...17
3.3.1. Assessing missing data and distribution of SNPs per locus...17
3.3.2. Pipeline...18
3.3.3. Analyses of RAD-sequencing data...19
3.3.4. Analysis of chromosome O...21
3.3.4.1. Analysis of chromosomes with O3+4 arrangement...21
3.3.4.2. Analysis of chromosomes with OST inversion...25
3.3.5 Analysis of chromosome A...28
3.3.5.1. Analysis of Chromosomes with inversion A2...28
4. General Discussion...32
4.1. Main Achievements...32
4.2. Comparing the conclusions of the Pool-seq and the RAD-seq data...35
4.3. Future perspectives...36
References...37
Agradecimentos
Com a conclusão desta etapa do meu percurso académico, não podia deixar de agradecer a todas as pessoas que me apoiaram e contribuíram para a realização deste trabalho que foi o culminar de dois anos intensos em termos de aprendizagem.
Em primeiro lugar gostava de agradecer às minhas orientadoras, a professora Margarida Matos e a professora Sofia Seabra, por toda a ajuda, paciência, apoio e disponibilidade. É com muita certeza que afirmo que poucas pessoas fariam o que elas fizeram, fizeram-me sentir parte da família, ajudaram-me em tantas coisas e de tantas formas que era impossível enumerá-las aqui. Queria também agradecer ao Pedro Simões por tudo o que me ajudou neste trabalho e à Inês Fragata que, embora já não esteja a trabalhar connosco, continua a fazer parte desta equipa porque está sempre pronta a discutir resultados e a dar e ouvir ideias acerca de novas experiências.
Um agradecimento especial queria dirigir ao Francisco-Pina Martins pela sua disponibilidade constante para me ajudar a lidar com o sistema operativo LINUX, à Ana Quina e à Ana Vieira pela ajuda na análise de Pool-sequencing e ao Mauro Santos pela sua intervenção na discussão sobre Linkage Disequilibrium. De não esquecer também o Vítor Sousa que tanto ajudou o nosso grupo.
Queria agradecer também a todos os professores que me deram aulas ao longo do ano curricular do mestrado pois foram eles que me iniciaram nesta viagem. Em particular gostaria de mencionar o professor Francisco Couto que me deu a oportunidade de colaborar em vários projectos de investigação onde trabalhei com a Márcia Barros e com o André Lamúrias. Um obrigado a eles também.
Em termos mais pessoais gostaria de agradecer à minha família e namorado Rúben Martins pelo apoio incondicional, principalmente nos momentos mais difíceis. Queria agradecer aos meus amigos, em especial às minhas queridas amigas da residência Laranjeiras, à Arsénia Massinga, Patrícia Abrantes, Telma Varela, Maria Martins, Sandrina Teixeira e Ana Rita Libório. Também queria agradecer à Dona Elvira e à equipa dos seviços informáticos da Faculdade de Ciências.
Finalmente gostaria de agradecer o financiamento deste projecto. As sequências analisadas nesta tese de mestrado foram obtidas em trabalhos anteriores apoiados pelos Fundos nacionais portugueses através da Fundação para a Ciência e Tecnologia, projeto PTDC / BIA-BIC / 2165/2012. Agradeço também ao Centro de Ecologia, Evolução e Alterações Ambientais (cE3c) e ao seu financiamento da FCT UID / BIA / 00329/2013 pelo suporte logístico e financeiro em comunicações extra-murais do trabalho realizado ao longo do ano.
Resumo
Um dos objectivos principais da biologia é entender como é que os organismos evoluem e se adaptam a novos ambientes. A prática de evolução experimental em laboratório é uma metodologia muito eficaz pois permite estudar a evolução a ocorrer em tempo real. Em alternativa a estudar a evolução na natureza, muitas vezes dificil de realizar, as populações são analisadas ao longo de gerações de evolução em ambiente controlado do laboratório. Desta forma, é muito mais fácil perceber quais as variáveis que podem estar envolvidas no processo evolutivo e evitar efeitos imprevisíveis exteriores à experiência. Também é possível manusear os indivíduos e controlar o seu acasalamento, garantindo desta forma a não ocorrência de troca de genes não pretendida entre populações. O aparecimento da possibilidade de sequenciar muitos indíviduos a baixos custos permitiu explorar esta temática da evolução de populações também ao nível genómico. Surgiram nomeadamente as técnicas de sequenciação genómicas de conjuntos (“pools”) de indíviduos (“Pool-sequencing”) e sequenciação de DNA associado a locais de restrição (“RAD-sequencing”). Estas duas técnicas foram usadas na obtenção de dados analisados neste trabalho. A abordagem usada chama-se “evolve and resequencing”, ou seja ”evoluir e resequenciar”, e significa que as populações são sequenciadas em vários momentos ao longo de diversas gerações, de forma a ser possível acompanhar alterações evolutivas que estejam a ocorrer no genoma dos indivíduos.
Neste trabalho foram analisadas as alterações genómicas ocorridas em duas populações de
Drosophila subobscura amostradas em dois locais europeus de latitudes contrastantes (Adraga, em
Sintra, Portugal e Groningen na Holanda) durante a sua adaptação ao ambiente do laboratório. A escolha desta espécie deveu-se ao facto de apresentar elevado polimorfismo ao nível de inversões cromossómicas no seu genoma e já ter sido observada, para as duas populações referidas anteriormente, convergência a nível fenotípico quando colocadas em laboratório mas não a nível da frequência das inversões.
Os arranjos cromossómicos (inversões) foram um destaque neste trabalho porque afectam a arquitectura genómica das populações ao reduzirem a recombinação nos locais onde se encontram. Foram indicados como também estando implicados na adaptação climática nesta espécie dado que a sua frequência varia de acordo com a latitude onde se encontram as populações que as possuem.
Na primeira parte do trabalho, caracterizei os polimorfismos nucleotídicos simples (SNPs) obtidos no estudo de “Pool-sequencing” que deram indicações de seleção, analisando os que foram reconhecidos como estando associados (i.e. que deram “hits”) a proteínas nestas duas populações. Detectei que muitos genes estão sob seleção nestas populações o que sugere uma base poligénica de adaptação. Também observei que estão envolvidos em processos biológicos distintos entre populações, reforçando a constatação de que as populações apesar de convergirem fenotipicamente o fazem por caminhos genéticos distintos. A única família de genes que foi encontrada sob seleção nas duas populações foi a famíla de genes do receptor gustativo, envolvido no reconhecimento de alimentos. Também caracterizei o tipo de mutação que cada SNP provoca e foi interessante descobrir que alguns dos SNPs sob seleção se encontram em pequenas regiões intrónicas.
A segunda parte do trabalho consistiu em analisar os dados obtidos por “RAD-sequencing”. As duas metodologias de sequenciação são complementares uma vez que a sequenciação genómica de “pools” de indivíduos permite obter mais marcadores de DNA mas sem informação individuals enquanto que usando enzimas de restrição se obtêm menos marcadores mas com informação
individual para muitos indivíduos separadamente. Esta última abordagem, permitiu observar que os indivíduos sequenciados estão mais separados pelas inversões que possuem do que pela população a que pertencem, ou seja, um indíviduo de uma população pode ser mais semelhante a um de outra população se possuir a mesma inversão no seu genoma.
Além disso, foram observadas as alterações genómicas em cromosomas com inversões específicas, tanto ao nível do total de SNPs detectados em cada cromosoma como também ao nível dos SNPs sob seleção. Como ilustração das potencialidades deste estudo, neste trabalho foram analisadas três arranjos cromossómicos, O3+4, OST e A2. Foram analisadas alterações entre gerações da mesma população mas também a diferenciação entre populações e como esta diferenciação entre populações evolui ao longo do tempo.
As análises dos cromosomas com a inversão A2 foram aquelas que permitiram uma mais robusta análise dos resultados devido ao número de indivíduos amostrados. Foi detectada maior diferenciação entre gerações nos SNPs da população de Groningen do que nos de Adraga, o que está de acordo com o que foi encontrado na análise de dados de Pool-seq onde a maioria dos SNPs candidatos nesta população se encontram no cromosoma A. Isto poderá indicar que o cromosoma A tem um papel fundamental na adaptação desta população ao ambiente do laboratório. O total de SNPs neste cromossoma não deu indicações de convergência entre as duas populações, pelo contrário sugerem divergência, i.e. aumento da diferenciação entre as populações ao longo do tempo. Um aspecto fundamental foi analisar até que ponto as populações dão indicação de terem uma dinâmica adaptativa semelhante a nivel genómico, ou se, pelo contrário, elas não convergem em SNPs com sinal de selecção. De facto, em concordância com dados de pool-seq, na análise dos cromossomas com inversão A2 foram detectados poucos SNPs comuns entre as duas populações a darem sinal de selecção. Como era de esperar, a diferenciação dos SNPs candidatos (i.e. aqueles que deram sinal de selecção) entre gerações foi maior na população para a qual os SNPs foram detectados. No entanto, os mesmos SNPs também responderam na outra população com alterações temporais superiores à diferenciação global de todos os SNPs, o que sugere que os SNPs que estão sob seleção numa populacão também podem estar, pelo menos em parte, na outra.
Comparando os resultados obtidos nas várias inversões/arranjos analisados, podemos dizer que não foi detectada convergência nem para o total de SNPs em cada cromosoma nem entre os SNPs sob seleção em cada cromosoma, o que indica que, em geral, estas populações usam diferentes vias a nível genómico para atingir o mesmo estado a nível fenotípico.
Este trabalho vem adicionar novos elementos para a questão dos mecanismos que levam à manutenção das inversões. Permite perceber que esta é uma questão complexa e portanto é necessária a realização de mais análises, nomeadamente análises de diferenciação nos outros cromossomas, análises de desequilíbrio de ligação (“linkage disequilibrium”) e o mapeamento de mais zonas do genoma.
Finalmente, ao nível de ferramentas bioinformáticas criadas, foram desenvolvidas duas que foram essenciais para a realização deste trabalho. Especificamente desenvolvi: uma base de dados que denominei DsubSeqLoc, que integra informação que estava dispersa na literatura, facilitando a localização cromossómica de sequências de genes de Drosophila subobscura já publicados, relevante quer em análises de dados de “Pool-seq” quer nos dados de “RAD-seq”; e uma “pipeline” que permite remover um dos haplótipos parentais do genótipo dos descendentes, necessário para a análise genómica das sequencias de RAD-seq.
A base de dados DsubSeqLoc permite armazenar num único local toda a informação que se conhece atualmente acerca da localização de sequências de Drosophila subobscura. A integração desta informação é essencial pois ainda não existe um genoma de referência completamente anotado para a espécie e vai crescer em tamanho e importância à medida que novas sequências vão sendo mapeadas. Prevê-se que esta base de dados vá contribuir muito para futuros estudos nesta espécie. Além disso, também foi criada uma página web (http://www-personal.fc.ul.pt/~mmmatos/DsubSeqLoc) que permite um fácil acesso à informação mesmo a utilizadores que não estejam familiarizados com a escrita de queries SQL. Por sua vez a “pipeline” criada no contexto desta dissertação permite remover um dos haplótipos parentais dos genótipo dos seus descendentes. No contexto desta tese foi uma ferramenta muito util na análise de dados de RAD-seq, pois o DNA extraído pertencia a larvas que resultaram do cruzamento das nossas populações com a linha homocariotípica chcu (protocolo usado na identificação das inversões), e apenas queríamos, obviamente, analisar os haplótipos das nossas populações. Por exemplo, no contexto deste trabalho, o DNA extraído pertencia a larvas que resultaram do cruzamento de uma população wild com a linha homocaritípica chcu, mas apenas queriamos analisar os haplótipos das populações wild. A pipeline serviu deste modo para simplificar o processo de eliminação dos haplótipos que não tinham interesse para o nosso estudo. Se não tivesse sido criada muitos programas individuais teriam de ser executados para obter os haplótipos de interesse. Além disso, a pipeline permite fazer um passo de filtragem e mantém os registos da quantidade de dados que foi filtrada. Além de tudo isto, a pipeline não apresenta especificidade para os nossos dados, podendo ser utilizada na realização de outros estudos. Estará assim disponivel a outros utilizadores, e.g. sempre que seja requerido retirar o haplótipo de um dos progenitores.
Este trabalho permitiu entender melhor o processo de adaptação ao nível genómico de populações de Drosophila subobscura. Este trabalho pioneiro abriu novos horizontes de investigação, deixando interessantes questões em aberto a abordar no futuro.
Palavras-chave: Drosophila subobscura, evolução e resequenciação, base de dados para localização de sequências, inversões cromossómicas, “RAD-sequencing”
Abstract
Experimental evolution is a powerful approach to study adaptation of populations in real-time. Using this approach, I studied at the genome-wide level the evolution of two populations of
Drosophila subobscura derived from two contrasting biogeographical latitudes (Adraga, Portugal and
Groningen, Netherlands), across generations since laboratory introduction. Modern sequencing technologies are now providing a high resolution in the analysis of patterns of genetic variation. In the context of this dissertation, I analyzed ‘evolve-and-resequence’ data (that is, genomic information across generations) of both populations obtained by Pool-sequencing and RAD-sequencing at two generations (6 and 25) after founding these populations in the common, laboratorial environment.
With the pool-seq data I characterized SNPs that indicated selection and gave hits with proteins. I discovered that many genes and different biological processes are at play, suggesting a polygenic basis of adaptation. Only one family of genes was found in common between the two populations, associated with recognition of taste stimuli. I also classified each SNP in the type of mutation and interestingly found several genes under selection in small intronic regions.
Chromosomal inversions may play an important role in genomic evolution and population differentiation, because they affect the genomic architecture of populations by suppressing or reducing recombination in these inverted regions. In the context of this thesis I analysed the RAD-sequencing data of many individuals with known karyotypes of both populations across generations. Interestingly, individuals were more clearly separated by the inversion they carry than by the population to which they belong. I compared the differentiation between generations and between populations both for all SNPs in each chromosome and for candidate SNPs (that gave signs of being under selection). Also, I analysed how the genetic differentiation between populations changed through time. I detected that candidate SNPs differed between populations, in accordance with what was already observed at the Pool-seq level. Nevertheless, the SNPs under selection in one population also suggested some selective response in the other, although to a smaller extent. It was not detected convergence between the two populations neither for total SNPs of each chromosome neither for candidate SNPs. Focusing on the chromosomes with A2 inversion there was a higher differentiation between populations than chromosomes with other inversions, considering the same period of time.
Furthermore, I developed two bioinformatic tools that were essential to make the analyses: a database called DsubSeqLoc (http://www-personal.fc.ul.pt/~mmmatos/DsubSeqLoc) that integrates information already published of the cytological location of genes or of other genomic regions in
Drosophila subobscura and a pipeline that removes one parental haplotype from the progeny.
Keywords: Drosophila subobscura, evolve and resequence, sequences location database, chromosomal inversions, RAD-sequencing
List of Figures
Figure 2.1 - Experimental design of the Pool-seq study.
Figure 2.2 - Protocol followed to make the Gene Ontology characterization of the genes.
Figure 2.3 - Protocol followed to make the classification of the type of mutation in each SNP region. Figure 2.4 - Barcharts with the higher level GO categories.
Figure 2.5 - Entity Relationship (ER) model of the DsubSeqLoc database constructed.
Figure 3.1 - Schematic of the cross that allowed to obtain that F1 larvae that were sequenced and RAD-Seq Schematic.
Figure 3.2 - Missing data per individual. Figure 3.3 - Missing data per locus.
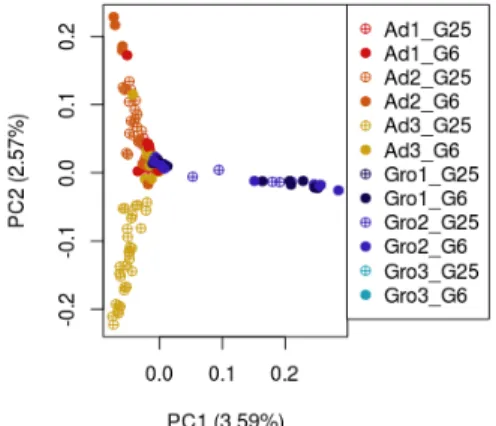
Figure 3.4 - Remove chcu haplotypes pipeline scheme. Figure 3.5 - Principal Component Analysis of SNP variation.
Figure 3.6 - Principal Component Analysis of SNP variation in each of the five chromosomes of
Drosophila subobscura.
Figure 3.7 - PCA of SNP variation in chromosomes with O3+4 arrangement.
Figure 3.8 - PCA of SNPs under selection variation in chromosomes with O3+4 arrangement.
Figure 3.9 - PCA of SNPs under selection variation (increase in just 1 replicate) in Gro of individuals with O3+4 arrangement.
Figure 3.10 - Linkage Disequilibrium in two scaffolds outside and inside arrangement. Figure 3.11 - PCA of individuals with OST inversion.
Figure 3.12 - PCA SNPs under selection Gro of individuals with OST inversion. Figure 3.13 - PCA of individuals with A2 inversion.
Figure 3.14 - PCoA using FST of individuals with A2 inversion.
Figure 3.15 - PCA of individuals with A2 inversion A)SNPs under selection Ad and B)SNPs under selection Gro.
Figure 3.16 - PCoA of individuals with A2 inversion A) SNPs under selection Ad and B) SNPs under selection Gro.
List of Tables
Table 2.1 - Number of candidate SNPs with significant protein hits and from these, those that are synonymous, non-synonymous or that are located in introns, for both Ad and Gro in short and long period.
Table 3.1 - Matrix of mean pairwise FST between groups of individuals for SNPs located in chromosomes with O3+4 arrangement.
Table 3.2 - Matrix of mean pairwise FST between groups of individuals for SNPs located in chromosomes with O3+4 arrangement and that show signs of selection in Ad and in Gro.
Table 3.3 - Matrix of mean pairwise FST between groups of individuals for SNPs located in chromosomes with O3+4 arrangement and that show signs of selection in Gro (frequency of the minor allele increasing in just one replicate).
Table 3.4 - Matrix of mean pairwise FST between groups of individuals for SNPs located in chromosomes with OST inversion.
Table 3.5 - Matrix of mean pairwise FST between groups of individuals for SNPs located in chromosomes with OST inversion and that show signs of selection in Gro
Table 3.6 - Matrix of mean pairwise FST between groups of individuals for SNPs located in chromosomes with A2 inversion.
Table 3.7 - Matrix of mean pairwise FST between groups of individuals for SNPs located in chromosomes with A2 inversion and that show signs of selection in Ad and in Gro.
List of abbreviations
We adopted the following nomenclature:
Ad - refers to population sampled in Adraga (Portugal) in 2010
Gro - refers to population sampled in Groningen (Netherlands) in 2010 G6 – Generation 6
G25 - Generation 25
PCA – Principal component analysis PCoA - Principal coordinates analysis Pool-seq – Pool-sequencing
RAD-seq – RAD-sequencing LD – Linkage Disequilibrium
FISH - Fluorescence In Situ Hybridization SNPs - Single Nucleotide Polymorphisms ER – Entity Relationship
FST - Fixation Index
1. Introduction
1.1 Genomic approaches to study adaptive evolution in experimental
evolution
Adaptive evolution - evolutionary changes that are adaptive - occurs not randomly but as a consequence of the changes in the genetic constitution of a population due to natural selection acting in specific features of the environment (Merilä and Hendry 2014). Such changes increase fitness of the individuals by addressing some specific challenges presented by the environment.
Experimental Evolution is a powerful approach to follow the previous mentioned changes in real time (Buckling et al. 2009). In particular the ‘evolve and resequence’ approach (Turner et al. 2011, Baldwin-Brown et al. 2014, Long et al. 2015, Schlötterer et al. 2015) revolutionized the studies in genomic evolution by analyzing the changes of DNA sequences in several time points in the course of an evolutionary process.
This is possible due to the increase in computational power as well as the arrival of several genome-wide sequencing approaches that made possible to sequence many individuals, allowing to detect many high reliable polymorphic makers at affordable price (e.g. Schlötterer et al. 2014). For example, pool-sequencing is an approach that consists in sequencing a mixture of genomes of several individuals, instead of sequencing each separately (Turner et al. 2011, Schlötterer et al. 2015, Bailey & Bataillon 2016). This approach allows obtaining allele frequency data, but individual information is lost, preventing linkage disequilibrium analysis. On the other hand, reduced-representation methods such as restriction associated DNA sequencing (RAD-seq), allow obtaining a large amount of individual data but for a smaller number of loci (Davey et al. 2011, Seeb et al. 2014).
Following the advances in sequencing technology, bioinformatic tools have also greatly improved and are essential to deal with the large amount of data generated (Yin et al. 2017). A lot of computational capacity is required to handle the increasing amount of data, databases to store it and efficient and scalable algorithms as well as statistical methods to process and analyze the data. In particular, several softwares have been and continue to be developed, for example, for genome assembly, sequencing alignments, gene finding, SNP identification and genotyping, or genome-wide association studies. Also there are now many available R libraries and python functions that make easier both the tasks of analyzing data and create new programs to deal with specific biological problems.
In the context of this dissertation, I applied several already developed bioinformatic tools, namely for gene ontology analysis (chapter 2), for sequence alignment, for SNP identification and analysis (chapter 3). I have also developed new bioinformatic tools, namely a database for published chromosomal locations of Drosophila subobscura genes which I called DsubSeqLoc (chapter 2) and a pipeline for removing parental haplotypes (chapter 3).
1.2 Impact of history in adaptive evolution
A relevant topic in evolution studies is the impact of historical differentiation in the outcome of evolution. Historical differentiation (either populations that have become different over time during the study (Blount et al. 2008) or initially differentiated populations when the study starts) may have an impact because random and deterministic processes become interconnected over time, and the
occurrence of future mutations as well as the selective value of existing variants from standing genetic variation may be contingent on the prior history of the population (Jacob et al. 1977, Conte et al. 2012, Lobkovsky & Koonin 2012, Orgogozo 2015).
One evidence of the impact of historical contingencies that arise because similar populations are accumulating different mutations and become somehow differentiated is shown by Blount et al. (2008). Other studies take advantage of initial differentiation between populations, analyzing how much populations converge when evolving under similar conditions. It is expected that ‘uniform selection’ leads to convergent evolution of laboratory replicated populations and there are several studies that report that (Travisano et al. 1995, Teotónio & Rose, 2000, Spor et al. 2014). Nevertheless this is not always the case, and other studies show that contrasting histories and chance events might prevent convergence from happen. For example, Cohan & Hoffmann (1986, 1989) observed lack of convergence in Drosophila melanogaster populations and Plucain et al. (2016) found the same effect for both the growth rate and fitness in Escherichia coli. Interestingly, in some cases, convergence is observed at one level but not at the other. Teotónio et al. (2009) observed convergence at phenotypic level, not fully seen at genetic level.
Nevertheless, most studies that report convergent evolution with selection erasing historical signatures were done using lines recently derived from the same ancestral population. This highlights the importance of enlarging the studies to highly differentiated lines, derived from long-term differentiated ancestral populations. This has been the major focus of the studies of Drosophila
subobscura in the “Local adaptation in Drosophila” laboratory where the present study was conducted.
The effects of history of the Drosophila subobscura laboratorial populations, derived from natural populations from the extremes of the European latitudinal cline, in their adaptation to a new common environment has been studied by the team where this master thesis was developed, at both the phenotypic (Fragata et al. 2014b, Simões et al. 2017), karyotypic (Fragata et al. 2014a, Simões et al. 2017) and genomic levels (Seabra et al. 2017).
1.2.1. General introduction to Drosophila subobscura
Drosophila subobscura is a species of fruit fly that has been the focus of many studies because
it presents many chromosomal arrangements (inversions), with latitudinal clinal variation, repeatable across Europe, as well as North and South America (Prevosti et al. 1988, Ayala et al. 1989, Huey et al. 2000, Gilchrist et al. 2004). Several studies in laboratory indicate that this variation is linked to thermal adaptation (Rego et al. 2010, Rezende et al. 2010), though the actual genetic and evolutionary mechanisms are still unknown (e.g. Santos et al. 2005).
The karyotype of Drosophila subobscura is composed of five pairs of acrocentric chromosomes (named A, E, J, O and U) and one very small dot. The five pairs of chromosomes mentioned are polymorphic and present latitudinal clines at the genetic level, while the dot chromosome is not polymorphic (Prevosti et al. 1988).
This species is abundant in the Palearctic region, but in 1978 it also appeared in Chile and shortly after spread into Argentina and North America. The source of the colonizers remains uncertain, although all evidence indicates that both the North American and the South American colonizers derived from the same Palearctic population from western Mediterranean or northern European (Ayala et al. 1989).
In a short time period after colonization took place, clines in many chromosomal arrangements evolved in America with identical latitudinal polarity with those found in Europe. This identical polarity in such distant places at the same latitude seems to be a strong evidence that the polymorphisms and the clines are adaptive (Ayala et al. 1989) and are associated with temperature changes (Rego et al. 2010, Rezende et al. 2010). Latitudinal clines in inversion polymorphisms such as these were also found in other species like Drosophila melanogaster (Kapun et al. 2016), Anopheles
gambiae (Fouet et al. 2012) and others. These findings corroborate the adaptive value of inversion
polymorphisms, but other factors, like hybridization, founder events, admixture, secondary contact and restricted gene flow may cause the same pattern (Vasemägi 2006, Bergland et al. 2015, Flatt 2016).
Molecular studies in Drosophila subobscura also highlight an important impact of chromosomal inversions in genetic patterns of variation (Munté et al. 2005, Simões et al. 2012, Pegueroles et al. 2013, Santos et al. 2016). For example, Simões et al. (2012) found clear genetic differentiation between inversions and also genetic uniformity within chromosomal inversion across a large latitudinal gradient that experiences highly diverse environmental conditions. Santos at al. (2016) studied how the genetic content of inversions evolves during laboratory adaptation, finding evidence of selective changes in the frequency of inversions for seven of 23 chromosomal arrangements, adding further evidence that inversions play a role in adaptation.
The important role of inversions was also shown in other species like Drosophila
pseudoobscura (Dobzhansky & Epling 1948, Fuller et al. 2016), the silkworm Bombyx mori (Ito et al.
2016) or Anopheles funestus, the mosquito responsible for malaria disease (Kamdem et al. 2017). Despite the conclusions of these and many other studies, the mechanisms underlying the evolution of inversions are still not fully understood (Hoffmann and Rieseberg 2008). One important feature of the inversions that is important in their evolution is the reduction of recombination between chromosomes harboring different inversions.
Although there are many genetic studies in Drosophila subobscura, including some with the localization of the breakpoints surrounding inversions, there is still no full assembled genome available.
1.2.2. Impact of contrasting genetic backgrounds on evolution at the
phenotypic level
To assess the impact of contrasting genetic backgrounds in the adaptation of Drosophila
subobscura populations to the common environment of the laboratory, Fragata et al. (2014b) studied
patterns of phenotypic evolution in populations of Drosophila subobscura derived from natural populations located at three European latitudes: one northern (Groningen, Netherlands), one intermediate (Monpellier, France) and one southern (Adraga, Portugal). Collections of flies from the different places were brought to the laboratory founding three-fold replicated laboratorial populations that were studied in real-time ever since.
All populations were maintained with synchronous generations of 28 days, census sizes between 500 and 1200 individuals, photoperiod of 12L:12D and temperature of 18°C . Fragata et al. (2014b) observed high initial differentiation between populations with the Groningen populations having better performance for all life-history traits analyzed, as well as higher starvation resistance and bigger body size.
Throughout generations the fecundity of populations improved considerably and the values presented by each of them became similar. In fact, after only fourteen generations the recently
introduced populations fully converged between them and towards the values of the control (a long established population from Adraga, already in the laboratory for more than 100 generations when the study started). Evolutionary convergence was also seen in starvation resistance, with the Groningen populations, initially with higher values, showing a decrease to the values of both the other recently introduced populations and the control. Finally body size of the flies from Adraga and Montpellier increased to the values of Groningen flies. Overall, then, there was convergence for all phenotypic traits analyzed. Concomitant with this evolutionary convergence, populations showing larger early differentiation relative to the controls presented higher evolutionary rate.
Three years later Simões et al. (2017) conducted another study of real-time laboratory evolution of populations derived from the same locations in Adraga and Groningen, showing that convergent evolution was in general repeatable (predictable) across years, except for body size.
In balance these studies show that in general the sign of history vanishes as time goes by for both life-history and physiological (starvation resistance) traits and that the effect of selection gets stronger with time for life-history traits (further details on Fragata et al. 2014b). Also it is noteworthy that chance events appear to have a bigger role during evolution of starvation resistance than of early fecundity, based on variance components assessed throughout time for these two phenotypic traits.
1.2.3. Impact of contrasting backgrounds at the karyotypic level
Given the high level of polymorphism and the clinal differentiation between D. subobscura populations in chromosomal inversions frequencies, a question naturally arise: Do populations converge at the inversion polymorphisms frequencies? Fragata et al. (2014a) addressed this question by analyzing the evolutionary patterns of inversion frequency changes and the impact of evolutionary forces in these changes.
As expected the authors detected high initial differentiation between populations for inversion frequencies at initial generations, reflecting the effect of clinal variation on the geographical origin of the populations. There was variation in the levels of polymorphism between chromosomes, with less variation in the A and J chromosomes. Though the levels of heterozygosity did not differ between populations, allele richness did. Both parameters declined throughout generations.
One important finding was that the populations remained overall differentiated in frequencies of chromosomal inversions, even after 40 generations in the laboratory, in spite the fact that for several inversions selection was involved. Altogether, this indicates that the historical differentiation between foundations at the level of the karyotype had an overall impact on the evolutionary dynamics of inversions in the laboratory.
Simões et al. (2017) also studied at the karyotypic level the populations sampled from the same localities in 2013. They found that initial chromosomal inversion frequencies differed between locations but not between years, meaning that in these three years interval there was no significant differences in inversion frequencies in the sampling from the wild.
All populations exhibited significant changes in inversion frequencies between initial and final generations assayed in the laboratory. After 23/25 generations in the lab, differences between locations remained significant. One interesting difference between studies is that the populations founded in 2013 presented a significant reduction of differences throughout generations, not observed in the populations sampled in 2010 (Simões et al. 2017).
1.2.4. Impact of contrasting backgrounds at the genome-wide level using
Pool-seq
After observing convergence of the populations founded in laboratory in 2010 at the phenotypic level but not at the karyotypic level (Fragata et al. 2014a, b) a new question arose: what happened at the genome-wide level in these populations? To answer that question, a genome-wide approach using pool-sequencing methodology was carried out by Seabra et al. (2017), focusing on the Adraga (called Ad) and Groningen (labeled Gro) populations. Samples of each population from four generations (1, 6, 25 and 50, all three-fold replicated except the first) were paired-end sequenced in 4 flow cell lanes of Illumina HiSeq2500 sequencing system, aiming at an average coverage of 50x of each sample. At each generation a synchronous sample pooling the three replicates of the control was also sequenced. In total, thus, 24 samples were pool-sequenced (see Figure 2.1 in Chapter 2).
In that study a total of about 3 million SNPs were obtained and used to follow the evolutionary trajectories of the Adraga and Groningen populations. The number of SNPs in each population decreased during laboratory adaptation, probably indicating that there were many initially rare alleles that got fixed across generations. The nucleotide diversity was similar in both populations in the beginning of the experiment, and it decreased in both populations to values close to the control population.
The two populations were initially differentiated at the genome-wide level (FST = 0.028) and did not converge, in fact indicating divergence across generations (FST increased at G50 = 0.042). Interestingly Ad showed a certain degree of convergence to the control, derived from the same geographical origin (FST decreased from 0.032 to 0.030) but did not fully converge to it.
After analyzing the genome-wide level, SNPs under positive selection were detected in both populations. Interestingly, no common SNPs with signs of selection were found between populations, suggesting different selective responses at the genomic level. Nevertheless there was suggestion that some of the SNPs changed due to selection in both populations. Particularly, there was a peak in allele frequency changes around the candidate SNPs, even in the other population (though being much lower). Also, the differentiation seen around candidate SNPs was also higher in the other population, comparative to random non-candidate SNPs.
Regarding the chromosome location of the candidate SNPs there were major differences between populations. The majority of SNPs under selection between generations 6 and 50 for Ad were located in chromosome E and O while for Gro most were located in chromosome A, the sex chromosome. A Gene Ontology analysis of genes with candidate SNPs was also performed as well as a classification of the type of mutation involved. These last analyses, published in Seabra et al. (2017), constitute part of this dissertation (chapter 2).
1.3 Aims and Dissertation Structure
My master project had two major objectives. The first one was to contribute to the analysis of the genome-wide empirical data, both by Pool-sequencing and RAD-sequencing, to further understand genomic changes occurring during adaptation to the laboratory of two populations of Drosophila
subobscura from two contrasting latitudes (Adraga, Portugal and Groningen, Netherlands). My second
focus was to develop and apply bioinformatic tools to these data. In particular, taking advantage of my previous background in bioinformatics, I contributed to the analysis of the data by developing small programs (R and python scripts), databases and also applying bioinformatics tools to the statistical analysis of the data.
The specific objectives of this thesis were to:
1. Characterize candidate genes associated with SNPs involved in the adaptive process, detected in the analysis of pool-seq data;
2. Develop a database for chromosomal location of genes or genomic regions of Drosophila
subobscura. This database will be made available and easy to update;
3. Develop a pipeline for the analysis of the sequence data of 4) below;
4. Analyze the RAD-Seq data of individual larvae with known karyotypes, searching for signs of the evolution of genomic content of inversions in general and specific to the adaptive process and how much it differs between populations;
5. Integrate information of SNPs with signs of selection obtained with the Pool-seq and Rad-seq data, in search for common candidate genes/functions involved in the adaptive process as well as in differences between populations.
2. Pool-sequencing
2.1. Introduction
Almost two decades ago, a fully sequenced genome was great news. But population genetic researchers study the population level and not individuals, so one full sequenced genome is not enough, they need more. Also, allele frequencies should be estimated from samples drawn from a large population because the use of small sample sizes can result in considerable errors even when the allele frequencies have been determined at high accuracy (Schlötterer et al. 2014). That is why the arrival of Pool-sequencing (or Pool-seq) is revolutionizing the field.
Pool-seq is the whole-genome sequencing of pools of many individuals and provides a cost-effective alternative to the whole-genome sequencing of individuals, which is very expensive because each individual is sequenced separately, and the preparation of the libraries is also expensive. This latter approach would implicate the sequencing of many individuals
in
research areas like population genetics. With the increasing availability of new software tools, Pool-seq is being increasingly used for population genomic research on both model and non-model organisms (Schlötterer et al. 2014).This approach provides genome-wide polymorphism data and this kind of data is becoming increasingly important to serve as a complement to classical genetic analyses. It allows us to know about polymorphic positions in the genome and the frequencies of variant alleles in several populations (Schlötterer et al. 2014). The drawback of this methodology is that haplotypes information is lost which limits linkage disequilibrium analysis.
Seabra et al. (2017) used a Pool-seq approach to study the genome-wide evolution of two
Drosophila subobscura populations founded in the laboratory from contrasting latitudes, Adraga
(Portugal, called Ad) and Groningen (The Netherlands, called Gro) - to understand the genomic mechanisms underlying their laboratory adaptation. Genome resequencing of these populations (three-fold replicated at generation four) was done at four time points since introduction in the laboratory (Figure 2.1). A long-established laboratory control population (TA, also derived from Adraga, in 2001) was also sequenced at the same time points. Candidate SNPs (that gave signs of selection) in Ad and Gro were detected in this study (in both short, G6-G25, and long, G25-G50, periods) and my dissertation work started with the characterization of these SNPs.The objectives were to find a subset of those candidate SNPs with hits with proteins, to make a functional gene ontology characterization to describe biological processes, molecular functions and cellular components affected by those SNPs, and to make a characterization of the types of mutations (synonymous or non-synonymous) behind those SNPs. That part of my master thesis was included in Seabra et al. (2017). Finally, and not included in that paper, I developed a database for Drosophila subobscura, that allows to obtain the localization of genes in chromosomes and, if available, locate them within or outside inversions.
There is still no full assembled reference genome available for Drosophila subobscura and molecular data on this species is very scarce in databases and datawarehouses available for Drosophila genus, like Flybase or Flymine (Gramates et al. 2017 and Lyne et al. 2007 repectively). In spite of this, it is a species studied for many years (for a classic account see Ayala et al. 1989) and there are many papers about this species, including at the population genetic level. The karyotype and the wide number of inversions is characterized, and these inversions are cytologically located (Krimbas 1992, Menozzi and Krimbas 1992, Krimbas 1993, Santos et al. 2005). Also, the sequences of several genes and their cytological location (detected by FISH) are already published but there is no database that
integrates this information. A total of 2250 Drosophila subobscura published sequences are available on NCBI and 156 are cytologically located on 20 publications (Appendix 1).
Figure 2.1 – Experimental design of the Pool-seq study. Genome resequencing for pools of 50 individuals from the latitudinal populations (Adraga – triangles, Groningen – squares, Control – diamonds) at four different generations (the generations numbers are marked for each latitudinal population). At generation 1 populations were not yet replicated. After generation 1 replicate populations are marked as: continuous line – replicate 1; dashed line – replicate 2; dotted line – replicate 3. Control populations were sequenced synchronously, pooling all three replicate populations together at each time point analyzed. G1, G6, G25 and G50 correspond to generation 1, 6, 25 and 50 which are the time points analyzed (from Seabra et al. 2017).
2.2. Material and Methods
This dissertation work started with the characterization of some of the candidate SNPs found in the study by Seabra et al. (2017). I analyzed the candidate SNPs (with sign of being under selection) that gave hits with proteins and made a functional gene ontology characterization to describe biological processes, molecular functions and cellular components affected by those SNPs. Also, I made a characterization of the types of mutations (synonymous or non-synonymous) caused by each SNP.
Seabra et al. (2017) assembled a draft reference genome using a homokaryotypic line of this species (chcu) (Koske and Maynard Smith 1954) but it is still very fragmented. The draft reference has 2,043 sequences covering 117,329,206 bp, with an average length of 57,429 bp, a maximum length of 820,545 bp and a N50 of 91,130. Assuming a genome size of 120Mb (Adams et al. 2000), 97.5% of the genome is covered by this assembly. This draft reference genome was aligned (BLASTx) against sequences of genes and other genetic regions already published in Drosophila subobscura which alowed find published genes in the draft genome assembled.
2.2.1. Gene Ontology analysis
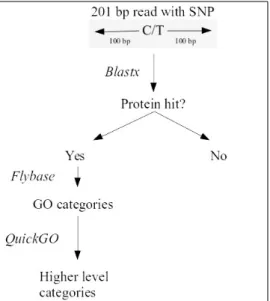
As there is no annotated genome, I followed the following schematically represented in Figure 2.2 to characterize the biological processes, molecular functions and cellular components associated with each protein. I used Gene Ontology framework that provides controlled vocabularies used to describe gene function, and relationships between these concepts.
In a first step, BLASTx was used to discover proteins hits in the candidate SNP regions (which are made of 100 bp upstream and 100bp downstream of the candidate SNP, totaling 201 bp region). Only the regions with a match with proteins were further analysed.
In a second step, in order to characterize the mentioned SNP regions, I assessed Gene Ontology categories/terms using Flybase and defined higher level categories using QuickGo (http://www.ebi.ac.uk/QuickGO/).
As sometimes more than one term is found to characterize a single gene, decision had to be made to choose the term that best fits the function of the gene. Whenever this was the case, terms inferred from direct assay were chosen over terms inferred from other ways.
Because of the variety and specificity of terms obtained, few proteins were found to be associated with the same process. That way is impossible to find a pattern or direction in the results. To try to solve that problem I tried to group the results in clusters. For that, it was necessary to define higher level categories. This higher level categories, were obtained in the webpage of QuickGo. The QuickGo tools defines relationship between words, in a way that given a word it finds those words whose meaning is related and atributes more general terms as parent terms in the GO graph and more specific terms as child terms.
Some proteins were associated with more than one high level category. That is why in some cases the total number of higher level categories in each dataset is higher than the number of SNPs with hits. Due to the fact that "cellular process" and "multicellular organismal process" terms are very general I did not consider them in this classification.
Figure 2.2 –Protocol followed to make the Gene Ontology characterization of the genes.
2.2.2. Type of substitution analysis
To check if the nucleotide substitutions were synonymous or non-synonymous I used the methodology described in Figure 2.3. For the sequences with hits with proteins (the same as in 2.2.1) I searched for a the nucleotide sequence in the nt database (blastn) (accessed at 24/3/2017). The parameters used were the default ones and it were selected the sequences with higher score values in the alignment to be used as reference. To discover the type of mutation I aligned each pair of sequences (201bp sequence with the SNP and the sequence with highest score resulting from Blastn alignment) and made the translation of the two sequences using BioEdit version 7.1.9 (Hall 1999).
This translation allowed to discover the three nucleotide codon generated by each sequenced and the amino acid codified was search on codon table in http://www.chegg.com.
Figure 2.3 – Protocol followed to make the classification of the type of mutation in each SNP region.
2.2.3. DsubSeqLoc Database
Flybase, a database of Drosophila Genes & Genomes, only presents information about other species like Drosophila melanogaster or the American counterpart of Drosophila subobscura,
Drosophila pseudoobscura (the closer species phylogenetically). Flymine is a datawarehouse that
presents information about many Drosophila species, including D. subobscura (namely published papers about this species), but does not include cytological information.
In order to assemble the information already published about sequences of genes and other regions of D. subobscura, as well as their cytological location, and to relate them with the new data of the draft genome that we developed in our laboratory (Seabra et al. 2017), I developed a database called DsubSeqLoc. It was constructed in phpmyadmin 4.6.5.2 using mySQL 2.0 and is composed of several entities and relation tables, namely gene names, reference to papers that published nucleotide sequences of those genes, and the cytological location of those genes, including, whenever available, their location in relation to inversions. To relate information published with the new data of the draft genome it was done the BLAST of genes in the chromosomes of Drosophila subobscura against the draft reference genome.
To make easier the process of searching the database and to make it available to any user, even those who lack knowledge on how to make queries to the database or dealing with mySQL, I created a website that gives access to the content of the database. The website was created in PHP and css using the https://html5up.net/read-only free template. In the index.php file I wrote code to create search boxes and connect them to the database. The connection to the database was done using mySQLi PHP extention (Gilmore 2006)
.
2.3. Results
2.3.1. Characterization of SNPs
From the 134 and 288 candidate SNPs indicating selection between generations 6 and 25 (G6-G25) for Ad and Gro, respectively, I observed significant hits with proteins in 24 and 36 SNP regions, respectively. For the sets of SNPs indicating selection between generations 6 and 50 (G6-G50), I found hits with proteins for 37 of the 189 candidate SNPs for Adraga, and for 13 of the 107 candidate SNPs for Groningen. A varied number of biological processes are involved, with the most represented higher level GO categories, present in all datasets, being localization, metabolic processes and response to stimulus Others, such as biological regulation and rhythmic processes, were only present in Adraga (Figure 2.4).
Although the low number of hits with proteins precludes a proper comparative analysis between Ad and Gro populations, it is anyway tempting to discuss the processes that have been detected as being under selection. The new laboratory environment subjects the flies to new conditions such as density, both in juveniles and adults, age of reproduction, temperature, nutrients, photoperiod, among others (Pegueroles et al. 1999). It is thus no surprise that in general metabolic processes are affected (anabolism and catabolism), as well as processes involved in the distribution of molecules (localization), responses to stimuli and rhythmic processes, e.g. because time exposition to light has changed.
The only common family of genes harboring SNPs detected to be under selection both in Adraga and Groningen was a gustatory receptor gene family, but these SNPs are located in different chromosomes: gustatory receptor 22a and 22d at chromosome U for Ad and gustatory receptor 59e at chromosome E for Gro.
A few of the identified genes had more than one SNP significant for selection (1 gene for Adraga and 4 genes for Groningen). There was a total of 12 scaffolds with two or three genes harboring candidate SNPs. None of the genes with candidate SNPs were located in common scaffolds between Adraga and Groningen.
Bottom line, I did not detect convergent evolution between Adraga and Groningen populations at the gene/protein levels of organization. Nevertheless, as said before, the few hits with proteins, and the different number of proteins with hits of SNPs under selection for Ad and Gro do not allow a proper analysis and comparison to fully explore this scenario.
I found a lower number of synonymous than non-synonymous substitutions in Adraga, whereas in Groningen the number of non-synonymous and synonymous substitutions was similar (Table 2.1). Interestingly, some of the mutations under selection were located in small intronic regions in all datasets.
Figure 2.4 – Bar charts with the higher level GO categories found for candidate SNPs (with significant protein hits) detected in Ad and Gro in both short and long periods.
Table 2.1 – Number of candidate SNPs with significant protein hits and from these, those that are synonymous, non-synonymous or that are located in introns, for both Ad and Gro in short and long period.
2.3.2. Database
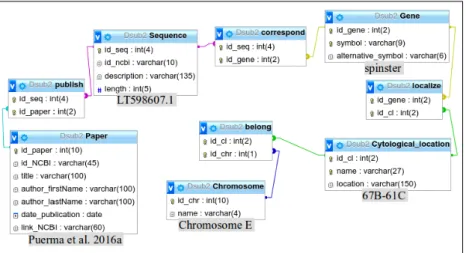
The database structure utilized to store and retrieve information was modelled as a relational database (Figure 2.5). This database is composed of 9 tables (5 corresponding to entities and 4 corresponding to relationships) due to the underlying nature of selected data. It stores 20 links to papers and sequence id of the sequences in NCBI. The webpage that gives easier access to that database is available at the link http://www-personal.fc.ul.pt/~mmmatos/DsubSeqLoc.
The database websearch allows the user to introduce a name of a gene and obtain information on its location (chromosome and cytological band). Also, when available it provides information whether the gene is inside or outside given chromosomal inversions.
The database also allows the user to insert, not only a single gene but also a list of genes and obtain the corresponding location information for each gene in the list. I used the database to locate the candidate SNPs obtained by pool-sequencing inside or outside inversions.
Figure 2.5 – Entity Relationship (ER) model of the DsubSeqLocdatabase constructed. Below each table, in gray, it is shown an example of information within the database. The example correspond to a gene matching a candidate SNP in Ad detected
in Pool-seq analysis of long period adaptation (G6G50).
Ad G6-G25 Ad G6-G50 Gro G6-G25 Gro G6-G50 Total 134 189 288 107 Protein hits 24 37 36 13 Non-synonymous 14 22 15 2 Synonymous 5 4 13 3 Intron 2 7 5 5
3. RAD-sequencing
3.1. Introduction
Whenever we need to have individual genetic information for many individuals, whole genome sequencing is still very expensive. This limitation was the booster for the arrival of a method for genome-wide genetic markers development and genotyping called Restriction site-associated DNA sequencing or, in short, RAD-seq (Baird et al. 2008, Emerson et al. 2010, Hohenlohe et al. 2010, Davey & Blaxter 2011, Davey et al. 2011).
This method uses restriction enzyme digestion of target genomes to reduce the complexity of the target and it has shown to be capable of delivering thousands of sequenced markers across many individuals for any organism at reasonable costs. This method has the advantage, relatively to pool-seq, of preserving the identity of individuals because it uses molecular identifiers (MID) to associate sequence reads to particular individuals. Also, it allows to have high reliability on the called SNPs if coverage is high while the reliability of the ones captured by pool-seq is only moderate (Davey & Blaxter 2011, Schlötterer et al. 2014).
In short, the method includes five major steps: cut of individual DNA by the restriction enzyme; the fragments are ligated to a P1 adapter that contains a sticky end that makes the ligation possible to happen and a MID (molecular identifier that will uniquely identify the individual and tag the fragment); the fragments are pooled and then sheared to generate shorter fragments; all the fragments will be ligated to a P2 adapter and, in the end, will be amplified using two primers. Only the fragments with both P1 and P2 adapters will be amplified because of the characteristics of the P2 adapter (Davey & Blaxter 2011) (Figure 3.1).
In this work I aim to understand the evolutionary dynamics of the genomic content of chromosomes with specific inversions and how they differ between Ad and Gro populations of
Drosophila subobscura. For that, sequencing separately individuals with known karyotypes, was
required. RAD-sequencing was a natural choice for this objective.
Studying the genomic content of chromosomes with specific inversions is important because, in spite the role of these inversions in processes such as adaptation, speciation and the evolution of sex chromosomes, the underlying evolutionary mechanisms are not fully understood. In particular, there is a high controversy in what concerns the evolution of inversions and the processes that are involved in the maintenance of inversion polymorphisms in natural populations. While the coadaptation hypothesis (Dobzhanky 1950, Dobzhanky 1970) is based on a selective advantage of inversion heterokaryotypes due to the existence of positive epistatic interactions between loci located within chromosomal arrangements, the local adaptation hypothesis (Kirkpatrick and Barton 2006) states that as long as chromosomal inversions present sets of alleles adapted to local conditions, they may be selected even without epistasis. The spread of an inversion can be thus explained by the maintenance of a given set of alleles with positive effects on fitness. While it is not easy to disentangle the two hypotheses, the study of the genomic content of inversions, how much it differs between populations and how it evolves during adaptive evolution may shed light on these issues (Hoffmann & Rieseberg 2008, Simões et al. 2012, Fragata et al. 2014a, Santos et al. 2016).
History and selection are likely to shape the evolution of inversions but at what extent it is not known. Fragata el al. 2014a report signs of positive selection for some inversions, but they were
variable between populations, that maintained differentiation for inversions after 40 generations of laboratory evolution (Fragata et al. 2014a).
In this chapter I present the analysis that I carried out in this thesis of data obtained by RAD-sequencing of a large number of individual larvae of Drosophila subobscura from replicate populations coming from Adraga, Portugal and Groningen, Netherlands at two generations, 6 and 25, of evolution in the laboratory. The chromosomal inversions of these larvae were previously characterized through cytological analysis (Fragata et al. 2014a). The same populations and generations were analyzed at the genome-wide level by pool-sequencing by Seabra et al. (2017) and in this thesis (Chapter 2) which allowed to make a comparative analysis between studies.
Figure 3.1 – Schematic representation of the crosses that allowed to obtain the F1 larvae that were sequenced (on the left) and RAD-Sequencing protocol (on the right) (Adapted from Floragenex Technical Brief)
3.2. Material and Methods
3.2.1. Biological material and RAD-sequencing
This part of the work was done previously to my arrival in the laboratory, but I present here this information since it is not published yet and is important to understand the subsequent flow of analysis.
Two populations of Drosophila subobscura were collected from two contrasting latitudes (Adraga, Portugal and Groningen, Netherlands), brought to a new common environment, the laboratory environment. These populations were threefold-replicated at the fourth generation after founding (details in Fragata et al. 2014a). RAD-sequencing was done on individuals from three replicates of each population (Ad1, Ad2, Ad3, Gro1, Gro2 and Gro3) from generation 6 (G6) and 25 (G25) after introduction in the laboratory.
To analyze the genomic content of chromosomes wild males (whose chromosomes do not have recombination) from the populations were crossed with females of the homokaryotypic lineage
chcu (Figure 3.1). This cross was done to allow the characterization of the chromosomal arrangements. Chcu is a isogenic, homokaryotypic strain, with the following chromosomal arrangements: AST , JST ,
UST , EST and O3+4 (Balanyà et al. 2004). The cross generates F1 larvae that have half the genome of the
chcu lineage and half the genome of the wild individual. The cytological visualization of the
chromosomes of the F1 larvae allows to identify the arrangement of each paternal, that is “wild”, chromosome due to the formation of specific loops in the alignment of homologous chromosomes (details in Simões et al. 2012). RAD-sequencing was done in a set of the larvae in the corresponding populations and generations (see details below). To ensure that less frequent, but still interesting, chromosomal arrangements were sequenced, after a random choice of the individual larvae, some others were also included, to a final number of c. 39 individuals per replicate population and generation.
Given that half the genome of each individual was chcu, to be able to remove the corresponding haplotypes from the sequences we also sequenced chcu individuals. In total 475 larvaes were sequenced, 117 from Ad at G6, 117 from Gro at G6, 115 from Ad at G25, 115 from Gro at G25 and 11 chcu (see Appendix 2).
DNA from each individual larva was extracted using the phenol-chloroform extraction method (Sambrook and Russell 2001). Individual DNA extracts were distributed in five 96-well plates for sequencing, and it was essential to equalize the DNA amount and concentration on each plate (5 ng/ul in 13 ul total for each individual). Precise quantification was done with the Qubit 2.0 Fluorometer (Invitrogen). DNA extracted was sent to Floragenex (http://www.floragenex.com/) that prepared the RAD libraries using PstI restriction enzyme and carried out single-end 100 bp sequencing in Illumina HiSeq2500 platform, using one sequencing lane per each of the 96-sample plates, sequenced twice to double the sequencing amount for a good coverage.
From the single-end Illumina sequencing of the 475 individuals, we obtained an average of 3.3 M reads per individual. The Fastq files obtained from sequencing were checked for base quality in
FastQC. Each fastq file included reads from several individuals, identified by sequence barcodes.
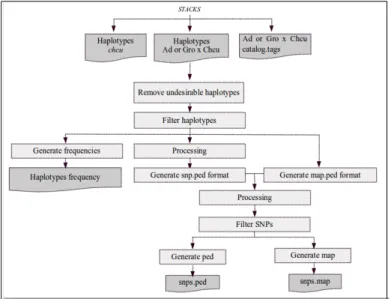
Reads were processed by process_radtags (from the package Stacks (Catchen et al. 2013)) to remove reads with uncalled bases and with low quality scores, to check that the barcode and restriction site are intact in each read and to demultiplex the samples based on the barcode identification. After the later mentioned processing and filtering steps, an average of 2.9 M reads per individual were retained.
3.2.2. RAD-seq analysis
The software Stacks was chosen to process and analyse RAD-seq data. This software is composed of several components that can be used separately. The first one is the already mentioned
process_radtags which process reads. When a reference genome is available, as is our case (Seabra et
al. 2017), the reads are aligned to this reference using and alignment program bowtie2 version 2.2.1 (Langmead et al. 2009). Then, the second component of Stacks, named pstacks, extracts stacks (RAD loci) that have been aligned to the reference and identifies SNPs. The minimum depth of coverage allowed to report a stack was 3. The third component is cstacks and assembles the catalog based on alignment position, not sequence identity. The fourth component, sstacks makes matches each individual reads to the catalog.
After running these components, a fifth one, populations, allows exporting loci and SNP data after applying filters for missing data. This program was executed for three sets of data separately: one consisting of the 11 individuals of chcu, another consisting in all 232 individuals of Ad and another of 232 individuals of Gro. The filters applied to obtain reliable loci in all 3 cases were: at least half of the individuals in a population must have data on a locus to process that locus for that population (-r 50)
and a minimum stack depth of 10 is required for individuals at that locus (-m 10). For two sets of data (Ad and Gro), there was the additional filter that a locus must be present in at least 3 of the 12 samples (Ad1G6, Ad2G6, Ad3G6, Ad1G25, Ad2G25, Ad3G25, Gro1G6, Gro2G6, Gro3G6, Gro1G25, Gro2G25 and Gro3G25) .
3.2.3. Pipeline for removal of chcu haplotypes
From each individual I needed to remove the haplotype from chcu, to keep only the haplotype from the population I am studying. For that purpose I developed a pipeline that consists of a workflow of programs mainly written in python 2.7 programming language and linux shell to process datafiles in sequence.
This pipeline is composed of 12 programs, the main program is called RH_pipeline.py that import other python programs created by me. When necessary, this main program uses subprocess module to spawn linux shell processes. This pipeline is an output of this thesis and all the steps are detailed in the results (section 3.3.2).
3.2.4. Statistical analysis of RAD-seq data
In the previous step I obtained, for each individual and for each polymorphic site (SNP), the allele coming from our “wild” population (Ad or Gro), after excluding the allele coming from chcu. Since most software of SNP analysis require diploid codification I duplicated the allele, obtaining a total matrix of 417264 SNPs for 462 individuals in map and ped format.
There is no complete reference genome for this species and in our fragmented draft genome (see chapter 2, section 2.2) we have no information about the location of the chromosomal arrangements (inversions). However, we know to which chromosome each of our fragments (scaffolds) belong, from homology with D. melanogaster. Thus, I was able to analyze the SNPs located in each of the 5 chromosomes separately (see section 3.3.3). Since I know which inversion was present in each individual, I was also able to analyze the SNPs present in each chromosome with a specific chromosomal arrangement. I selected chromosomal arrangements O3+4, OST and A2 (see sections 3.3.4.1, 3.3.4.2 and 3.3.5.1) for several reasons. Two of them (O3+4 and OST) were chosen because they are located in the chromosome O, the one with more molecular information available. Also, the O3+4 arrangement presents an interesting dynamic, as it increases in frequency in Ad but not in Gro. The A2 inversion is interesting to analyze because it is present on the sexual chromosome, occurs with high frequency in both populations, allowing good sample size to study. This inversion presents a temporal increase in frequency in both populations. From these arrangements, I was interested in finding those SNPs with signs of selection, and as a surrogate of cytogenomic location, I also analyzed SNPs with statistical association with each inversion.
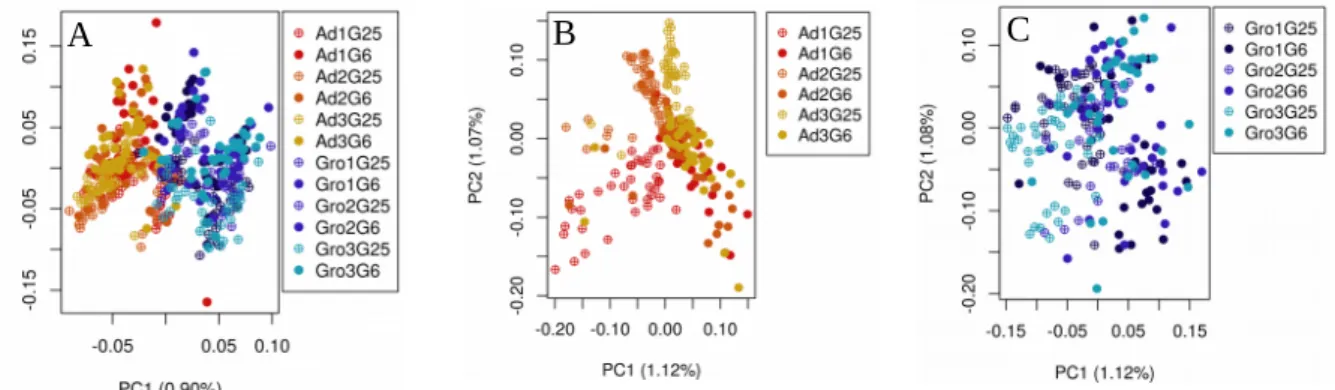
I performed a Principal Component Analysis (PCA) to visually assess the genome-wide differentiation between individual samples. The Principal Component Analysis was done with a R script that uses the libraries SNPRelate v1.6.4 and gdsfmt (Zheng et al. 2012) from bioconductor development software project. I used the snpgdsVCF2bGDS function to reformat Variant Call Format (VCF) file and the snpgdsPCA function to calculate the eigenvectors and eigenvalues for principal component analysis.
To assess differentiation between populations and across generations, I estimated pairwise mean FST (Weir and Cockerham 1984) between groups (replicates/populations/generations) using the program vcftools version 3.0 (Danecek et al. 2011) with --weir-fst-pop argument and plotted a