Abstract
—
This paper reports detailed propagation analyses of
mm-wave indoor networks based numerical simulations of the wireless
coverage and measurements of the propagation coefficient at 28 and
38 GHz. Additionally, material characterization of typical buildings
materials used in constructions are presented, including: common
brick (with and without electrical installations); plaster walls;
glazing, Eucatex panels; wooden doors. The computational
sim
ulations have been performed using Altair WinProp™ software
in order to predict path loss in LOS (Line-of-Sight) and NLOS
(Non-Line-of-Sight) environments. The obtained results contributes
to the planning of the fifth Generation of mobile communications
networks (5G), operating in mm-waves.
Index Terms—5G, indoor propagation, millimeter waves, propagation and
wireless communications.
I.
INTRODUCTIONIn recent years, the access networks of telecommunication operators have needed increasing data transfer rates and bandwidth to support all the data traffic generated by their subscribers. The global mobile data traffic is estimated to increase 7-fold between 2016 and 2021, with annual growth rate of 47% [1]. By 2021, it is estimated to reach 48,951 exabytes per month [1]. The International Telecommunication Union (ITU), in one of its reports [2], forecasts in the period from 2020 to 2030 global data traffic will grow from 10 to 100 times. Those forecasts have motivated the search for new frequency bands with enough bandwidth to meet the growing demand for mobile communications, since the traditional UHF and SHF bands are both already congested with the existing services. The millimeter-wave frequency bands (mm-waves) promise to meet this demand. The developing fifth generation of mobile communications networks (5G) intends to use the millimeter-wave frequency bands to obtain the bandwidth required to meet the full demand of carrier subscribers and ensure the deployment success of Gbps per user.
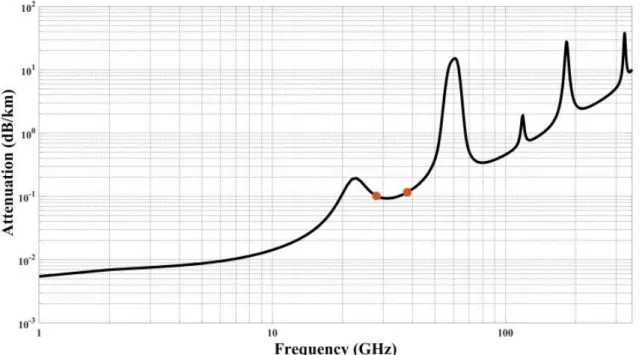
The millimeter-wave frequency bands around 28 and 38GHz have been considered potential for 5G, since they but is significantly increase attenuation due to atmospheric gases absorption [3] and rainfall [4], as shown in Figs. 1 and 2, respectively. In fact, only the attenuation due to the communication channel in mm-waves will be higher, when compared to the attenuation in at microwave frequencies, which are used today for wireless access. However, this can be mitigated by using high-gain adaptive antennas and transmission cells (clusters) with dimensions in the order of 200 m or even less, such as picocells and femtocells [5].
This paper first presents material characterization based on measurements of the reflection coefficient and transmission loss of common Brazilian building materials at 28 and 38GHz. Next, it reports a detailed analysis on path loss and propagation coefficients based on experimental measurements and computational simulations
Material Characterization and Propagation
Analysis of mm-Waves Indoor Networks
A. Fagiani
1, M. Vogel
2and Arismar Cerqueira S. Jr.
11National Institute of Telecommunication, Santa Rita do Sapucaí - Brasil, [email protected] and
performed with Altair WinProp™, using the previously determined reflection and transmission coefficients. LOS (Line-of-Sight) and NLOS (Non-Line-of-Sight) environments have been considered in order to evaluate real scenarios of the future 5G networks. The paper is structured in four sections. Section II describes the methods used in the experimental setup to obtain the reflection coefficient and penetration losses of typical building materials. Section III presents the experimental results of the path loss and propagation coefficient in indoor environments with LOS and NLOS, whereas conclusions and proposals for future works are described in Section IV.
Fig.1. Signal attenuation due atmospheric gases.
II.
M
ATERIALC
HARACTERIZATIONA.
Penetration Loss
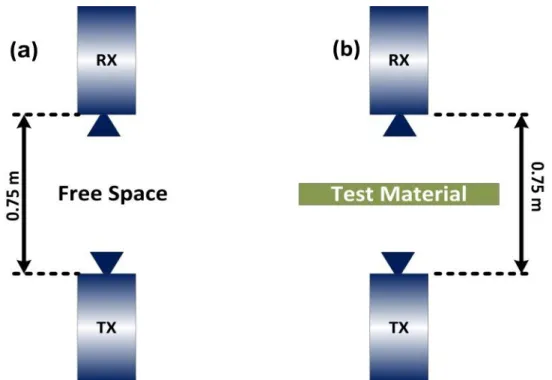
Penetration loss is the signal attenuation caused by its propagation through a material. It can be defined as the difference between received power in free space [Fig. 3a] and that obtained with an obstructing material between TX and RX, according to Fig. 3b. Equation (1) calculates the deterministic value of the received power, in which ECL (Excess Channel Loss) is the attenuation added to the communication channel due to the inclusion of the obstructing material between TX and RX [6]:
(1)
where PT and PR are the transmitting and receiving power in dBm, GT and GR are the gain of transmitting and
receiving antennas in dBi, is the wavelength (10,71 mm at 28GHz and 7,89 mm at 38GHz). The reference distance d0 was defined as 0,75 m, which is large enough to ensure that characterization analyses occur in the
antenna Fraunhofer region (far-field).
Fig. 3.Experimental mounting used in the penetration loss characterization.
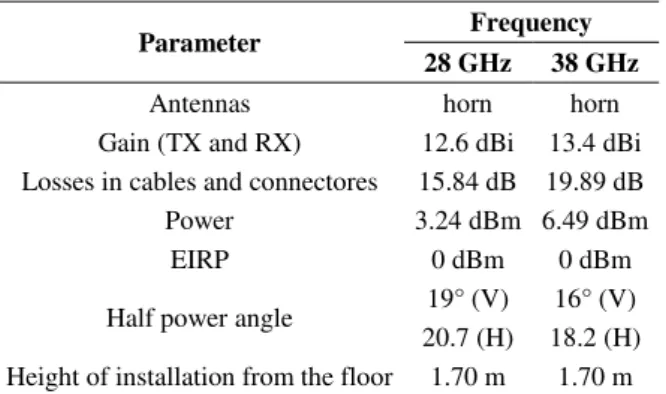
TABLEI. SETTINGS OF TRANSMITTING SYSTEM
Parameter Frequency
28 GHz 38 GHz Antennas horn horn Gain (TX and RX) 12.6 dBi 13.4 dBi Losses in cables and connectores 15.84 dB 19.89 dB Power 3.24 dBm 6.49 dBm EIRP 0 dBm 0 dBm Half power angle 19° (V)
20.7 (H)
16° (V) 18.2 (H) Height of installation from the floor 1.70 m 1.70 m
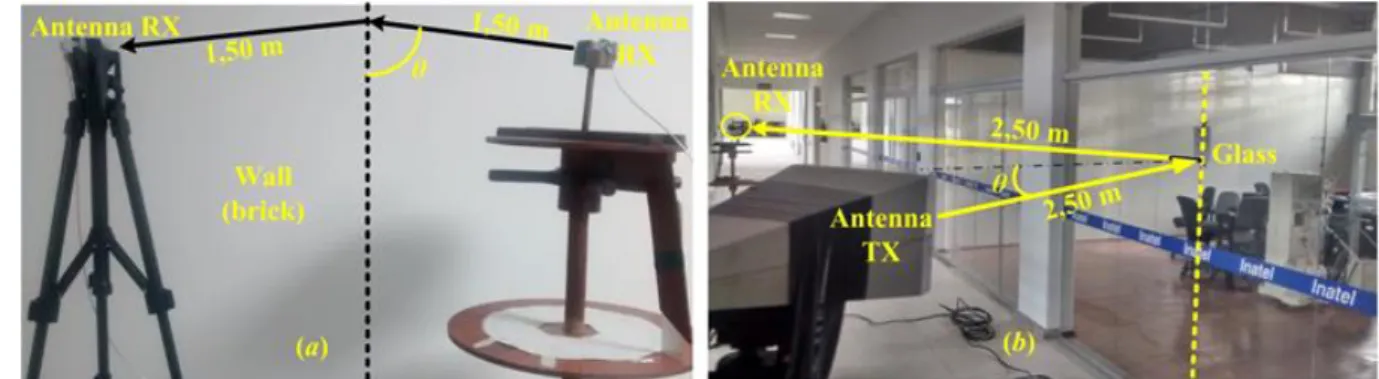
The analyzed materials were brick walls with and without electrical installations, plaster walls, Eucatex panels, glass (doors and windows) and MDF (Medium Density Fiberboard) doors. Fig. 4 presents the photographs of the material characterization in the free space and some of the investigated materials.
Fig. 4.Experimental mounting used in the penetration loss characterization of brick wall and transparent glass.
B. Reflection coefficient
(2)
The reflection coefficient was experimentally obtained for the white brick walls with a thickness of 15.5cm and for 0.8 cm transparent glass. For those experiments, the transmitting power was reduced to -10dBm. In the measurement of the glass reflection coefficient, a horn antenna with the following electromagnetic properties has replaced the transmitting antenna: 24.85dBi gain; 10° half power beamwidth in the magnetic field plane; 9° half power beamwidth in the electric field plane. The motivation for this alteration is increasing EIRP in order to obtain lower standard deviation. The measurements were performed in the vertical polarization at 28 and 38GHz.
Fig. 5.Experimental setup used in reflection coefficient characterization.
Fig. 6.Experimental mountings used in the glass reflection coefficient characterization of brick wall and transparent glass.
C. Material Characterization
incidence angles equal to 15°, 45° and 60°.
TABLE II. PENETRATION LOSS MEASUREMENTS
Material
Total Thickness
(cm)
ECL (dB)
28 GHz 38 GHz
Polarization Polarization
V H V H
Brick Wall with electric
installations 15.5 34.93 38.93 48.09 37.52 Brick Wall without electric
installations 15.5 30.17 31.63 39.16 33.89 Plastered Walls 11.2 2.73 3.60 2.97 5.56 Eucatex® wall partition panels 3.6 2.45 3.25 4.53 7.31 Slightly dark glass 0.8 3.22 4.10 5.58 6.72 Wooden MDF door 4.0 12.58 16.12 16.74 13.76
TABLE III. REFLECTION COEFFICIENTS
Material Incident
angle (θ) Frequency |Γ|
Brick Wall
15° 28 0.648
38 0.889
45° 28 0.591
38 0.678
60° 28 0.928
38 0.571
Transparent Glass
15° 28 0.502
38 0.894
45° 28 0.843
38 0.522
60° 28 0.591
38 0.447
III.
I
NDOORE
NVIRONMENTC
HARACTERIZATIONA.
Penetration Loss and Propagation Coefficient Estimation
The path loss in a communication channel is defined as the difference between the transmitted and received signal powers [8]. The intensity of the received signal will be a logarithmic distance-decay function, which will express the value of the channel path loss[8]. The angular coefficient of this curve implies in the signal attenuation value, i.e., how much the communication channel will degrade the signal propagation. The angular coefficient is known as the communication channel propagation coefficient.
(3)
Where Xσis the random variable with a Gaussian distribution with mean of zero and standard deviation of in dB [8]. Once the path-loss measurements have been made, the propagation coefficient can be estimated by non-linear regression mathematical algorithms, so that the mean square error between measured and modeled points is minimized according to Equation (4) [9]. The regression model, as proposed in [10] [11], considers the log-distance propagation model:
(4)
where PR is the measured power at the receptor, d0 and dRX are respectively the reference distance and the distance between TX and RX, dk is the spacing between two successive samples of the measured signal.
B.
Experimental results of path loss and reflection coefficient
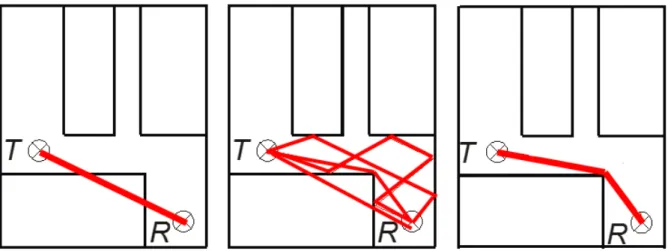
The same transmission parameters used in the material characterization have been used in the pathloss analysis. An indoor environment of the second floor of Buildings 2, 3 and 4 from Inatel has been considered either in the computational simulations and experiments. Simulation methods in Altair WinProp are mostly based on ray tracing. For indoor simulations, several options exist, with tradeoffsin accuracy and computational time. Fig. 7 illustrates the main options, namely: Multi-Wall Model; Standard Ray Tracing; Dominant Path Model. In the Multi-Wall Model (Fig. 7, left), a ray travels in a straight line from transmitter to receiver. The path loss depends on distance and number of walls the ray passes through. This method is very fast and may be beneficial in large and complicated indoor wireless environments, when signal coverage needs to be analyzed over large areas with fine discretization.
Standard Ray Tracing (Fig. 7, center) follows a much more rigorous approach, in which many ray paths between transmitter and receiver are analyzed. These include rays with multiple reflections, transmissions, edge diffractions and combinations of all these mechanisms. There would be more rays than those drawn in the image. This method has the advantage of accuracy, but at the expense of computational time. Especially when the number of diffractions in a ray path increases, the speed decreases, because at each diffraction many new rays are spawned. As a consequence, one rarely includes more than two diffractions in practice. In a complicated indoor environment over distances that are not short, one needs to include more diffraction, so the accuracy suffers.
The Dominant Path Model (Fig. 7, right) [14] offers, for a complicated indoor environment, the best accuracy in a reasonable time. This proprietary method determines rapidly which path between transmitter and receiver is likely to be the dominant one, i.e. likely to carry the bulk of the signal power. This path can have any combination of transmissions, reflections and diffractions, thus the received signal is calculated rapidly. Since more diffraction can be included than in Standard Ray Tracing, the Dominant Path Model has higher accuracy in complicated indoor environments for receiver positions not close to the transmitter.
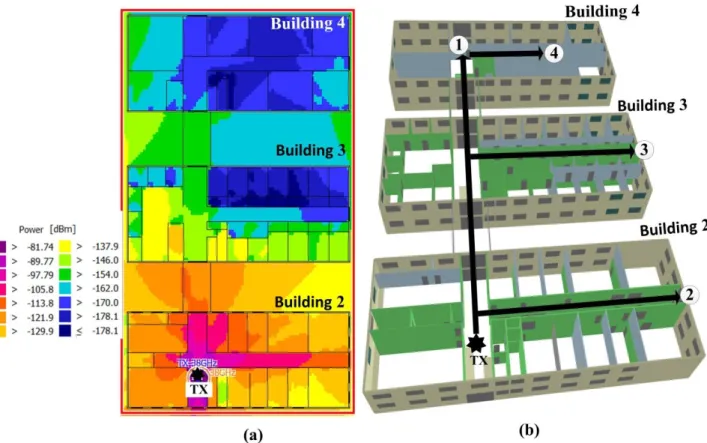
Figs. 8 and 9 display the computational results obtained with Altair WinProp™ of the signal over the entire second floor at 28 and 38 GHz. Table IV presents the experimental measurements of path loss in the paths indicated in Figs. 8 and 9 and the estimated propagation coefficients of each path. Note the variation in the propagation coefficients that were estimated from the measurements. This variation reflects the line-of-sight conditions, as it might also be observed in the computational results from Figs. 8 and 9: the smallest value occurs for trajectory 1 (line of sight), the second-smallest for trajectory 2 (obstructed line-of-sight but no walls to penetrate), while the largest values occur for trajectories that penetrate several walls. The values of the propagation coefficient vary from 3.85 to 4.57, whereas the received power estimated was from -178 to -60 dBm. Knowledge of these values and insight in the factors
that determine them can help to quickly assess
wireless coverage in an indoor environment.
TABLE IV. REFLECTION COEFFICIENTS
Path Frequency n Distance (m)
1
28 2.86 8.4 11.1 67
38 2.92 9.4 12.2 67
2
28 3.42 9.4 12.6 38
38 3.51 8.6 11.4 38
3
28 3.85 9.5 12.9 58
38 4.11 6.6 9.7 58
Fig. 8. Numerical simulation of the coverage map at 28 GHz an indoor environment.
IV.
C
ONCLUSIONSWe have characterized the reflection and transmission coefficients of several building materials in mm-waves. Furthermore, we have demonstrated the path losses in an indoor environment follow a log-distance propagation model of which the propagation coefficient can be determined. This methodology enables a rapid assessment of wireless coverage in general indoor environments. A more detailed comparison with simulated results, for a wider variety of environments, will be performed as a future work. Such a study is expected to lead to better insight in uncertainties and correction factors, if any, to be taken into account. Armed with this insight, eventually a sophisticated radio planning in a wide variety of environments will be possible without the need for extensive measurements. As a final conclusion, the obtained results contribute to the planning of the future 5G networks, operating in mm-waves.
V.
R
EFERENCES[1] Cisco Systems Inc., "Cisco Visual Networking Index: Global Mobile Data Traffic Forecast Update, 2016–2021," White Paper, Feb. 2017.
[2] ITU-R, " M.2370-0 IMT traffic estimates for the years 2020 to 2030," 2015. [3] Attenuation by atmospheric gases, ITU-R Standard P.676-11, 2016.
[4] Specific Attenuation model for rain for use in prediction methods, ITU-R Standard P.838-3, 2005.
[5] T. S. Rappaport, G. R. MacCartney, M. K. Samimi, and S. Sun, “Wideband Millimeter-Wave Propagation Measurements and Channel Models for Future Wireless Communication System Design,” IEEE Transactions on Communications, v. 63, n°. 9, pp. 3029-3056, Sep. 2015.
[6] H. Zhao, R. Mayzus, T. S. Rappaport, “28 GHz Millimeter Wave Cellular Communication for Reflection and Penetration Loss in and around Buildings in New York City,” IEEE Wireless Communications Symp., pp. 5163-5167, Jun. 2013.
[7] O. Landron, M. J. Feuerstein, T. S. Rappaport, “In Situ Microwave Reflection Coefficient Measurements for Smooth and
Rough Exterior Wall Surfaces,” IEEE Vehicular Technology Conference, May. 1993.
[8] G. R. Maccatney, J. Zhang, S. Nie, T. S. Rappaport, “Path Loss for 5G Millimeter Wave Propagation Channels in Urban Microcells,” IEEE Global Communications Conference, Dec. 2013.
[9] C. C. Pu, S.Y. Lim, P. C. Ooi “Measurement Arrangement for the Estimation of Path Loss Exponent in Wireless Sensor
Network” IEEEComputing and Convergence Technology (ICCCT), Dec. 2012.
[10] M. H. Sunil Srinivasa, “Path loss exponent estimation in large wireless networks” Information Theory and Applications Workshop, Feb. 2009.
[11] G. L. Yongchang Hu, “Self-Estimation of Path-Loss Exponent in Wireless Networks and Applications” IEEE Transactions on Vehicular Technology, vol. 64, no. 11, Nov. 2015.