Article
J. Braz. Chem. Soc., Vol. 27, No. 6, 1067-1077, 2016. Printed in Brazil - ©2016 Sociedade Brasileira de Química 0103 - 5053 $6.00+0.00
*e-mail: [email protected]
Quantification of Synthetic Amino-Nitroquinoxaline Dyes: An Approach Using
Image Analysis
Lilian C. da Silva,a Djalan F. de Lima,a Janine A. Silva,a Camilo L. M. de Morais,a
Brunno L. Albuquerque,b Adailton J. Bortoluzzi,c Josiel B. Domingos,b
Renata M. Araújo,a Fabrício G. Menezesa and Kássio M. G. Lima*,a
aGrupo de Pesquisa em Química Biológica e Quimiometria, Instituto de Química, Universidade
Federal do Rio Grande do Norte, 59072-970 Natal-RN, Brazil
bLaboratório de Catálise Biomimética and cLaboratório de Bioinorgânica e Cristalografia,
Departamento de Química, Universidade Federal de Santa Catarina, 88040-900 Florianópolis-SC, Brazil
This paper describes the use of digital imaging acquired from a conventional desktop scanner for characterization of newly synthesized amino-nitroquinoxaline dyes. The synthetic protocol was based on reactions of building block 2,3-dichloro-6,7-dinitroquinoxaline with aliphatic amines and experiments based on image analysis were carried out with compounds in solution (96-microwell plates) and/or adsorbed on silica (thin-layer chromatography (TLC) plates). Three main goals were achieved: firstly, compounds 2-chloro-6,7-dinitro-3-pyrrolidinoquinoxaline and 6,7-dinitro-2,3-dipyrrolidinoquinoxaline had their concentration predicted in dimethyl sulfoxide (DMSO) solution, as a mixture. Secondly, TLC studies were performed to build a kinetic profile in attempt to monitor reaction involving conversion of 2-chloro-6,7-dinitro-3-pyrrolidinoquinoxaline into 6,7-dinitro-2,3-dipyrrolidinoquinoxaline. Lastly, image analysis and UV-Vis spectroscopy were applied to study the interaction of 2,3-di-n-butylamino-6,7-dinitroquinoxaline with hydroxide anion in DMSO. These approaches based on digital image characterization were successfully implemented in qualitative and quantitative analysis of organic dyes.
Keywords: amino-nitroquinoxaline dyes, characterization, RGB
Introduction
Nitrogen heterocyclic compounds have been extensively reported in the literature due to their relevance in many fields.1,2 Quinoxaline consists of a heteroaromatic system that has attracted considerable attention in biological, environmental and technological areas. For example, two recent reviews reported a broad spectrum of biological activities for its derivatives, such as anticancer, antimicrobial, antiviral, anti-inflammatory, antidiabetes, among others.3,4 In addition, quinoxalines are well established as antagonists5,6 and found interacting with DNA.7 On the other hand, several papers are centered on the optical properties of quinoxaline derivatives and their applications as chemosensors for cations8,9 and anions,10,11 as well as functional materials such as organic light-emitting diodes (OLED),12-14 liquid crystals15,16 and solar cells.17,18 Due to these latter relevant applications
based on color properties of organic compounds, we found reactions of 2,3-dichloro-6,7-dinitrioquinoxaline (1) with
aliphatic amines emerging as an interesting approach for obtainment of synthetic quinoxaline dyes especially by the mild conditions of aromatic nucleophilic substitution in highly activated substrates and the intense color found in aromatic compounds bearing both amino and nitro groups.19-21
Color properties of dyes are usually explored through UV-Vis spectroscopy, however, in the last decade, applications of colorimetric techniques based on the red, green and blue (RGB) system have been successfully employed as an alternative tool for characterization of colored chemical species and systems. For example, conventional desktop scanners have been used for quantification of potassium using disposable sensors based on chromoionophore chemistry,22 monitoring organic reactions,23 quantification of pigments in green beans,24 determination of nitrogen
several biological purposes,26-29 including those related to dyes generated through enzymatic colorimetric methods or synthetic chemicals. Although the above-mentioned studies have shown that the desktop scanner could be used for colored systems characterization, little research has been directed toward the characterization of synthetic dyes, including reactivity studies. In this context, we decided to extend the studies involving reactivity of chloro-nitro aromatic substrates toward amines21 to characterize some amino-nitroquinoxaline dyes by applying a digital image-based method on the RGB system.
The herein reported work involves synthesis and image analysis of quinoxaline dyes in solution and/or adsorbed on thin-layer chromatography (TLC) plates in attempt to obtain their color change signatures. Three dyes were chosen from our synthetic works involving synthesis of amino-nitroquinoxaline derivatives and the experiments involving image analysis were divided into three main purposes: (i) to quantify compounds 2-chloro-6,7-dinitro-3-pyrrolidinoquinoxaline (2) and
6,7-dinitro-2,3-dipyrrolidinoquinoxaline (3) in solution (dimethyl sulfoxide,
DMSO), alone or as a mixture; (ii) to perform a kinetic study of nucleophilic substitution reaction involving transformation of 2 into 3,in chloroform based on data obtained from
TLC analysis; and (iii) to investigate the deprotonation of compound 2,3-di-n-butylamino-6,7-dinitroquinoxaline (4)
by action of sodium hydroxide in DMSO aiming for possible applications of this compound as a chemosensor for anions. For studies in solution, the method was adapted to a 96-microwell plate containing colored species which can be directly scanned by using a commercially available desktop scanner. For the TLC studies, we proposed quantification of the amino-nitroquinoxaline derivatives through digitized chromatogram processing. To the best of our knowledge, there is no work reported in literature involving characterization of amino-nitroquinoxaline dyes by using RGB and image processing.
Experimental
General
All reagents and solvents were purchased from commercial sources (Sigma-Aldrich and Merck) in adequate analytical grade and used without further purification, except for the amines, which were distilled prior to use. TLC plates were purchased directly from Sigma-Aldrich. Deuterated solvents were obtained from Tedia and Cambridge Isotope. Plates with 96 microwells (enzyme-linked immunosorbent assay, ELISA) were acquired from Fisher Scientific.
Instrumentation
Elemental analyses were performed in a Carlo Erba E-1110 instrument. Melting points were taken in a Microquímica MQAPF-301 and were not corrected. Fourier transform infrared spectra (FTIR) were obtained in a PerkinElmer model 283 equipment or in a Shimadzu FTIR-8400S. UV-Vis spectra were acquired with a UV-Vis spectrophotometer (Thermo Scientific Evolution 60S) using a 10 mm path length quartz cuvette. Nuclear magnetic resonance (NMR) analysis was performed in a Bruker Avance DPX-300 or in a Varian Mercury Plus 400 MHz instrument. X-Ray crystallographic analysis was carried out with an Enraf-Nonius CAD4 diffractometer with
graphite-monochromated Mo Kα radiation, at room temperature.
An HP Scanjet G2410 scanner (Hewlett-Packard) was
used to obtain images of 200 × 200 dpi resolution and
701 × 1058 pixels in size.
Synthesis and characterization
2,3-Dichloro-6,7-dinitroquinoxaline (1) was synthesized
in a three-step protocol as previously described.30
General procedure for obtainment of mono-amino substituted quinoxaline derivatives
A solution containing 0.35 mmol of pyrrolidine in 2.0 mL of acetonitrile was added dropwise to a solution of 0.100 g (0.35 mmol) of substrate 1 in 3.0 mL of acetonitrile/
chloroform 2:1 v/v. After the addition, reaction media was stirred at room temperature until total conversion into products (verified by TLC (Scheme 1)). Lastly, the volatile components were distilled under reduced pressure and the solid residue recrystallized from ethanol to afford desired products.
2-Chloro-6,7-dinitro-3-pyrrolidinoquinoxaline (2)
m.p. 170 oC; IR (KBr) v
max / cm-1 2966, 1543, 1539,
1456, 1327,1078, 915; 1H NMR (400.1 MHz, DMSO-d
6)
d 8.60 (s, 1H, Ar–H), 8.11 (s, 1H, Ar–H), 3.76 (B, 4H,
CH2), 1.95 (B, 4H, CH2); 13C NMR (100.6 MHz, DMSO-d6) d 149.99, 143.44, 143.36, 141.47, 135.78, 134.70, 125.94, 122.01, 50.91, 25.08; anal. calcd. for C12H10ClN5O4: C, 44.53; H, 3.11; N, 21.64; found: C, 44.60; H, 3.20; N, 21.70; yield: 90%.
Obtainment of di-amino substituted quinoxaline derivatives (compounds 3 and 4)
First, 0.100 g (0.35 mmol) of substrate 1 were added
chloroform 4:1 v/v. The resulting solution was kept under magnetization at room temperature, stirring until the reaction was complete (verified by TLC (Scheme 1)). Then, solvent was distilled under reduced pressure, and the obtained solid residue recrystallized from ethanol to yield desired products.
6,7-Dinitro-2,3-dipyrrolidinoquinoxaline (3)
m.p. 216 oC; IR (KBr) v
max / cm-1 2933, 1541, 1446,
1344, 1262, 856; 1H NMR (400.1 MHz, DMSO-d
6) d 8.08
(s, 2H, Ar–H), 3.63 (B, 4H, CH2), 1.70 (B, 4H, CH2);
13C NMR (100.6 MHz, DMSO-d
6) d 148.7, 139.4, 137.5, 121.1, 49.1, 24.6; anal. calcd. for C16H18N6O4: C, 53.63; H, 5.06; N, 23.45; found: C, 53.70; H, 5.12; N, 23.50; yield: 93%.
2,3-Di-n-butylamino-6,7-dinitroquinoxaline (4) m.p. 203 oC;IR (KBr) v
max / cm-1 3421, 2958, 2933,
2870, 1543, 1502, 894, 848; 1H NMR (400.1 MHz,
DMSO-d6) d 8.79 (s, 2H, Ar–H), 4.36 (B, 4H, CH2), 2.50 (m, 4H, CH2), 2.26 (m, 4H, CH2), 1.79 (t, 6H, J 6.7 Hz, CH3); 13C NMR (100.6 MHz, DMSO-d6) d 145.4, 138.8, 137.2, 120.9, 40.8, 30.1, 19.8, 13.7; anal. calcd. for C16H22N6O4: C, 53.03; H, 6.12; N, 23.19; found: C, 53.12; H, 6.25; N, 23.25; yield: 90%.
X-Ray crystallography
In the crystallographic analysis of compound 3, cell
parameters were determined from 25 centered reflections
in the theta range from 6.79 to 16.93o. All data were
corrected for Lorentz and polarization effects. The structure was solved by direct methods and refined by full-matrix
least-squares methods using SIR9731 and SHELXL9732
programs, respectively. All non-hydrogen atoms were refined isotropically. H atoms attached to C atoms were placed at their idealized positions, with C–H distances
and Ueq values taken from the default settings of the
refinement program. The Oak Ridge thermal ellipsoid plot
(ORTEP) was drawn using PLATON33 software. Selected
crystallographic data are shown in Table 1, and full crystallographic tables for compound 3 have been deposited
with the Cambridge Crystallographic Data Centre.
UV-Vis spectroscopy
Stock solutions of compounds 2-4 were 5.0 mmol L-1
in DMSO. Single UV-Vis spectra of compounds 2 and 3
were obtained from dilution of appropriate stock solutions
to 0.05 mmol L-1 in DMSO. Acid-base investigation was
based on changes in UV-Vis spectra of compound 4
(0.05 mmol L-1) upon addition of 0-100 NaOH eq in DMSO. The blank in these experiments was always 99.5% DMSO. The UV-Vis spectra are shown in Figure S1 (Supplementary Information).
Studies based on image analysis
Compounds 2 and 3 in solution: system calibration
First, twelve alone solutions of compounds 2 and 3
were prepared in DMSO, with concentrations from 5.0 to 0.0024 mmol L-1 (always diluting by half) for calibration sets and with mixtures of both compounds in several ratios: (2:3
in mmol L-1) 5.0:0.0, 4.5:0.5, 4.0:1.0, 3.5:1.5, 3.0:2.0, 2.5:2.5, 2.0:3.0, 1.5:3.5, 1.0:4.0, 0.5:4.5 and 0.0:5.0, in DMSO. Lastly, 250 µL of each solution were added separately to the microplate for scanning and image acquisition. An illustration of the microwell plate is presented in Figure S2.
Kinetic study involving conversion of compound 2 into 3
First, for obtaining calibration sets, 1 µL of solutions
containing compounds 2 and 3, alone in CHCl3 with
concentrations ranging from 1.0 to 8.0 mmol L-1
(always diluting by half), were placed separately on chromatographic plates (Figure S3). In the kinetic study, 100 µL of a solution of compound 1 (0.32 mol L-1) in CHCl
3 were added to 100 µL of pyrrolidine (1 molar eq) solution, also in CHCl3. TLC analysis of the reaction media was then conducted along with reagent mixed and at different times (30, 60, 90, 120, 180, 240, 300, 600, 1200 and 1800 s) by adding 10 µL of the reaction media onto the TLC plates. All the final chromatograms were directly scanned to generate their digital image.
Interaction of compound 4 with hydroxide anion in DMSO
In this study, 250 µL of six solutions containing
compound 4 (0.05 mmol L-1) and different amounts of
NaOH (0, 20, 40, 60, 80 and 100 eq) in DMSO were placed separately in microplate wells and then digital images were acquired by using a desktop scanner.
Studies based on RGB system and image processing
The digital images were obtained in tagged image file format (TIFF) by scanning the 96-microwell ELISA microplates or TLC plates, which were placed onto the center of the desktop scanner. The next step was to extract the regions of interest (ROIs) from each microwell by square cutting each microwell with the size of 21 × 21 pixels. The same procedure was performed for TLC plate images, but with a difference in the size of the ROIs cutting, which in this case was a square portion of 6 × 6 pixels as the spot on the TLC plate is smaller than an ELISA microwell of 250 µL. The image loading process was performed using the ‘imread’ command on MATLAB environment
(MATLAB® 7.12, MathWorks) and the cutting process was
performed through a lab-made algorithm for automating cutting based on ‘imcrop’ function, as the cut procedure was always made by checking for a good signal and symmetry for each spot or microwell.
As each colored image on the RGB scale is composed of three data matrix referring to the red (R), green (G) and blue (B) channels,34 the next step was to calculate the average value of each RGB image by the ‘mean2’ command on MATLAB. The average value of each RGB matrix corresponds to the arrangement which composes the image intensity, and their calculation is shown in equations 1-3:
(1)
(2)
(3)
where is intensity calculated for the R = (rij) m × n matrix,
IG is intensity calculated for G = (gij) m × n matrix and IB is intensity calculated for B = (bij) m × n matrix, considering
an image of size m × n pixels.
The intensity of each RGB channel is indirectly proportional to the concentration of the analyte (dye) on the image, since when the image gets darker, the intensities of RGB values tend to 0, and, on the order hand, when the image receives light, the intensities of RGB values
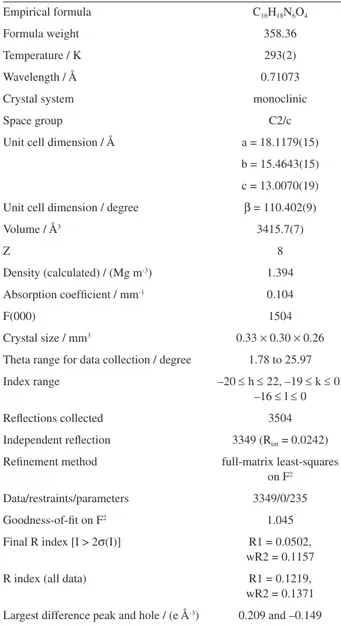
Table 1. Crystal data and structure refinement for 3
Empirical formula C16H18N6O4
Formula weight 358.36
Temperature / K 293(2)
Wavelength / Å 0.71073
Crystal system monoclinic
Space group C2/c
Unit cell dimension / Å a = 18.1179(15)
b = 15.4643(15)
c = 13.0070(19) Unit cell dimension / degree β = 110.402(9)
Volume / Å3 3415.7(7)
Z 8
Density (calculated) / (Mg m-3) 1.394
Absorption coefficient / mm-1 0.104
F(000) 1504
Crystal size / mm3 0.33 × 0.30 × 0.26
Theta range for data collection / degree 1.78 to 25.97 Index range –20 ≤ h ≤ 22, –19 ≤ k ≤ 0,
–16 ≤ l ≤ 0
Reflections collected 3504
Independent reflection 3349 (Rint = 0.0242)
Refinement method full-matrix least-squares on F2
Data/restraints/parameters 3349/0/235
Goodness-of-fit on F2 1.045
Final R index [I > 2σ(I)] R1 = 0.0502, wR2 = 0.1157
R index (all data) R1 = 0.1219,
wR2 = 0.1371
Largest difference peak and hole / (e Å-3) 0.209 and –0.149
tend to 255.34 Also, the RGB intensities can be used for calculating the absorbance of the RGB channels based on the Beer-Lambert law, giving the RGB-resolved absorbance values (see equation S1).35
It is also possible to convert the RGB intensity to grayscale intensity, using equation 4, in which the grayscale intensity, , also presents a linear relation with concentration ranging:
Igray = 0.30IR + 0.59IG + 0.11IB (4)
An illustrative description of the experiments involving acquisition and image analysis based on the RGB system for characterization and reactivity studies involving the herein reported amino-nitroquinoxaline dyes is presented in Figure 1.
Calibration using UV-Vis data and partial least squares (PLS) regression
Partial least squares (PLS)36 regression was employed to the UV-Vis data of dyes 2 and 3 in mixture to evaluate
prediction performance by means of the root mean square error of calibration (RMSEC), root mean square error of cross validation (RMSECV), root mean square error of prediction (RMSEP) and the R2 parameters for the data sets
of the external validation samples (predicted vs. reference values).
Both calibration and prediction sets were built using samples of dyes in mixture, being their spectra pre-processed by mean-centering. Two latent variables (LVs) were used in the calibration step, with a percentage of explained variance > 99%. Six samples were used in the calibration set and five in the validation set, selected
by Kennard-Stone algorithm.37 The concentration range
studied was from 0.010 to 0.070 mmol L-1 for both dyes
in mixture.
Results and Discussion
Synthesis and spectroscopic characterization
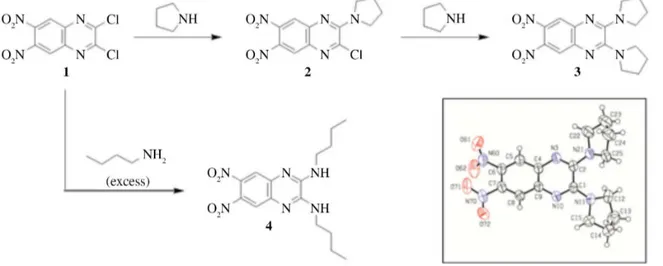
In this work, mono- and di-amino-nitroquinoxaline derivatives were synthesized as presented in Figure 2, from reactions of substrate 1 with appropriate amount of
the selected amines and isolated in good yields (85-93%). Building block 1 is converted into amino-nitroquinoxaline 2
through monosubstitution of chlorine group with 1 eq of pyrrolidine, which can be then sequentially converted into
3 by action of one more eq of the referred amine. In fact,
products arising from double substitution of chlorine can be obtained directly from reactions of 1 with excess of
Figure 1. Experimental arrangement to collect and analyze images for scanometric characterization of amino-nitroquinoxaline dyes. (a) Three synthesized
quinoxalines (2-4) elected for image-based experiments; (b) commercially available desktop scanner; (c) microplate of flat-bottomed 250 mL microwells;
amines such as in obtainment of diamino derivative 4. All
proposed structures of the synthesized compounds are in
full agreement with elemental analyses and IR, 1H NMR
and 13C NMR spectroscopic data. Additionally, compound 3 had its structure confirmed by X-ray crystallography (Figure 2, inset).
As can be seen in Figure S1, the UV-Vis spectrum of dye
2 (0.05 mmol L-1, DMSO) showed one maximum absorption
wavelength in the selected region (300-500 nm) at 404 nm,
while compound 2 exhibited absorption at 323, 397 and
450 nm (shoulder). Both compounds have amino and nitro moieties connected through a π-extended conjugated system, favoring electronic density delocalization and color induction.
Correlating digital image to concentration of dyes 2 and 3 in solution
As expected for aromatic compounds containing both amino and nitro groups, herein synthesized quinoxalines
are yellow-orange colored dyes,21 and consequently,
absorption bands in the UV-Vis spectra of these compounds overlap, especially in the visible region for dyes 2 and 3
(Figure S1). This fact makes quantification of these two compounds in a mixture through UV-Vis spectroscopy very difficult (Figure S1), which induces the need for more sophisticated and expensive techniques, such as liquid
or gas chromatography and 1H NMR. In an attempt to
overcome these possible drawbacks, a protocol involving image acquisition of solutions with a conventional flatbed scanner followed by image analysis based on the RGB color system emerges as an alternative to this purpose.
However, it was found that sensibility of the image method decreases as concentration of the colored species
becomes lower than 0.05 mmol L-1, leading to possible
inaccurate results. In fact, this finding is also corroborated by other reported works, and may also be influenced by effects of surrounding light in the digital image acquisition.34
Thence, different color signal values as RGB intensity, gray intensity and RGB-resolved absorbance were used to build the calibration curves of the pure studied compound, in mixture, and for kinetic profile study. Table 2 summarizes the color signal value for each calibration curve and compound.
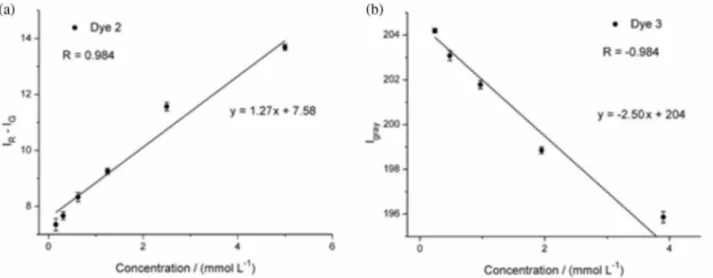
Quantification of compounds 2 and 3 in DMSO
solution was initiated by obtaining a calibration set, in which color intensity of scanned solutions are able to be directly correlated to the concentration of the chemical species (Figures 3a and 3b, respectively, for 2 and 3). The
experiment was performed separately for each dye and concentrations varied from 0.0024 to 5.0 mmol L-1. Here it is relevant to point out that the highest concentration
Figure 2. Synthetic strategy for obtainment of amino-nitroquinoxaline dyes 2 and 3. Inset: ORTEP illustration of compound 3 determined by X-ray
crystallography.
Table 2. Color signal response for each compound and characterization/ quantification study
Objective Compound Color signal
Calibration curve of the pure compound
2 red – green intensities
3 gray intensity
Quantification of the compound in mixture
2 gray intensity
3 gray intensity
Kinetic profile for consumption/formation
2 rgb-resolved absorbance for blue channel
3 rgb-resolved absorbance for blue channel
values led to saturation problems. The best model for a
calibration set related to mono-amino derivative 2 was
based on subtraction of R – G intensities, which presented a correlation coefficient between predicted and measured values of 0.984 (Figure 3a). In this model, equations 1 and 2 were used to calculate color intensity of the dye in solution. On the other hand, a model based on the intensity of grayscale (equation 4) was found to present more accurate results for characterization of dye 3 in solution,
with a correlation coefficient of –0.984 (Figure 3b). The performance of the RGB models was assessed using the common statistical measures RMSEC and RMSECV.
The RMSEC values for dyes 2 and 3 were both equal to
0.30 mmol L-1. In addition, cross-validation leave-one-out was applied to both calibration, giving a RMSECV value of 0.67 and 0.87 mmol L-1 for dyes 2 and 3, respectively. A comparison of the RMSEC and RMSECV values showed that over-fitting was not a problem for the model, since the
RMSEC and RMSECV are of the same magnitude. The limits of detection (LOD) and quantification (LOQ) for dye 2 were equal to 0.012 and 0.040 mmol L-1, respectively.
For dye 3, the LOD and LOQ values were equal to 0.004
and 0.013 mmol L-1, respectively.
Sequentially, binary mixtures of compounds 2 and 3
were prepared to test the feasibility of using the RGB-based image analysis method for characterization/quantification of these dyes in solution (Figure 4). The procedure is described in Experimental and was based on more intense
colored dye (3). Concentration of compound 3 in each
mixture was determined using the calibration curve presented in Figure 3b. Equation 5 was applied to calculate concentration of dye 2 in mixture based on intensity of the
image in grayscale (Igray).
(5)
Figure 3. Calibration curves created using (a) intensity values from red and green channels in scanned images for the amino-nitroquinoxaline dye 2, and
(b) using intensity values of grayscale for the amino-nitroquinoxaline dye 3.
Results obtained for quantification of dyes 2 and 3 in
mixed solutions are summarized in Table 3. The RMSEP
value calculated for dyes 2 and 3 were equal to 0.22
and 0.39 mmol L-1, respectively. In addition, analysis of variance (ANOVA) test was performed for both dyes in mixture, giving F and p values of 0.035 and 0.854 for dye 2;
and 0.270 and 0.609 for dye 3, respectively.
As expected in these experiments, predicting concentration of the dyes in solution are more accurate in higher concentrations (until saturation limit) since the intensity of the solutions are stronger.
The angular coefficients close to 1.00 and the linear coefficient close to zero presented in Figures 4a and 4b show that the predicted concentration calculated using the image analysis are very accurate and express results near the real concentration of these compounds in the mixture.
Further, in order to confirm the relevance of the method based on image analysis, we tried to quantify compounds 2
and 3 in a mixture by using univariate and multivariate
calibration directly on UV-Vis spectroscopic data (Figures S4 and S5, and Table S1). Although univariate calibration curves for compounds 2 and 3, alone, were found to present
quite good linear correlation between reflectance function and concentration, they were not possible to be quantified precisely by this procedure (correlation of 0.823 and 0.743 for 2 and 3, respectively). As can be seen, even the best
possible prediction results obtained by a univariate method are very poor. For multivariate calibration results, although we have also found a linear correlation between absorbance and concentration for calibration data set, the prediction results obtained by PLS method are poor.
These findings strongly support the strategy based on image analysis and multivariate calibration for
simultaneous quantification of dyes 2 (R2 = 0.993) and 3
(R2 = 0.993). In fact, the use of digital image analysis was found to overcome problems related to lack of selectivity found in UV-Vis analysis, in which it is usually not possible to predict concentration of one single analyte in a mixture when the spectra of two absorbers overlap. One additional point that must be considered is RGB being a good (probably the best) choice for multivariate calibration purposes since one of the major problems in data treatment is to select appropriate spectral region in order to achieve the best performance.
Conversion of 2 into 3: kinetic profile based on TLC and image analysis
Kinetics of nucleophilic substitution reactions involving aromatic substrates such as halonitrobenzene derivatives have been the subject of several publications.38-40 Usually these investigations are especially based on UV-Vis
spectroscopy, however, 1H NMR and, more recently,
computational approaches are also found as well established tools. One limitation on the use of UV-Vis in kinetics is related to the peculiar situation in which both substrate and product absorb in similar regions, such as compounds 2 and 3 (Figure S1). In this context, it was decided to explore TLC
and digital image analysis in the transformation of mono- to di-amino quinoxaline dyes. It is important to point out that image analysis was found to be a relevant strategy to be
employed since predicting concentration of compounds 2
and 3 through UV-Vis and image analysis did not present
good results for this dye system. Firstly, calibration sets were obtained by adding 10 µL of compounds 2 and 3 (at
concentration values ranging from 1.0 to 8.0 mmol L-1) to
Table 3. Predicted and measured concentrations of compounds 2 and 3 in binary mixtures
Experimental concentration of 2 / (mmol L1)
Predicted concentration
of 2 / (mmol L1) Relative error / %
Experimental concentration of 3 /
(mmol L1)
Experimental concentration of 3 /
(mmol L1)
Relative error / %
0.0 0.2 100 5.0 5.0 0.0
0.5 0.5 0.0 4.5 4.7 4.4
1.0 1.0 0.0 4.0 4.3 7.5
1.5 1.4 6.7 3.5 3.8 8.6
2.0 1.8 10 3.0 3.4 13
2.5 2.5 0.0 2.5 2.8 12
3.0 2.7 10 2.0 2.5 25
3.5 3.1 11 1.5 2.1 40
4.0 3.7 7.5 1.0 1.5 50
4.5 4.2 6.7 0.5 1.0 100
TLC plates (Figures S3 and S6). Since intensity of color of dye 3 is more intense, its saturation limit was found at
4.0 mmol L-1.
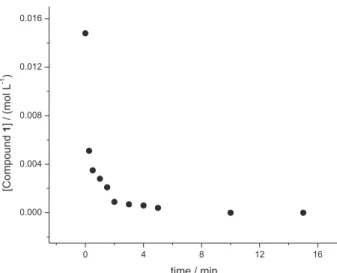
Then, having defined a tool which allows for the quantification of 2 and 3 when adsorbed in TLC plates,
a reaction kinetic profile was built. Since compound 2
is very reactive, only 1 eq of the pyrrolidine in CHCl3 as solvent was defined as a suitable condition to follow the reaction. In the experiment, a series of TLC analyses were made at set periods of time, which led to discrimination of the system composition over the time. Finally, from image analysis of the TLC plates, it was possible to build kinetic profiles based on consumption of 2 in the reaction media,
as presented in Figure 5. The method was found to be quite reproducible (the results are presented in triplicate (Figure S7)), especially if the non-automated system is taken into account (i.e., the operator needs to take an aliquot, place it on a TLC plate and elute inside the chromatographic chamber). In an attempt to mechanistically understand this reaction, these kinetic profiles were plotted as 1/[2] vs. time to evaluate a possible second order reaction, however, non-linear fit was found (Figure S8), which is compatible with a more complex rate law, possibly due to base catalysis and a limiting rate proton transfer step, commonly reported in nucleophilic substitution reactions involving halo-nitro aromatic substrates and amines.19,38,39
Acid-base equilibrium of compound 4 and HO– in DMSO
Our last goal focused on using image analysis in the characterization of chemical species is associated with
evaluating the interaction of compound 4 and hydroxide
anion, in DMSO, aiming at its possible future application and other similar dyes as a chemosensor for anions. The
acidity of compound 4 was initially evaluated by UV-Vis
through addition of aliquots of the stock solution to different
concentration solutions of HO– (1-100 eq). Evidence of
substrate deprotonation by the HO– was found by appearance of a new absorption band at 565 nm, which sharply increases above 40 eq of base (Figure 6a). Also, changes in the system can be visualized through direct naked eye colorimetric analysis, in which the color of the solution turns to red as concentration of hydroxide rises (Figure S9).
In the work of Yu et al.,41 it was found that HO– induces dissociation of the quinoxaline derivative 6,7-dinitroquinoxaline-2,3-dione (DNQX) in DMSO by abstracting two protons, which leads to an absorption band
at 462 nm. Comparing DNQX and 3, it is noted that the
respective dione is a more acidic species than the compound evaluated in the present work, as a consequence of a higher
Figure 5. Kinetics profile obtained using reflectance values from blue channel in scanned images for reagent (2) consumption and product (3)
formation.
Figure 6. (a) UV-Vis absorption spectra of 4 (0.05 mmol L-1) after the addition of different concentrations of hydroxide (0, 10, 20, 40, 60, 80 and 100 molar
stabilization of the conjugated base of 4. This is consistent
with the difference in the band absorption wavelength of these two deprotonated species and the more pronounced electron donating ability of the negative charged nitrogen in
4 compared to oxygen in DNQX. In Scheme 2, the reaction
of the diamino-quinoxaline derivative and hydroxide in DMSO is proposed, and it was found to be reversible by adding acid. The generated mono-anion species (7) has a
structural feature that allows hydrogen bond stabilization of the negative charge, as similarly described by Lin et al.42 for a similar bis-pyrrol functionalized maleimide.
Chemical transformations differing from acid-base process as mentioned above, such as nitro substitution and/or unproductive complexes formation, have already
been reported for substrates containing ortho-dinitro
aromatic system,40 and could lead to new absorption band formation. Such transformations were discarded since the
addition of compound 3 (absent of NH groups) to high
HO– concentration (100 molar eq) show no variance in
UV-Vis spectra (nor in the naked eye colorimetric analysis) in relation to the pure compound in the same solvent.
Finally, image analysis of each sample containing compound 4 and different amounts of HO– (0-100 eq) was performed, but it was not possible to estimate concentration values of the substrate and its anionic form based on the B channel since both acid and conjugated base species present close absorption in the spectral region of 400-430 nm. However, a linear correlation between concentration of HO– (in molar eq) and absorbance values was found, determined by both image analysis using channel G-R (Figure 6b), and UV-Vis spectroscopy (at 565 nm). Since the variance of absorbance must be relative to a new colored anionic species formation (7), such linear correlations suggest that
characterization based on digital image could be interesting for future experiments based on color changes between chemical species and due to the possibility of monitoring reaction progress.
Conclusions
In this work, the feasibility of using digital images for characterization of new amino-nitroquinoxalines dyes
was demonstrated by directly scanning microwell plates containing the referred dyes in solution or TLC plates in which dyes had been adsorbed onto them. This alternative approach was based on the use of a conventional desktop scanner and image processing based on RGB system. The three main goals were focused on: (i) predicted concentration values of dyes 2 and 3 in solution and adsorbed onto TLC
plates; (ii) to monitor chemical transformation of 2 to 3 by
building a kinetic profile from TLC analysis; and (iii) to investigate acid-based reaction of dye 4 in presence of
HO– in DMSO. Although the analysis of dyes is usually
performed through standard instrumental methods, this fast and inexpensive alternative method based on image analysis was found to be quite relevant since it allowed for discrimination and characterization of structurally similar dyes, and it also emerged as an accessible tool for synthesis and preliminary reactivity studies.
Supplementary Information
Supplementary data are available free of charge at http://jbcs.sbq.org.br as PDF file. Full crystallographic tables
for compound 3 have been deposited with the Cambridge
Crystallographic Data Centre as supplementary publication number CCDC 1009847. These data can be obtained free of charge from the Cambridge Crystallographic Data Centre via www.ccdc.cam.ac.uk/data_request/cif.
Acknowledgments
C. L. M. M. thanks Propesq-PIBIC-UFRN and Conselho Nacional de Desenvolvimento Científico e Tecnológico (CNPq) for financial support. K. M. G. L. acknowledges the CNPq/Coordenação de Aperfeiçoamento de Pessoal de Nível Superior (CAPES) projects (grant 070/2012 and 442087/2014-4) and FAPERN (grant 005/2012) for financial support. F. G. M. acknowledges FAPERN (grant 005/2012) for financial support. L. C. S., J. A. S. and D. F. L. thank CAPES and PROGRAD-UFRN for scholarships. A. J. B. thanks Financiadora de Estudos e Projetos (FINEP).
References
1. Brown, D. J.; Chemistry of Heterocyclic Compounds; John
Wiley & Sons: New York, 2002, pp. 557.
2. Miranda, F. D. S.; Menezes, F. G.; Vicente, J.; Bortoluzzi, A. J.; Zucco, C.; Neves, A.; Gonçalves, N. S.; J. Mol. Struct. 2009,
938, 1.
3. Pereira, J. A; Pessoa, A. M.; Cordeiro, M. N. D. S.; Fernandes, R.; Prudêncio, C.; Noronha, J. P.; Vieira, M.; Eur. J. Med. Chem. 2015, 97, 664-672.
4. Ajani, O. O.; Eur. J. Med. Chem. 2014, 85, 688. 5. Armstrong, N.; Gouaux, E.; Neuron 2000, 28, 165.
6. Chambers, J. J.; Gouda, H.; Young, D. M.; Kuntz, I. D.; England, P. M.; J. Am. Chem. Soc. 2004, 126, 13886.
7. Metobo, S. E.; Jin, H.; Tsiang, M.; Kim, C. U.; Bioorg. Med. Chem. Lett. 2006, 16, 3985.
8. Kumar, A.; Kumar, V.; Diwan, U.; Upadhyay, K. K.; Sens. Actuators, B 2013, 176, 420.
9. Singla, P.; Kaur, P.; Singh, K.; Talanta 2014, 130, 571. 10. Chen, C.; Lin, T.; Chen, C.; Lin, S.; Tseng, M.; Wen, Y.; Sun, S.;
J. Org. Chem. 2008, 73, 900.
11. Wu, C. Y.; Chen, M. S.; Lin, C. A.; Lin, S. C.; Sun, S. S.; Chem. - Eur. J. 2006, 12, 2263.
12. Danel, A.; Gondek, E.; Kityk, I.; Opt. Mater. 2009, 32, 267.
13. Jang, J. W.; Park, H.; Shin, M. K.; Kang, H. H.; Oh, D. H.; Jung, S. O.; Kwon, S. K.; Kim, Y. H.; Dyes Pigm. 2011, 88, 44.
14. Achelle, S.; Baudequin, C.; Plé, N.; Dyes Pigm. 2013, 98, 575. 15. Bushby, R. J.; Hamley, I. W.; Liu, Q.; Lozman, O. R.; Lydon,
J. E.; J. Mater. Chem. 2005, 4429.
16. Chen, C. J.; Wu, Y. C.; Sheu, H. S.; Lee, G. H.; Lai, C. K.;
Tetrahedron 2011, 67, 114.
17. Pei, K.; Wu, Y.; Islam, A.; Zhu, S.; Han, L.; Geng, Z.; Zhu, W.;
J. Phys. Chem. C 2014, 118, 16552.
18. Wang, L.; Yang, X.; Wang, X.; Sun, L.; Dyes Pigm. 2015, 113,
581.
19. Smith, M. B.; March, J.; Advanced Organic Chemistry: Reactions, Mechanisms and Structure, 6th ed.; John Wiley and
Sons: Hoboken, 2007.
20. Carey, F. A.; Sundberg, R. J.; Advanced Organic Chemistry. Part A: Structure and Mechanisms, 5th ed.; Springer: New York,
2007
21. Menezes, F. G.; Ricardo, J.; Dias, R.; Bortoluzzi, A. J.; Zucco, C.; Quim. Nova 2007, 30, 356.
22. Lapresta-Fernández, A.; Capitán-Vallvey, L. F.; Sens. Actuators, B 2008, 134, 694.
23. Javidnia, K.; Parish, M.; Karimi, S.; Hemmateenejad, B.;
Spectrochim. Acta, Part A 2013, 104, 175.
24. Valverde, J.; This, H.; Vignolle, M.; J. Chem. Educ. 2007, 84, 1505.
25. Filho, J. P.; Flávio, J.; Alves, A.; Talanta 2015, 140, 73. 26. Hu, H.; Li, H.; Zhao, Y.; Dong, S.; Li, W.; Qiang, W.; Xu, D.;
Anal. Chim. Acta 2014, 812, 152.
27. Yeh, C. H.; Wang, I. L.; Lin, H. P.; Chang, T. C.; Lin, Y. C.;
Procedia Chem. 2009, 1, 256.
28. Parween, S.; Nahar, P.; J. Biosci. Bioeng. 2015, 119, 113.
29. Lönnberg, M.; Carlsson, J.; Anal. Biochem. 2001, 293, 224. 30. Teja, R.; Kapu, S.; Kadiyala, S.; Dhanapal, V.; A. N. R.; J. Saudi
Chem. Soc. 2013. DOI:10.1016/j.jscs.2012.12.011.
31. Altomare, A.; Burla, M. C.; Camalli, M.; Cascarano, G. L.; Giacovazzo, C.; Guagliardi, A.; Moliterni, A. G. G.; Polidori, G.; Spagna, R.; J. Appl. Crystallogr. 1999, 32, 115.
32. Herbst-Irmer, R.; Sheldrick, G. M.; Acta Crystallogr., Sect. B: Struct. Sci.1998, 54, 443.
33. Spek, A. L.; J. Appl. Crystallogr. 2003, 36, 7
34. Morais, C. L. M.; Lima, K. M. G.; Talanta 2014, 126, 145.
35. Christodouleas, D. C.; Nemiroski, A.; Kumar, A. A.; Whitesides, G. M.; Anal. Chem. 2015, 87, 9170.
36. Wold, S.; Sjöström, M.; Eriksson, L.; Chemom. Intell. Lab. Syst.
2001, 58, 109.
37. Kennard, R. W.; Stone, L. A.; Technometrics 1969, 11, 137. 38. Senger, N. A.; Bo, B.; Cheng, Q.; Kee, J. R.; Gronert, S.; Wu, W.;
J. Org. Chem. 2012, 77, 9535.
39. Um, I.; Im, L.; Kang, J.; Bursey, S. S.; Dust, J. M.; J. Org. Chem.
2012, 77, 9738.
40. Blaskó, A.; Bunton, C. A.; Gillitt, N. D.; Bacaloglu, R.; Yunes, S. F.; Zucco, C.; J. Braz. Chem. Soc. 2013, 24, 1146. 41. Yu, M.; Lin, H.; Lin, H.; Supramol. Chem. 2008, 20, 309.
42. Lin, Z.; Chen, H. C.; Sun, S.-S.; Hsu, C.-P.; Chow, T. J.;
Tetrahedron 2009, 65, 5216.
Submitted: August 25, 2015