*e-mail: [email protected]
1. Introduction
A dimethyl sulfoxide (DMSO) adduct of uranyl triluoroacetate UO2(TFA)2 with a 1:3 composition was synthesized in 1988 by Fomicheva et al.,1 and its structure in solution was studied by NMR spectroscopy. Nonetheless, no structural elucidation in solid state was conducted. The interest in the solid and solution phases of this complex arise from its easy vacuum sublimation (the necessary condition for the volatility of UO2(TFA)2 is the presence of a strong neutral ligand, such as DMSO) and its applications in the sensing and monitoring of UO2
2+ in nuclear processes related to nuclear energy production.
A great deal of work has been dedicated to the development of sensors for actinide ions such as [UVIO
2]
2+2-4, which have been detected in groundwater around nuclear fuel-processing facilities after underground tests. It should also be noted that monitoring radioactive analytes is now possible using iber optics, since the [UVIO
2]
2+ ion shows an intrinsic luorescence with maxima at 518 and 546 nm, which are compatible with both plastic and glass ibers5,6.
Moreover, the PUREX (Plutonium Uranium Redox Extraction) process7,8, the de facto standard aqueous nuclear reprocessing method for the recovery of uranium and plutonium from used nuclear fuel, requires continuous monitoring of [UVIO
2]
2+ ion. This was traditionally achieved by exciting the luorescence of [UVIO
2]
2+ ion in nitric acid medium at 337 nm using a nitrogen laser, since its intensity is strongest in
acidic solution at pH 1.6 9. Nowadays, phosphoric acid is additionally added because it complexes the ion, enhances its luorescence, and thereby lowers the detection limit. Details on the monitoring of uranium in this process can be obtained from Smith et al.,9 and from Ramanujam10.
In this paper we propose the alternative use of triluoroacetic acid and DMSO to further optimize this application. In triluoroacetate acid, the emission is particularly intense, being >150 times stronger than in water, probably by virtue of the combined effect of lowering the pH and dehydration by formation of the DMSO complex1.
In the work presented herein, evidence of the effective complexation has been gained by X-ray diffraction through structural elucidation of single-crystals of [UO2(TFA)2(DMSO)3] (TFA=deprotonated triluoroacetic acid; DMSO=dimethyl sulfoxide) isolated from solution (prepared according to a new synthesis method). Further, we present a detailed characterization of the solid form by X-ray powder diffraction, elemental analysis, FT-IR spectroscopy, thermal analysis and absorption and emission spectroscopies.
2. Experimental
2.1. Materials, synthesis and analytical data
[UO2(TFA)2(DMSO)3] (TFA=deprotonated triluoroacetic acid, CF3COOH; DMSO=dimethyl sulfoxide, (CH3)2SO) was prepared by reacting uranyl acetate hydrate (CAS No.Luminescent Properties of [UO
2(TFA)
2(DMSO)
3], a Promising Material
for Sensing and Monitoring the Uranyl Ion
Pablo Martín-Ramosa,b*, Ana L. Costac, Manuela Ramos Silvab, Laura C. J. Pereirad,
Pedro S. Pereira da Silvab, J. Sergio Seixas de Meloc, Jesús Martín-Gile
aEscuela Politécnica Superior de Huesca – EPSH, Universidad de Zaragoza – UNIZAR,
Carretera de Cuarte s/n, 22071, Huesca, Spain.
bCentro de Física da Universidade de Coimbra – CFisUC – CisUC, Department of Physics,
Universidade de Coimbra – UC, Rua Larga, P-3004-516, Coimbra, Portugal.
cCentro de Química de Coimbra – CQC, Department of Chemistry, Universidade de Coimbra – UC,
Rua Larga, P-3004-535, Coimbra, Portugal.
dCentro de Ciências e Tecnologias Nucleares – C2TN, Instituto Superior Técnico – IST,
Universidade de Lisboa – ULISBOA, 2695-066, Bobadela LRS, Portugal.
eAdvanced Materials Laboratory, Escuela Técnica Superior de Ingenierías Agrarias – ETSIIAA,
University of Valladolid – UVa, Avenida de Madrid 44, 34004, Palencia, Spain
Received: August 7, 2015; Revised: November 27, 2015; Accepted: December 18, 2015
An uranyl complex [UO2(TFA)2(DMSO)3] (TFA=deprotonated triluoroacetic acid; DMSO=dimethyl sulfoxide) has been successfully synthesized by reacting UO2(CH3COO)2·H2O with one equivalent of (CF3CO)2O and DMSO. The complex has been characterized by single-crystal X-ray diffraction, X-ray powder diffraction, elemental analysis, FT-IR spectroscopy, thermal analysis and absorption and emission spectroscopies. The spectroscopic properties of the material make it suitable for its application in the sensing and monitoring of uranyl in the PUREX process.
6159-44-0, ≥98.0%, Sigma-Aldrich), UO2(CH3COO)2·H2O, with one equivalent of triluoroacetic anhydride (CAS No. 407-25-0, ≥99%, Sigma-Aldrich), (CF3CO)2O, according the following reaction:
(
)
(
)
(
)
2 3 2 2 3 2
2 3 2 3
UO CH COO ·H O CF CO O
UO CF COO 2CH COOH
+ →
+
and adding an excess of DMSO (CAS No. 67-68-5, ≥99.5%, Sigma-Aldrich).
An alternative method using commercial uranyl nitrate hexahydrate (CAS No. 13520-83-7, ≥98.0%, Sigma-Aldrich) as precursor required seven equivalents of (CF3CO)2O (six for dehydration). Gaseous N2O5 evolved as nitrate reduction product.
(
)
(
)
(
)
2 32 2 3 2
2 3 2 2 5 3
UO NO ·6H O 7 CF CO O
UO CF COO N O 12CF COOH
+
→ + ↑ +
Both reactions were conducted in DMSO at room temperature (RT) under stirring. The solutions were stored in a refrigerator at 4 ºC for 24 hours. [UO2(CF3COO)2(DMSO)3] bright yellow crystals with well-formed crystal faces were formed by slow evaporation. The reaction yield was determined to be higher than 90% in both synthesis procedures.
[UO2(CF3COO)2(DMSO)3]: Chemical formula: C10H18F6O9S3U, MW: 730.46. Anal. Calcd. for C10H18F6O9S3U: C, 16.44; H, 2.48; F, 15.61; O, 19.71; S, 13.17; U, 32.59%. Found: C, 16.24; H, 2.36%.
2.2. X-ray crystallographic analysis
Prior to structural characterization, a powder diffractogram of the sample was obtained using a Bruker D8 Advance Bragg-Brentano diffractometer, in relection geometry.
For the determination of the crystal structure by X-ray diffraction, several crystals of aforementioned compound were glued to glass ibres and mounted on a Bruker APEX II diffractometer. Several data collections were conducted at room temperature 293(2) K using graphite monochromated MoKα (λ=0.71073 Å). Empirical absorption corrections were made using SADABS, a program designed to exploit data redundancy to correct 3D-integrated (thin slice) data from Bruker area detectors11. None of the data collections yielded good Rint factors. The structure was solved by direct methods using SHELXS-9712 and reined anisotropically (non-H atoms) by full-matrix least-squares on F2 using the SHELXL-97 program12. The reinement was performed using several DFIX and ISOR constraints. The low quality data and the difference between the scattering power of the atoms involved resulted in unconverging reinements with several signs of disorder in the coordinating ligands. PLATON13 was used to analyse the structure and for igure plotting. Atomic coordinates, thermal parameters and bond lengths and angles are provided in the Supporting Information.
2.3. Physical measurements
The C, H, N elemental analyses were conducted using a Perkin Elmer CHN 2400 apparatus.
The infrared spectrum was recorded with a Thermo Nicolet 380 FT-IR apparatus equipped with Smart Orbit Diamond ATR system.
Thermal analysis was done with a Perkin-Elmer STA6000, DTA/DTG equipment, by heating the samples in a slow stream of N2 (20 mL/min) from room temperature up to 800 ºC, with a heating rate of 20 ºC/min.
Optical absorption and photoluminescence spectra were measured at room temperature. The 200-800 nm range diffuse relectance absorption spectrum in powder form and the absorption spectra in DMSO at different concentrations (10-5 M and 10-3 M) were recorded on a Cary 5000 UV-Vis-NIR spectrophotometer. The solid-state photoluminescence spectrum in the visible region was recorded from 450 to 650 nm with a Horiba-Jobin-Ivon SPEX FluoroLog 3–22 spectrometer using an ozone-free 450 W Xenon lamp as the excitation source and a Hamamatsu R928 photomultiplier (200-950 nm range) detector, cooled with a Products for Research thermoelectric refrigerated chamber (model PC177CE005).
3. Results and discussion
3.1. Structural description
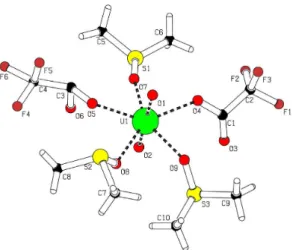
The single crystal X-ray diffraction study conirmed a distorted pentagonal-bipyramidal geometry around the U atoms where the uranyl oxygen atoms occupy the axial positions. Five O atoms from three dimethyl sulfoxide molecules and two triluoroacetate ions deine the pentagonal plane (Fig. 1, Table 1).
3.2. X-ray powder diffraction
Fig. 2 shows the experimental diffraction pattern and the simulated powder diffraction pattern from the single crystal structure using PLATON13. There is a good match between simulated and experimental diffractograms: the peaks appear at the predicted theta angles. Differences in intensity can be ascribed to the Bragg-Brentano geometry of the instrument used.
3.3. Thermal behavior
Thermal kinetics of [UO2(TFA)2(DMSO)3] uranyl triluoroacetate complex from room temperature to 800 ºC involved a melting point around 100 ºC (endotherm at 103 ºC) and a decomposition in two stages at 105-300 ºC
and at 300-345 ºC sensitized by two exotherms at 245.8 ºC and 339.7 ºC, respectively (Fig. 3). The weight loss for these stages corresponded to partial and inal removal of DMSO and triluoroacetate ligands. This overall weight loss (ca. 62%), corresponds to the formation of U3O8. The inal exotherm at ca. 550 ºC can be attributed to decomposition of U3O8 to UO2, the expected inal decomposition product in inert atmosphere, leading to an overall weight loss of 63%.
Since the exothermic effect at 340 ºC can be attributed to vaporization and this temperature is lower than that reported for uranyl triluoroacetate in absence of DMSO1, the complex with DSMO can be deemed as more suitable for vacuum sublimation.
3.4. Vibrational spectra
The main infrared bands are summarized in Table 2. Those at 935 and 907 cm-1 are attributed to the ν
3(UO2 2+) stretching vibrations (Fig. 4). This doubling of the UO22+ asymmetric stretching vibrations is also relected in the UO2
2+ symmetric stretching region, where two bands are observed at 833 and 792 cm-1. The band below 540 cm-1 may be attributed to the ν(U-Oequatorial) unit vibrations. It should be noted that characteristic vibrations of uranyl ions and triluoroacetate groups overlap, so they cannot be clearly separated without structure-based calculations.
The absorption peaks at 1683 cm-1 and 1418 cm-1 establish the presence of COO- asymmetric and symmetric stretching, respectively. ∆ν = ν(COO-)as – ν(COO-)s = 265 cm
-1 is a high value, in agreement with unidentate coordination. The peak at 1180 cm-1 is assigned to CF stretching vibrations of the CF
3 group. The band at 907 cm-1 represents the C-C stretching. The next band at 833 cm-1 is due to COO- rocking, while CH2 rocking is seen in the next absorption band at 792 cm -1. The characteristic band for COO- scissoring is observed at 716 cm-1.
Dimethyl sulfoxide is structurally similar to acetone, with a sulfur replacing the carbonyl carbon. The normal absorption of the S=O bond occurs at 1050 cm-1 but under coordination it appears at 1030 cm-1. Symmetric bending vibration of CH3 groups gives rise to a major band at around 1420 cm-1.
3.5. Optical properties
The UV-Vis absorption spectrum in 10-5 M DMSO solution (Fig. 5) shows a main absorption peak at 260 nm, associated to the π-π* absorption from the TFA ligand
Fig. 2. Experimental (solid line) vs. calculated (dashed line) X-ray
powder diffraction patterns for [UO2(TFA)2(DMSO)3] complex. Table 1. Crystal data and structure reinement for [UO2(TFA)2(DMSO)3]
complex.
Complex [UO2(TFA)2(DMSO)3]
Empirical formula C10H18F6O9S3U
Formula weight 730.45 Temperature (K) 293(3)
Wavelength (Å) 0.71073
Crystal system Orthorhombic
Space group Pbca
a (Å) 14.8559(13)
b (Å) 13.6663(11)
c (Å) 21.8881(18)
α (º) 90.00
β (º) 90.00
γ (º) 90.00
Volume (Å3) 4443.8(6)
Z 8
Calculated density (g cm-3)
2.184
Absorption coeficient
(mm-1)
7.673
F(000) 2752
θ range for data
collection
2.23-25.94
Index ranges (º) -18<h<18; -16<k<16; -26<l<26
Relections collected 87413
Independent relections 4299
Completeness to 2θ=51º 0.990
Reinement method Full matrix LS on F2
Data/restrains/ parameters
4299/63/263
Goodness-of-it on F2 1.023
Final R indices [I>2σ(I)] R=0.0891; wR=0.2475 R indices (all data) R=0.1985; wR=0.3397
Largest diff. peak and
hole
-2.854/2.237
(similar to those observed for sodium triluoroacetate or ammonium triluoroacetate), plus several [UVIO2]2+ weaker bands that can distinguished in greater detail by increasing the concentration of the DMSO solution to 10-3 M or by UV-Vis diffuse relectance measurements in powder form (see insets in Fig. 5). These bands start at 495 nm and continue well into the UV range, arising from partially forbidden charge transfer transitions from oxo-based molecular orbitals to non-bonding, unoccupied f-orbitals. Several peaks at 403, 414, 426, 438, 476 and 493 nm can be readily discerned, although the overlap with the strong TFA absorption band precludes the deconvolution into the actual fourteen discrete absorption bands.
With regard to the emission spectra, both the ligand-mediated excitation at 305 nm (chosen so as to avoid that the second harmonic of the laser would fall within the range of the uranyl luorescence spectrum) and the direct excitation at 420 nm resulted in the characteristic uranyl emission centered at 525 nm (Fig. 6). Strong coupling of the electronic energy
levels with the symmetric O=U=O stretching mode leads to a vibronically resolved spectrum with several distinct emission bands between 450 and 650 nm. The shape of the system is species dependent and highly coupled to the chemical environment, thus allowing this technique (laser induced luorescence spectroscopy) to probe the local environment and speciation.
The lifetime measurements (not shown) are in agreement with those previously reported by Fomicheva et al.,1 with τ>200 µs at RT (although lowering the temperature is known to cause an exponential increase of the quantum yield).
Table 2. Main absorption bands in the ATR-FTIR spectrum of
[UO2(TFA)2(DMSO)3]
Wavenumber (cm-1)
Main assignation Alternative
assignation
3017 CH3 asymmetric stretching vibration 2930 CH3 symmetric
stretching vibration 2358 Overtone of 1179 cm-1
1683 COO- asymmetric
stretching
1587 Overtone of 792 cm-1
1418 COO- symmetric
stretching
CH3 symmetric
bending vibration 1179 CF stretching vibrations
1029 S=O stretching 985 C-S
935 v3 O=U=O asymmetric
stretching vibration COO
- waging
907 v3 O=U=O asymmetric
stretching vibration C-C stretching
833 ν1 O=U=O symmetric
stretching vibration COO- rocking
792 ν1 O=U=O symmetric
stretching vibration
C-C stretching // C-S stretching 603 TFA
459 U-O vibrations
432 U-O vibrations
Fig. 6. Emission spectra of [UO2(TFA)2(DMSO)3] upon excitation
at 305 nm (black) and at 420 nm (red).
Fig. 4. ATR-FTIR spectrum of [UO2(TFA)2(DMSO)3].
Fig. 5. Absorption spectrum of [UO2(TFA)2(DMSO)3] in a 10-5 M
DMSO solution. Left inset: detail of the absorption spectrum in a 10-3 M DMSO solution. Right inset: detail of the diffuse relectance
This long lifetime is a result of the advantageous choice of triluoroacetic acid, which ensures an acidic medium (avoiding chloride, bromide and iodide ions, associated to quenching), and the use of triluoroacetic anhydride in the synthesis procedure, which precludes any water-associated quenching.
4. Conclusions
[UO2(TFA)2(DMSO)3] (TFA=deprotonated triluoroacetic acid; DMSO=dimethyl sulfoxide), a promising material for [UVIO
2]
2+ sensing and monitoring, has been prepared according to a new synthesis method and the structure of the complex has been elucidated by single-crystal X-ray diffraction. Thermal analyses, by TG and DSC, suggest its suitability to vacuum sublimation. The inherent photophysical properties of the uranyl cation have been assayed by absorption and emission spectroscopies, conirming an intense green emission
resulting from the combined effect of lowering the pH and dehydration by formation of the DMSO complex, previously reported by other groups. This can provide a convenient means of monitoring uranyl concentration, speciation, and movement without the need for additional imaging agents (such as dye probes).
5. Acknowledgements
Access to TAIL-UC facility funded under QREN-Mais Centro project ICT-2009-02-012-1980 is gratefully acknowledged. P.M.-R. would like to gratefully acknowledge the inancial support of Santander Universidades through “Becas Iberoamérica Jóvenes Profesores e Investigadores. España 2015” scholarship program. C2TN/IST authors gratefully acknowledge the FCT support through the UID/Multi/04349/2013 project.
6. References
1. Fomicheva EA, Sidorenko GV, Shcherbakova LL. Volatile
adducts of uranyl trifluoroacetate. Soviet Radiochemistry
(English Translation). 1988;29(6):664-670.
2. Verga Scheggi AM, McFarlane R, Hamilton MC. A fluorescence based dissolved oxygen sensor. In: SPIE 0798. Fiber Optic Sensors II. Proceedings. The Hague, Netherlands: SPIE; 1987. p. 324-330.
3. Malstrom RA, Hirschfeld T. On-Line uranium determination
using remote fiber fluorimetry. In: 26th Conference on Analytical Chemistry in Energy Technology. Analytical Spectroscopy, Analytical Chemistry. Proceedings. Knoxville, TN: Elsevier; 1984. p. 25-30. (Symposia Series).
4. Boisdé G, Blanc E, Mauchien P, Perez JJ. Fiber optic chemical
sensors in nuclear power plants. In: Wolfbeis OS, editor. Fiber optic chemical sensors and biosensors. Boca Raton: CRC Press; 1991. p. 135-149.
5. Sporea D, Sporea A, Okeeffe S, McCarthy D, Lewis E. Optical
fibers and optical fiber sensors used in radiation monitoring. In: Yasin M, Harun SW, Arof H, editors. Selected Topics on Optical Fiber Technology. Rijeka, Croatia: InTech; 2012. p. 668.
6. Trettnak W, Hofer M, Wolfbeis OS. Applications of optochemical sensors for measuring environmental and biochemical
quantities. In: Gopel W, Hesse J, Zemel JN, editors. Sensors set: a comprehensive survey. Weinheim, Germany: Wiley-VCH Verlag; 1995. p. 931-967.
7. Anderson HH, Asprey LB. Solvent extraction process for plutonium. US patent 2924506 A; 1960.
8. Burns JH. Solvent-extraction complexes of the uranyl ion. 2. Crystal and molecular structures of catena-bis(m-di-n-butyl phosphato-O,O’)dioxouranium(VI) and bis(m-di-n-butyl phosphato-O,O’)bis[(nitrato)(tri-n-butylphosphine oxide) dioxouranium(VI)]. Inorganic Chemistry. 1983;22(8):1174-1178. DOI: 10.1021/ic00150a006
9. Smith NA, Cerefice GS, Czerwinski KR. Fluorescence and absorbance spectroscopy of the uranyl ion in nitric acid for process monitoring applications. Journal of Radioanalytical and Nuclear Chemistry. 2012; 295(2):1553-1560.
10. Ramanujam A. An introduction to the PUREX process. IANCAS. 1998; 14(2):11-20.
11. Sheldrick G. SADABS. Göttingen, Germany: University of Göttingen; 1996.
12. Sheldrick GM. A short history of SHELX. Acta Crystallographica. Section A. 2007;64(1):112-122. doi:10.1107/S0108767307043930
![Fig. 2. Experimental (solid line) vs. calculated (dashed line) X-ray powder diffraction patterns for [UO 2 (TFA) 2 (DMSO) 3 ] complex.](https://thumb-eu.123doks.com/thumbv2/123dok_br/18883045.423134/3.765.51.363.129.736/experimental-solid-calculated-dashed-powder-diffraction-patterns-complex.webp)
![Fig. 5. Absorption spectrum of [UO 2 (TFA) 2 (DMSO) 3 ] in a 10 -5 M DMSO solution](https://thumb-eu.123doks.com/thumbv2/123dok_br/18883045.423134/4.765.402.714.458.877/fig-absorption-spectrum-uo-tfa-dmso-dmso-solution.webp)
