INTRODUCTION
The textile industry in Brazil has a high socio-economic value, as it generates millions of direct jobs in manufacturing, as well as indirect jobs in the production of raw materials and inputs. According to data from the Brazilian Textile Industries Association in 2016, Brazil was the 5th largest producer of textiles in the world. The large volume of effluents this industrial activity produces generates serious environmental problems. In the textile industry, the processing of raw material to the creation of the final product generally goes through the following stages: washing, softening, dyeing, and bleaching [1-4]. The most troubling of these stages, with regard to the environment, is the dyeing stage, as it requires the use of a great variety of chemicals, including the dyes themselves. At the end of the dyeing process, studies indicate that the concentration of dyes in the wastewater can range from 10 to 200 mg/L,
equivalent to about 10 to 15% of the dye used at the beginning of the process [5]. When discharged into watercourses, these dyes can cause environmental problems, especially when disposed of incorrectly without proper treatment [6, 7]. The disposal of these effluents in aquatic environments is a serious source of pollution because it can give rise to hazardous by-products through oxidation, hydrolysis, or other chemical reactions that occur in the aqueous phase [8]. It should also be noted that dyes reduce the penetration of light into the water and have toxic or carcinogenic effects on living beings present in the habitat [9, 10].
The concern about the quality of the environment affected by textile effluent has led to the search for treatment alternatives. Today, systems that employ adsorption as an efficient alternative to control pollution have become well-known [11-14]. Several adsorbents have been developed for the removal of contaminants, as alternatives to the use of clays [15-17]. Clays, especially bentonites, exhibit wide applicability as adsorbents because of their high surface area, high cation exchange capacity, high availability, low
Study of equilibrium and kinetic adsorption of rhodamine B
onto purified bentonite clays
(Estudo do equilíbrio
e da cinética de adsorção da rodamina B
em bentonitas purificadas)
J. F. Duarte Neto1*, I. D. S. Pereira1, V. C. da Silva1, H. C. Ferreira1, G. de A. Neves1, R. R. Menezes1 1Federal University of Campina Grande, Academic Unit of Materials Engineering, 58429-900, Paraíba, Brazil
_______________________ *[email protected]
Abstract
Currently, the removal of contaminants such as wastewater dye has become an essential task. In view of this, improving the performance of the adsorbents in order to improve the adsorption technique and reduce the total cost of the adsorption process
is of great interest to the industrial sector. This study investigated the adsorption process of natural and purified bentonite clay
adsorbents, using rhodamine B in an aqueous media. Rhodamine B is very toxic to aquatic organisms and may cause long-term
adverse effects in the aquatic environment. These clays were used both in the natural form and after purification by centrifuge. All
adsorbents were characterized. The kinetics and equilibrium isotherms were studied. In equilibrium, the Freundlich isotherm model
was the best fit to the experimental data. In kinetics study, the data were best fit by the pseudo-second order model. The purified clays efficiently removed the rhodamine B.
Keywords: adsorption, bentonite, purification, rhodamine B.
Resumo
Atualmente a remoção de contaminantes, como o corante de águas residuais, tornou-se uma tarefa essencial. Em vista disso, melhorar o desempenho dos adsorventes para melhorar a técnica de adsorção e reduzir o custo total do processo de adsorção é de grande interesse para o setor industrial. Este trabalho investigou o processo de adsorção de bentonitas naturais e purificadas, usando rodamina B em meio aquoso. A rodamina B é muito tóxica para os organismos aquáticos e pode causar efeitos nocivos a longo prazo no ambiente aquático. Estas argilas foram utilizadas na forma natural e após tratamento de purificação por centrifugação. Todos os adsorventes foram caracterizados. A cinética e o equilíbrio de adsorção foram estudados. No equilíbrio, o modelo de isoterma de Freundlich foi o que melhor se ajustou aos dados experimentais. No estudo cinético, os dados se ajustaram melhor ao modelo pseudossegunda ordem. As argilas purificadas removeram eficientemente o corante rodamina B.
cost, and chemical inertia [18]. However, bentonite clays in their natural form are generally not effective in certain technological processes, and procedures are required to treat these clays before use. Purification is usually performed to eliminate non-clay fractions, which are usually insoluble salts and minerals and non-dispersed clay particles, in order to concentrate the clay fraction, favoring the adsorptive behavior of the bentonite clays [19].
Rhodamine B (RB) dye is highly water-soluble synthetic chemical. It belongs to the xanthene class and is applicable in agate dyeing, in the animal feed industry, in textile industries, as a fluorescent tracer in water, and in the production of jet and laser printer cartridges. However, rhodamine B has some undesirable characteristics as it causes irritation of the skin, eyes and respiratory tract, and is implicated in causing carcinogenicity, reproductive and developmental neurotoxicity and chronic toxicity to humans and animals. It is important that this dye does not harm natural water resources. Removal of the dye by adsorption from aqueous solutions on the purification-treated clay minerals (bentonite) has not received much attention earlier [20-24]. Although there are many works with the use of bentonite as adsorbent material, there is still little information on those that use the centrifugal purification process in the clay in an attempt to optimize the adsorption capacity of this clay. In this sense, the objective of this study was to focus on the adsorption of RB dye and to investigate the effect of certain parameters, such as contact time, initial dye solution, and pH of solutions, on the adsorption capacity of this dye by natural and purified bentonite clays.
MATERIALS AND METHODS
Materials: bentonite clays from the cities of Cubati, Olivedos and Sosssego from the State of Paraíba, Brazil, were used as adsorbents and identified as follow: BR (Olivedos), RF (Sossego) and VI (Cubati). The clays in the natural state were dried at 60 °C, crushed, ball milled, and finally sieved with an ABNT n° 200 sieve (0.074 μm).
Modification of clay: centrifugation was used to purify the clays. To prepare the suspensions to be centrifuged, 25 g of natural clay was mixed with 500 mL of deionized water and 25 mL of ammonium hydroxide. Then, the suspensions were stirred at a rate of 17000 rpm for 20 min. The suspensions were left to stand for 7 days and then stirred again at a rate of 17000 rpm for 20 min. After this process, the suspensions were centrifuged at a rate of 1900 rpm for 5 min. The floating portion of the suspensions was collected and dried for further characterization. The clays treated by centrifugation were identified as follow: BRPuri, RFPuri, and VIPuri.
Characterization of adsorbents: the natural and purified bentonite clays were characterized using low-angle laser scattering (Cilas, 1064), X-ray fluorescence semiquantitative compositional analysis (Shimadzu, EDX720), X-ray diffraction (Shimadzu, XRD6000, using Kα of copper at 40 kV/30 mA, 0.02° step and 0.6 s/step), and thermal analysis (Shimadzu, TA60H, using a heating rate of 12.5 °C/min and
a maximum temperature of 1000 °C).
Preparation of the adsorbate solution: rhodamine B, C28H31N2O3Cl (Vetec, MW 479.02 g/mol), was used as the adsorbate. Dye stock solution was produced at a concentration of 1000 mg/L and later was diluted in distilled water to obtain solutions with lower concentrations. Adsorption experiments: the adsorption tests were carried out in batches. Clay and dye were added to 200 mL of distilled water and the mixture was then subjected to magnetic stirring (300 rpm) at room temperature (25 °C). To verify the adsorption efficiency of the clays, the effects produced by several different parameters were studied: contact time from 15 to 300 min; adsorbate concentration from 2.5 to 100 mg/L; and pH from 3 to 11.
Adsorption isotherms: the principal equations used to construct the adsorption isotherms were based on two aspects: equilibrium and kinetics. The mathematical derivations can be adapted to an extensive experimental range of adsorption systems. For this study, the following isotherm models were used: Langmuir [25, 26], Freundlich [23, 27, 28], Temkin [29, 30], and Dubinin-Radushkevich [31]. The Langmuir isotherm model was one of the pioneers in the study of mathematically fitting adsorption information. This isotherm can be obtained using a simple approach that considers the following points: at equilibrium, adsorption and desorption rates are the same; all adsorption sites on the surface of the adsorbate have the same adsorption energy; and adsorbed molecules do not move on the surface and also do not interact with adjacent molecules. In other words, they form monolayers that are adsorbed on the surface [25, 26, 32]. The equation was deduced using these concepts, and its most classical form is:
Ce Qe
Ce Qmax
= 1 +
Qmax.KL (A)
where Qe (mg.g-1) represents the adsorbed amount, Q max (mg.g-1) is the maximum amount adsorbed, K
L (L.mg -1) is the affinity constant, and Ce (mg.L-1) is the equilibrium concentration in solution. The values of Ce were determined experimentally, while the values of Qe were found using the following equation:
Q =(Co-Ce)V
m (B)
log(Qe) = log(KF) + log(C1 e)
n (C)
where KF [(mg1-1/n.L1/n)/kg] is the Freundlich constant, representing the adsorption capacity of the solid, n is a parameter of the Freundlich equation related to the adsorption intensity. K and n are constants that depend on several experimental factors and are related to the distribution of the active sites and the adsorption capacity of the adsorbent. The values of n and K can be obtained from the linear fit of the graph log(Qe) versus log(Ce). The applicability of this isotherm is restricted to a limited concentration range [27, 28, 33]. The Temkinleva isotherm model takes into account the adsorbate-adsorbate interactions and ignores very high and very low concentration values. These caveats reveal that, for this model, the heat of adsorption of all molecules decreases linearly as the adsorbate covers the adsorbent. Thus, the Temkin isotherm admits that the adsorption energy of all molecules involves a uniform distribution of the maximum binding energy and further tells us that the decrease in adsorption heat is linear rather than logarithmic. The linear equation of the Temkin isotherm is presented as:
Qe = BT ln(KT) + BTln (Ce) (D)
RT bT
BT= (E)
where bT is the Temkin constant, KT (L.g-1) is the equilibrium bond constant, R (kJ.mol-1.K-1) is the universal gas constant and T (K) is the temperature [29, 30, 34]. The Dubinin-Radushkevich (D-R) isotherm model is more comprehensive than the Langmuir isotherm model. However, it does not consider the surface of the adsorbent to be homogeneous. The D-R isotherm aims to understand the type of adsorption and the equilibrium data of the adsorption process, distinguishing the adsorption processes into chemical and physical. Its linearized form is expressed by:
lnQe = lnQmax - KDR.e2 (F)
where KDR is the constant related to the adsorption energy and ε is the Polanyi potential, which is determined from:
e = R.T. ln[1+1/Ce] (G)
Another determining factor of this isotherm model is the value of E (kJ.mol-1), which indicates the average free adsorption energy, calculated by:
E = (2KDR)-1/2 (H)
The value of E indicates the free energy to transfer one mole of ions to the surface of the adsorbent. This value is also important in determining the type of adsorption. Values of E lower than 8 kJ.mol-1 indicate that the adsorption is of a physical nature, whereas E values between 8 and 16 kJ.mol-1
indicate that the adsorption is chemical [35-37].
Adsorption kinetics: adsorption kinetics describes the rate of removal of the solute from the solvent medium. This is dependent on the physical and chemical characteristics of the adsorbate, adsorbent, and experimental system. Knowledge of adsorption kinetics serves to examine the mechanisms that control the adsorption process, such as mass transfer between phases and chemical reactions. It also allows the determination of the amount of solute withdrawn from a solution with respect to time, which is of great importance in virtually all applications involving adsorption [31, 38, 39]. The calculation of the kinetic parameters is of great practical and technological value with regard to experiment time, beyond just the importance of knowing the adsorption coefficients to evaluate the capacity/efficiency of an adsorbent. Among the various kinetic models, three were considered: pseudo-first order, pseudo-second order, and intraparticle diffusion. The pseudo-first order equation, also defined as the Lagergren equation, is one of the most commonly used to evaluate the adsorption processes of the solute of a liquid solution, based on the adsorption capacity of the solid. The equation in its linear form is:
log(Qe-Qt) = log(Qe)- K1 t
2,303 (I)
where Qe (mg.g-1) is the adsorption capacity at equilibrium, Qt (mg.g-1) is the adsorption capacity at a given time, K
1 (min -1) is the pseudo-first adsorption rate constant, and t (min) is the adsorption time [11, 40, 41]. The pseudo-second order kinetic model, like the first order kinetic model, is based on the adsorption capacity of the solid phase and differs from the Lagergren equation by calculating the behavior of the process over the entire length of the contact time, whether short or long. It is usually expressed in its linear form as:
t Qt
1 Qe
= +
(J)
the initial diffusion of the liquid surrounding the adsorbent is negligible and that internal diffusion is what controls the steps of the adsorption process. Its linear equation is described by:
Qe = KIt1/2 +C
L (K)
in which KI (g.mg-1.min-1/2) is the intraparticle diffusion constant and CL (mg.g-1) is the thickness of the boundary layer effect. If intraparticle diffusion is involved in adsorption, then a graph Qe as a function of t1/2 results in a linear relationship that allows the KI value to be calculated from the slope of the line [40, 45-47].
RESULTS AND DISCUSSION
Composition of natural and purified clays
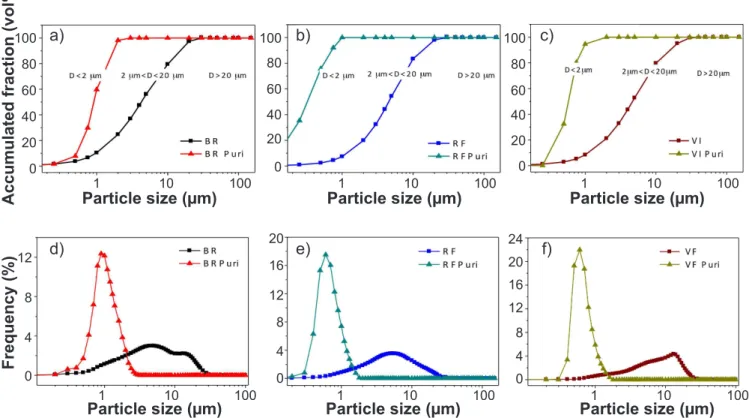
The values of the granulometric compositions of the natural and centrifuged clays are shown in Table I. The natural clay with the highest accumulated volume having a diameter of less than 2 μm was the BR clay (24.71%), corresponding to an average particle diameter of 6.10 μm. For particles with diameter between 2 and 20 μm, the clays with the highest percentages were RF (78.18%) and VI (73.75%). The clay with the highest percentage having diameter greater than 20 μm was VI clay (4.98%). These results were similar to those described in [48-50]. With regard to the centrifugation treatment process, it was verified that the clay (D<2 μm) fraction increased in comparison to that of the natural clays
by 297% (BR), 402% (RF), and 370% (VI). The average particle diameter of the purified clays decreased by an average of 6.14 to 0.72 μm, when compared to the natural clays. Fig. 1 presents the granulometric distribution curves (histograms and cumulative values) of all samples analyzed. It was found that the clays presented curves with monomodal particle size distribution behavior, ranging from 0.1 to 12 μm. In relation to the accumulated curves, the following D50 values were found: 4.55 μm for RF, 4.27 μm for BR, 4.68 μm for VI, 0.58 μm for RFPuri, 0.9 μm for BRPuri, and 0.57 μm for VIPuri. In general, it was noted that treatment of clays by centrifugation led to a reduction in the mean equivalent particle size, and an increase in the volume of the clay fraction, proving the efficacy of the process, as observed in [51].
Sample D<2 mm 2<D<20
mm D>20 mm
Average diameter
BR 24.71% 72.65% 2.64% 6.10 μm
BRPuri 98.14% 1.86% 0.0 0.98 μm
RF 19.91% 78.18% 1.92% 5.91 μm
RFPuri 100.0% 0.0 0.0 0.62 μm
VI 21.27% 73.75% 4.98% 6.59 μm
VIPuri 100.0% 0.0 0.0 0.62 μm
Table I - Granulometric compositions of the natural and centrifuged clay samples.
[Tabela I - Composições granulométricas das argilas naturais e após centrifugação.]
100 100 100
60 60 60
20 20 20
80 80 80
40 40 40
0
12
20 24
20
12
12
4 4
16
16
8
8
0 0
8
4
0
1
1
1
1
1
1 Particle size (µm)
Frequency (%)
Accumulated fraction (vol%)
Particle size (µm)
Particle size (µm)
Particle size (µm)
Particle size (µm)
Particle size (µm) 10
10
10
10
10
10 100
100
100
100
100
100
0 0
a)
d)
b)
e)
c)
f)
Figure 1: Granulometric distribution curves of natural and purified clays in accumulated (a-c) and frequency (d-f) plots.
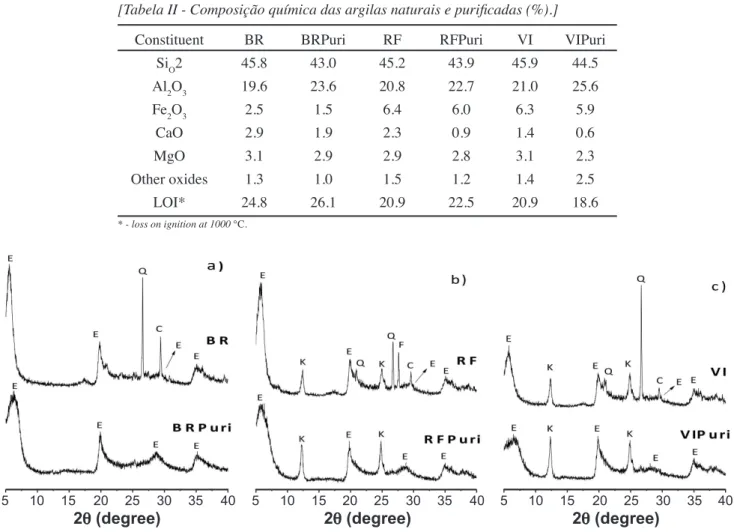
The constituent components of the samples, both natural and purified, were determined by X-ray fluorescence (XRF) spectroscopy (Table II). SiO2 and Al2O3 were the major constituents of both natural and purified clays, with the total corresponding to more than 60% of the chemical composition of both samples. Bentonites were polycationic with the presence of calcium and magnesium. Loss on ignition was related to moisture, coordinated and adsorbed water losses, burning of organic matter, decomposition of carbonates, and the structural destruction of clay minerals. The presence of iron oxide may be associated with the isomorphic substitution of Al3+ by Fe3+ ions at octahedral sites, as well as hydroxides. It was also observed that there was a reduction in the concentration of the accessory minerals after treatment of the clays by centrifugation when compared to the natural samples, with the maximum reductions being: 6.5% of SiO2 in BR, probably corresponding to free silica; 156% of CaO in RF, probably corresponding to magnesium carbonate or mica; 67% of Fe2O3 in BR, probably corresponding to goethite and hematite. The values obtained for the chemical composition were similar to those observed in [52], proving the efficiency of purification through centrifugation. In
general, it can be observed from Table I that the clay treatment procedures were effective since the centrifuge process was efficient in removing fractions of accessory minerals and increasing the clay fraction.
Fig. 2 shows the X-ray diffraction (XRD) results of the clays studied. The curves showed characteristic peaks of smectite (JCPDS 13-0135), quartz (JCPDS 46-1045), kaolinite (JCPDS 78-2110), feldspar (JCPDS 84-0710), and calcium carbonate (JCPDS 89-1305). In general, XRD patterns of the natural clays qualitatively confirmed that the samples were typical of the bentonite clays of the State of Paraíba, predominantly composed of clay minerals from the smectite group [53-56]. When analyzing the XRD curves of the natural and purified clays, it can be seen that the intensity of the characteristic peaks of smectite clay increased for all the samples. There was also a significant reduction in the intensity of the characteristic peaks for calcium carbonate, feldspar and quartz, indicating that the concentrations of the accessory mineral fractions present in the samples decreased after the purification process [57-59].
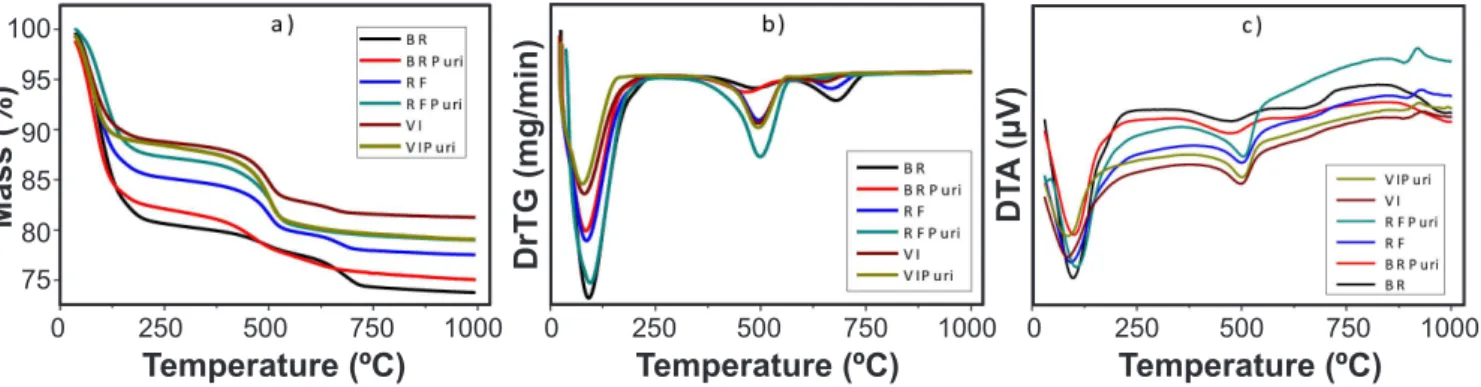
Fig. 3 shows the thermal analysis curves: thermogravimetric analysis (TG), its derivative (DTG),
Constituent BR BRPuri RF RFPuri VI VIPuri
SiO2 45.8 43.0 45.2 43.9 45.9 44.5
Al2O3 19.6 23.6 20.8 22.7 21.0 25.6
Fe2O3 2.5 1.5 6.4 6.0 6.3 5.9
CaO 2.9 1.9 2.3 0.9 1.4 0.6
MgO 3.1 2.9 2.9 2.8 3.1 2.3
Other oxides 1.3 1.0 1.5 1.2 1.4 2.5
LOI* 24.8 26.1 20.9 22.5 20.9 18.6
Table II - Chemical analysis of the natural and purified clays (wt%). [Tabela II - Composição química das argilas naturais e purificadas (%).]
* - loss on ignition at 1000 °C.
Figure 2: XRD patterns of the natural and purified bentonite clays (C-calcium carbonate; E-smectite; F-feldspar; K-kaolinite; Q-quartz).
[Figura 2: Difratogramas de raios X das bentonitas naturais e purificadas (C-carbonato de cálcio; E-esmectita; F-feldspato; K-caulinita; Q-quartzo).]
5 5 5
2q (degree) 2q (degree) 2q (degree)
and the differential thermal analysis (DTA), of the samples studied. Figs. 3a and 3b show that the most pronounced mass losses occurred between 70-250 °C. These losses were due to the evaporation of the hydration water, the adsorbed water, and the coordinated water. Another important mass loss occurred between 400-550 °C. This loss was due to the dehydroxylation of the clay minerals. The reason that this structural water loss was observed at temperatures lower than that indicated for montmorillonite clay was the presence of iron in the tetrahedral and octahedral sheets of the clay minerals [60, 61]. The last mass loss, between 620-660 °C, seen in natural samples, came from the decomposition of carbonates into oxides. With the aid of XRF and XRD curves, these losses were identified as calcium carbonates. Analysis of the DTA curves (Fig. 3c) showed that the clays exhibited similar thermal behavior before and after purification by centrifugation. For the natural clays, the following thermal transformations were verified: a high endothermic peak at around 100 °C demonstrating the presence of free and adsorbed water; an endothermic peak at around 510 °C indicating the presence of hydroxylates of octahedral sheets of smectite and kaolinite; and the formation of a gentle endo-exothermic peak at around 900 °C, related to the destruction of part of the crystal lattice of the clay (endothermic reaction) and the nucleation of mullite (exothermic reaction) [61]. Comparing the results of the thermal analyses in this study with those found in previous studies [50, 53, 56], the typical behavior of bentonite clays from the State of Paraíba was verified. The purified clays presented the same thermal transformations as the natural ones, with a small difference in the temperatures of the endothermic band and the double endo-exothermic peak, which may be attributed to the differences in the granulometry of the samples [58].
Adsorption tests
Adsorption isotherms: adsorption equilibrium studies were performed using different adsorption isotherms. Four isothermal models (Langmuir, Freundlich, Temkin, and Dubinin-Radushkevich) were tested in order to analyze the experimental data of the adsorption equilibrium. The isotherms were constructed from RB interactions with
natural and purified clays, with RB concentration varying from 2.5 to 100 mg.L-1 and an adsorbent quantity of 100 mg for both natural and purified clays. In Fig. 4, it was noted that when the concentration of RB was low the adsorbed amount was minimal; on the other hand, with increasing RB concentration an increase of the adsorbed amount was observed. This occurred because there were more cations of RB for each active site on the clay surface, causing these sites to be occupied more and more by the dye molecules [62]. BRPuri (121.35 mg/g), RFPuri (122.58 mg/g) and VIPuri (119.68 mg/g) were the ones that presented better adsorptive performances; these values showed that the purification process can be used to improve the adsorptive capacity of these clays, and may even exceed, in terms of quantity adsorbed, other clays such as montmorillonite, kaolinite, pillarized clay, organoclay, among other adsorbents [21, 24, 63-65]. The equation parameters of the models (Table III) provide a view of the adsorption mechanism, surface properties, and adsorbent affinity [38, 47]. It was observed that the Freundlich isotherm model gave the best fit to the experimental data for both the natural and purified clays. It is also possible to verify the congruence of the data for the Freundlich model, from the graphs in Fig. 5. These results indicated that the adsorption of dye molecules occurred at Figure 3: TG (a), DrTG (b), and DTA (c) curves of the natural and purified bentonite clays.
[Figura 3: Curvas de TG (a), DrTG (b) e DTA (c) das bentonitas naturais e purificadas.]
Figure 4: Adsorbed quantity of RB dye as a function of initial concentration.
[Figura 4: Quantidade adsorvida do corante RB em função da concentração inicial.]
100
95
90
85
80
75
0 250 500 750 1000 0 250 500 750 1000 0 250 500 750 1000
Temperature (ºC) Temperature (ºC) Temperature (ºC)
Mass (%)
DrTG (mg/min)
DT
A
(µV)
120
100
80
60
40
20
0
10
Adsorbate concentration (mg/L)
Amount adsorbed (mg/g)
sites of different ionization energies present in the adsorbents [65]. The constant 1/n also indicated qualitatively that the adsorption was favorable and occurred heterogeneously on the surface of the adsorbent, because its value was always less than one [24].
Adsorption kinetics: the kinetic study of the adsorption processes provides useful data regarding the efficiency of adsorption and feasibility of big scale operations. Fig. 6 shows the adsorption behavior of the natural and purified clays (100 mg/200 mL) as a function of the adsorption contact time of the RB dye (10 mg/L). Overall, the rate of dye removal was relatively rapid in the early stages, but decreased gradually over time as it approached equilibrium, as expected. Initially large quantities were adsorbed rapidly, because of the abundant availability of active sites on the clay surface. Over time, as these sites gradually became occupied, the rate of adsorption slowed. The equilibrium time of this adsorption system, for all clays studied, was 120 min. Comparing the adsorptive behavior of the clays showed that the interactions of the RB dye with the purified clays obtained better results. This behavior can be explained by the presence of smaller-diameter particles than those found
in the natural clays, creating a larger contact surface between the adsorbent and the dye solution [66]. The experimental data were kinetically examined using three models: pseudo-first order, pseudo-second order, and intraparticle diffusion
Model Parameter BR BRPuri RF RFPuri VI VIPuri
Langmuir
Qmax (mg.g-1) 76.33 58.82 58.82 344.82 123.46 344.82
KL (10-2 L.mg-1) 1.22 2.08 1.17 0.64 0.11 0.11
R2 0.66 0.19 0.40 0.29 0.54 0.50
Freundlich
1/n 0.81 0.82 0.73 0.95 0.84 0.99
KF (mg1-1/n.L1/n.g-1) 1.32 1.61 2.35 2.23 1.13 2.90
R2 0.99 0.99 0.99 0.99 0.99 0.99
Temkin
bT (J.mol-1) 117.12 64.79 85.00 80.22 83.23 87.30
KT (L.mg-1) 0.14 4.07 0.47 0.30 2.34 1.58
R2 0.68 0.89 0.71 0.77 0.73 0.77
D-R
Qmax (mg.g-1) 22.46 60.70 30.41 43.15 35.62 37.11
KD (mol2.J-2) 1.00 4.00 5.00 2.00 3.00 1.00
R2 0.66 0.91 0.76 0.76 0.72 0.63
Table III - Parameters of adsorption isotherms. [Tabela III - Parâmetros das isotermas de adsorção.]
Figure 5: Adsorption isotherms of RB onto natural and purified bentonites fitted to the Freundlich model.
[Figura 5: Isotermas de adsorção da RB em bentonitas, naturais e purificadas, ajustadas ao modelo de Freundlich.]
3
2
1
0
2.0
Log (Q
e
)
Log (Q
e
)
Log (Q
e
)
2.0
1.5 1.5
1.0
1.0 0.5
0.5 0.0
0.0 0.0 0.0
Log (Ce) Log (Ce) Log (Ce)
1.0 1.0 1.0
0.5 1.5 2.0 0.5 1.5 2.0 0.5 1.5 2.0
a) b) c)
Figure 6: Adsorbed quantity of RB dye as a function of time.
[Figura 6: Quantidade adsorvida do corante RB em função do tempo.]
12
8
4
0 0
Time (min)
Amount adsorbed (mg/g)
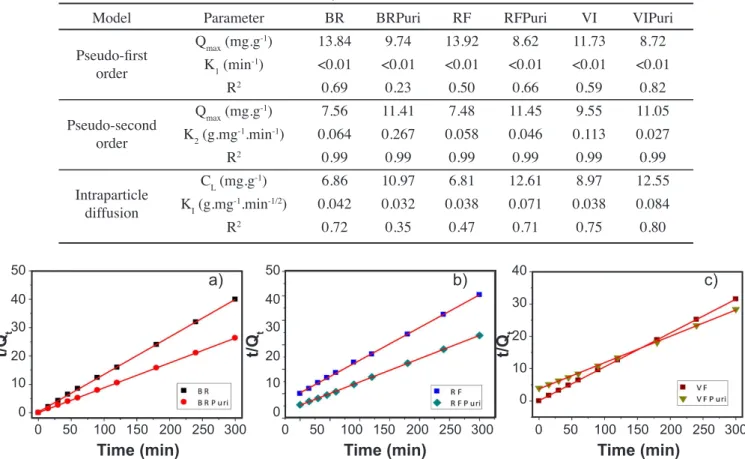
(Table IV). The data obtained for both natural and purified clays presented a better linear fit to the pseudo-second order equation. The pseudo-first order and intraparticle diffusion equations were not congruent with the results, giving correlation coefficients (R2) well below the coefficients observed for the pseudo-second order equation. The graphs constructed from the pseudo-second order equation (Fig. 7) showed high levels of congruence with the data. The pseudo-second order model explains the chemical adsorption processes that involve electron donation or exchange in the adsorbate and adsorbent systems, such as covalent bonds and ion exchange [42, 67]. This model is widely used in adsorption processes that use adsorbent bentonite clays on a variety of organic pollutants [38, 47, 68, 69].
Effect of pH variation: pH is an important factor that influences the adsorption process, affecting the adsorbate surface charge and the degree of ionization of the adsorbate functional groups, thus modifying the mechanism of adsorption. It has been observed that RB dye, in strongly acidic pH conditions, has a high electrostatic attraction to the surface of the adsorbents. The RB dye has three different sites that can ionize: the oxygen atom of the group (COO-) and the two atoms of nitrogen (-N=) in the amine groups. Therefore, in addition to the product of dissociation, there are three protonated species that can form in aqueous solutions. Their relative concentrations depend on the pH
of the solution. In the pH range of 4-13, the main species are generally stable (RB). They have a dipolar molecular structure in which one atom of the amino group is positively charged, while the oxygen atoms of the carboxyl group are negatively charged. When the pH reaches 3, the structure becomes positively charged (RBH+), as protonation of the carboxylic group occurs [23]. Analysis of the pH (Fig. 8) showed that the highest percentages of dye removal Figure 7: Pseudo-second order kinetic model applied on the adsorption of RB in natural and purified bentonites.
[Figura 7: Modelo cinético de pseudossegunda ordem aplicado na adsorção de RB em bentonitas naturais e purificadas.]
Figure 8: Amount removed of RB dye as a function of pH.
[Figura 8: Quantidade adsorvida do corante RB em função do pH.] Table IV - Kinetic parameters.
[Tabela IV - Parâmetros da cinética de adsorção.]
Model Parameter BR BRPuri RF RFPuri VI VIPuri
Pseudo-first order
Qmax (mg.g-1) 13.84 9.74 13.92 8.62 11.73 8.72
K1 (min-1) <0.01 <0.01 <0.01 <0.01 <0.01 <0.01
R2 0.69 0.23 0.50 0.66 0.59 0.82
Pseudo-second order
Qmax (mg.g-1) 7.56 11.41 7.48 11.45 9.55 11.05
K2 (g.mg-1.min-1) 0.064 0.267 0.058 0.046 0.113 0.027
R2 0.99 0.99 0.99 0.99 0.99 0.99
Intraparticle diffusion
CL (mg.g-1) 6.86 10.97 6.81 12.61 8.97 12.55
KI (g.mg-1.min-1/2) 0.042 0.032 0.038 0.071 0.038 0.084
R2 0.72 0.35 0.47 0.71 0.75 0.80
50 50
30 30
30
10 10
10
0 0 0
40 40
40
20 20
20
0 0 0
Time (min) Time (min) Time (min)
t/Q
t
t/Q
t
t/Q
t
50 100 150 200 250 300 50 100 150 200 250 300 50 100 150 200 250 300
a) b) c)
100
80
60
40
20
3 5 7 9 11
pH
occurred when the pH was acidic, indicating that the adsorption mechanism of the RB dye occurred through ion exchange and was governed by electrostatic and van der Waals attractions. The worst results occurred when pH was basic, as the increase of hydroxides in the solution increased the repulsion between the adsorbents and the dye.
CONCLUSIONS
The results obtained indicated that natural and purified bentonite clays can be considered an ecological alternative for the removal of the rhodamine B dye, present in textile effluents. Purified clays, due to their lower particle diameter and higher clay percentage, were the samples that showed the highest level of dye removal. With regard to adsorption equilibrium, the Freundlich isotherm produced the best fit for the adsorption data, indicating that the dye does not form a monolayer on the adsorbent, but instead is adsorbed heterogeneously in multiple layers. In the kinetic study, the pseudo-second order equation was the one that best described the adsorption process for all clays, having the best correlation to the experimental data, indicating that the adsorption behavior occurred throughout the whole time period and involved chemical adsorption and ion exchange between adsorbate and adsorbent.
ACKNOWLEDGEMENTS
The authors are grateful to the Brazilian government funding agencies CAPES, CNPq and Federal University of Campina Grande for supporting this research.
REFERENCES
[1] M. Khadhraoui, H. Trabelsi, M. Ksibi, S. Bouguerra, B. Elleuch, J. Hazard. Mater. 161 (2009) 974.
[2] A. Hassani, R.D.C. Soltani, S. Karaca, A. Khataee, J. Ind. Eng. Chem. 21 (2015) 1197.
[3] H. Shu, M. Chang, Dyes Pigm. 65 (2005) 25.
[4] S. Kaur, S. Rani, R.K. Mahajan, Desalin. Water Treat. 51 (2013) 37.
[5] P. Kumar, R. Agnihotri, K.L. Wasewar, H. Uslu, C. Yoo, Desalin. Water Treat. 50 (2012) 226.
[6] V.M. Correia, T. Stephenson, S.J. Judd, Environ. Technol. 15 (1994) 917.
[7] Z. Carmen, S. Daniela, in: Organic pollutants ten years after the Stockholm convention - environmental and analytical update, Ed. T. Puzyn, A. Mostrag, Intech, Rijeka (2012) 55.
[8] U.G. Akpan, B.H. Hameed, J. Hazard. Mater. 170 (2009) 520.
[9] F. Wu, R. Tseng, J. Hazard. Mater. 152 (2008) 1256. [10] G. Moussavi, M. Mahmoudi, J. Hazard. Mater. 168 (2009) 806.
[11] D.S. Tong, C.H. Zhou, Y. Lu, H. Yu, G.F. Zhang, W.H. Yu, Appl. Clay Sci. 50 (2010) 427.
[12] Ö. Gök, A.S. Özcan, A. Özcan, Appl. Surf. Sci. 256
(2010) 5439.
[13] M. Kiranşan, R.D.C. Soltani, A. Hassani, S. Karaca, A. Khataee, J. Taiwan Inst. Chem. Eng. 45 (2014) 2565. [14] N. Abidi, E. Errais, J. Duplay, A. Berez, A. Jrad, G. Schäfer, M. Ghazi, K. Semhi, M. Trabelsi-Ayadi, J. Clean. Prod. 86 (2015) 432.
[15] C. Su, W. Li, X. Liu, L. Zhang, Desalin. Water Treat. 52 (2014) 880.
[16] S.S. Gupta, K.G. Bhattacharyya, Phys. Chem. Chem. Phys. 14 (2012) 6698.
[17] A. Ongen, H.K. Ozcan, E.E. Ozbas, N. Balkaya, Desalin. Water Treat. 40 (2012) 129.
[18] F. Bergaya, G. Lagaly, in: Handb. Clay Sci., vol. 1, Elsevier (2006) 1.
[19] K.A. Carrado, A. Decarreau, S. Petit, F. Bergaya, G. Lagaly, in: Handb. Clay Sci., Ed. F. Bergaya, G. Lagaly, vol. 1, Elsevier (2006) 115.
[20] H. Gan, G. Zhang, Y. Zhang, Y. Guo, Desalin. Water Treat. 45 (2012) 112.
[21] T.A. Khan, S. Dahiya, I. Ali, Appl. Clay Sci. 69 (2012) 58.
[22] R. Jain, M. Mathur, S. Sikarwar, A. Mittal, J. Environ. Manage. 85 (2007) 956.
[23] Z. Grauer, A.B. Malter, S. Yariv, D. Avnir, Colloids Surf. A 25 (1987) 41.
[24] P.P. Selvam, S. Preethi, P. Basakaralingam, N. Thinakaran, A. Sivasamy, S. Sivanesan, J. Hazard. Mater. 155 (2008) 39.
[25] I. Langmuir, J. Am. Chem. Soc. 252 (1916) 2221. [26] A. Dabrowski, Adv. Colloid Interface Sci. 93 (2001) 135.
[27] C.A.P. Almeida, N.A. Debacher, A.J. Downs, L. Cottet, C.A.D. Mello, J. Colloid Interface Sci. 332 (2009) 46. [28] L. Ma, Y. Xi, H. He, G.A. Ayoko, R. Zhu, J. Zhu, Appl. Clay Sci. 120 (2016) 9.
[29] X. Xin, W. Si, Z. Yao, R. Feng, B. Du, L. Yan, Q. Wei, J. Colloid Interface Sci. 359 (2011) 499.
[30] D. Doulia, C. Leodopoulos, K. Gimouhopoulos, F. Rigas, J. Colloid Interface Sci. 340 (2009) 131.
[31] A. Benhouria, M.A. Islam, H. Zaghouane-Boudiaf, M. Boutahala, B.H. Hameed, Chem. Eng. J. 270 (2015) 621. [32] M. Roulia, A.A. Vassiliadis, Microporous Mesoporous Mater. 116 (2008) 732.
[33] G. McKay, H.S. Blair, J.R. Gardner, J. Appl. Polym. Sci. 27 (1982) 3043.
[34] F.F. Sodré, E. Lenzi, A.C.S. da Costa, Quim. Nova 24 (2001) 324.
[35] M. Islam, R. Patel, Desalination 256 (2010) 120. [36] G. Gereli, Y. Seki, I. Murat Kuşoǧlu, K. Yurdakoç, J. Colloid Interface Sci. 299 (2006) 155.
[37] R. Elmoubarki, F.Z. Mahjoubi, H. Tounsadi, J. Moustadraf, M. Abdennouri, A. Zouhri, A. El Albani, N. Barka, Water Resour. Ind. 9 (2015) 16.
[38] V. Vimonses, S. Lei, B. Jin, C.W.K. Chow, C. Saint, Chem. Eng. J. 148 (2009) 354.
[40] X. Yang, B. Al-Duri, J. Colloid Interface Sci. 287 (2005) 25.
[41] L. Cottet, C.A.P. Almeida, N. Naidek, M.F. Viante, M.C. Lopes, N.A. Debacher, Appl. Clay Sci. 95 (2014) 25. [42] Y.S. Ho, J. Hazard. Mater. 136 (2006) 681.
[43] H. Zaghouane-Boudiaf, M. Boutahala, Desalin. Water Treat. 24 (2010) 47.
[44] C. Umpuch, S. Sakaew, Songklanakarin J. Sci. Technol. 35 (2013) 451.
[45] A.S. Özcan, A. Özcan, J. Colloid Interface Sci. 276 (2004) 46.
[46] J.L. Marco-Brown, M.M. Areco, R.M. Torres Sánchez, M. Dos Santos Afonso, Colloids Surfaces A Physicochem. Eng. Asp. 449 (2014) 121.
[47] I. Chaari, B. Moussi, F. Jamoussi, J. Alloys Compd. 647 (2015) 720.
[48] J.C.R. Marques, C.D. da Silva, I.A. da Silva, H.S. Ferreira, G.D.A. Neves, H.C. Ferreira, Mater. Sci. Forum 728 (2012) 1444.
[49] R.R. Menezes, L.F.A. Campos, H.S. Ferreira, L.N. Marques, G.A. Neves, H.C. Ferreira, Cerâmica 55, 336 (2009) 349.
[50] I.D.S. Pereira, I.A. Silva, J.M. Cartaxo, R.R. Menezes, L.N.L. Santana, G.A. Neves, H.C. Ferreira, Cerâmica 60, 354 (2014) 223.
[51] Z. Gong, L. Liao, G. Lv, X. Wang, Appl. Clay Sci. 119 (2016) 294.
[52] C.H. Thuc, A. Grillet, L. Reinert, F. Ohashi, H. Ha, L. Duclaux, Appl. Clay Sci. 49 (2010) 229.
[53] B.M.A. Brito, J.M. Cartaxo, N.F.C. Nascimento, H.C. Ferreira, G.A. Neves, R.R. Menezes, Cerâmica 62, 361 (2016) 45.
[54] R.R. Menezes, P.M. Souto, L.N.L. Santana, G.A. Neves, R.H.G.A. Kiminami, H.C. Ferreira, Cerâmica 55,
334 (2009) 163.
[55] C.I.R. Oliveira, M.C.G. Rocha, A.L.N. Silva, L.C. Bertolino, Cerâmica 62, 363 (2016) 272.
[56] I.A. Silva, F.K.A. Sousa, H.S. Ferreira, H.S. Ferreira, G.A. Neves, H.C. Ferreira, Cerâmica 63, 365 (2017) 109. [57] S.J. Chipera, D.L. Bish, Clays Clay Miner. 49 (2001) 398.
[58] H.S. Ferreira, R.R. Menezes, H.S. Ferreira, A.B. Martins, G.A. Neves, H.C. Ferreira, Cerâmica 54, 329 (2008) 77.
[59] I.F. Leite, C.M.O. Raposo, L.E. Canedo, L.H. De Carvalho, S.M.D.L. Silva, Polímeros 21 (2011) 195.
[60] J.W. Stucki, in: Handb. Clay Sci., Ed. F. Bergaya, G. Lagaly, vol. 1, Elsevier (2006) 423.
[61] P.S. Santos, Ciência e tecnologia das argilas, 2ª ed., Edgar Blücher, S. Paulo (1992).
[62] K.G. Bhattacharyya, S.S. Gupta, G.K. Sarma, Appl. Clay Sci. 99 (2014) 7.
[63] Z. Klika, H. Weissmannová, P. Capková, M. Pospíšil, J. Colloid Interface Sci. 275 (2004) 243.
[64] M.F. Hou, C.X. Ma, W. De Zhang, X.Y. Tang, Y.N. Fan, H.F. Wan, J. Hazard. Mater. 186 (2011) 1118.
[65] T.S. Anirudhan, M. Ramachandran, Process Saf. Environ. Prot. 95 (2015) 215.
[66] P. Marin, C.E. Borba, A.N. Módenes, S. Priscila, D. De Oliveira, N. Passaia, L.S. Figueiredo, Engevista 17 (2015) 59.
[67] Y.S. Ho, G. McKay, Process Biochem. 34 (1999) 451. [68] I. Feddal, A. Ramdani, S. Taleb, E.M. Gaigneaux, N. Batis, N. Ghaffour, Desalin. Water Treat. 52 (2014) 13. [69] C. Leodopoulos, D. Doulia, K. Gimouhopoulos, T.M. Triantis, Appl. Clay Sci. 70 (2012) 84.