Article
Printed in Brazil - ©2018 Sociedade Brasileira de Química
*e-mail: [email protected]
Preparation and Performance of an Estradiol Templated Magnetic Sphere of
Molecularly Imprinted Cryogel
Jian Wang, Lili Tian, Yanan Yan, Yaru Liu, Yan Zhang and Chun Yang*
School of Chemistry and Chemical Engineering, Yangzhou University, 225002 Yangzhou, China
An estradiol templated core-shell magnetic molecularly imprinted cryogel (MMIC) was synthesized to selectively extract and analyze estradiol in milk powder. The microsphere of Fe3O4@SiO2 was firstly prepared on Fe3O4 with ethyl silicate and 3-methyl propyl trimethoxy
silane. Then the polymerization of α-methacrylic acid and ethylene glycol dimethyl acrylate was carried out on Fe3O4@SiO2 at −20 °C for 24 h with estradiol as template. The morphology and
microstructure of MMIC were investigated by transmission electron microscopy and infrared spectrogram. When used as chromatographic stationary phase, MMIC showed good selectivity and chromatographic performance for the template. Spiked milk powder samples were used to examine the adsorption capacity and selectivity of MMIC, giving recoveries of 92-101% and limit of detection 0.8-1.2 ng g−1. Experimental results indicate good reproducibility with
relative standard deviation from 2.2 to 4.5% (n = 3) at spiked levels of estradiol 10, 50, and 100 ng g-1.
Keywords: magnetic sphere, molecularly imprinted cryogel, estradiol, milk powder
Introduction
Sample preparation is of vital importance in an analysis for reducing the interference of impurities, concentrating the low abundant components, and improving the sensitivity and selectivity. Sample pretreatment occupies more than 60% of the entire time, while it presents poor reproducibility and accuracy. Thus, a sound sample pretreatment is crucial to guarantee the accuracy, reliability of the results, as well as the efficiency of analytical determination.1
Solid phase extraction (SPE) has widely been used in the extraction, purification, and enrichment of analytes in environmental, food, and biological samples. However, SPE cannot eliminate the interference of matrix in complex samples because the conventional adsorbents, such as normal, reverse, and ionic phase and other special adsorbents, have poor selectivity. Molecularly imprinted polymer (MIP) is a kind of inclusive compound prepared from template, monomer, and cross linker. There is a covalent bond or hydrogen bond or Van der Waals’ force between template and polymer.2 When template
molecule is removed, a specific cavity with binding sites complementary to the size, shape, and functional group of template is formed in the polymer.2 Molecularly imprinted
polymers based solid phase extraction (MIP-SPE) can be implemented in selective separation, analysis, and preparation of high-purity target substance. MIP-SPE can achieve rapid and high efficiency of extraction of the analytes, because of high specific surface area and high mass transfer rate.3,4
Core-shell magnetic molecularly imprinted polymer (MMIP) is a new type of functional composite, the magnetic core (such as Fe3O4) of which is covered with inorganic
(SiO2, Al2O3, etc.) or organic (surfactant, polymer, etc.)
layers.5-7 The layer can be further modified with hydrophilic
and/or biocompatible functional groups, including C=C, –NH−, −Br and sulfonyl, then dipole interaction of core is
shielded, and agglomeration of particles is prevented.3,8-10
Core-shell MMIP can provide specific recognition because of the mesoporous and microporous molecular scale cavities, and can shorten the processing time of sample due to the excellent settling performance and ease to be separated from the matrix through an external magnetic field.11 Core-shell MMIP can increase the contact area of
adsorbent and matrix, and thus provide a larger diffusion and mass transfer rate due to its good dispersion.12 Fe
3O4
Some functional groups modified core-shell MMIP meet the requirements of a chromatographic stationary phase, and have been applied in capillary electrophoresis and chromatographic separation.15,16 Zhu et al.17 used
Fe3O4@SiO2-NH2 magnetic nanoparticles as stationary
phase in capillary electrochromatography. The column efficiency was evaluated with five organic acids and the relative column efficiency of ortho amino benzoic acid was 220,000 plates m-1. Yan et al.18 prepared core shell magnetic
SiO2-UIO-66 and used it as stationary phase in liquid
chromatography. The packed column was applied to the rapid and efficient separation of isomers, including toluene and xylene, chlorotoluenes, ethylbenzene and xylene. Qin et al.19 prepared core shell magnetic silica microparticle
with COOH-terminated surface through liquid phase epitaxy, and used it as a stationary phase for separation of isomers, such as pyridine and 4,4’-bipyridine, and chloroaniline by size exclusion chromatography.
Cryogels are cryogenically polymerized macroporous material.20 The super macroporous structure in cryogel
leads to a very low mass transfer resistance, and facilitates optional modifications on its surface to satisfy various research purposes.21 Molecularly imprinted cryogels
(MICs) integrate fast mass transfer, high selectivity and suitable affinity toward specific targeted molecules.22
MICs have been widely used in the fields of bioanalysis and bioengineering to deal with peptides, proteins, nucleic acids, virus particles, organelle, cell and microorganism.23-27
Additionally, a modified MIC has been used to catalyze the production of biodiesels.28 Various molecular imprinting
strategies, including mixed template, dummy template, pending template, have been utilized in the synthesis of MICs with different template molecules.29-32
Synthetic estrogens, such as estradiol (E2), show strong endocrine disruption impacts on the hormone balance in an organism even under extremely low concentrations, due to their similar biological effects to that of endogenous hormones.33,34 Estrogen can enter and store in the human
body through the food chain and cause toxic and side effects.35 Abuse of estrogens will cause abnormal sex,
short growth cycle, feminization and sexual precocity of animals and human.36-38 In production of raw milk, farmers
may use illegally antibiotics and hormones to increase milk production. The aim of determine estrogens in raw milk and dairy products is to monitor milk production. Estrogens have been detected by gas chromatography-mass spectrometry (GC-MS), liquid chromatography-mass spectrometry (LC-MS), high-performance liquid chromatography tandem mass spectrometry (HPLC-MS/MS), fluorescence quenching, and surface enhanced Raman spectroscopy.39-43
Estrogens have been extracted by cloud point, membrane
assisted liquid-liquid extraction, solid phase extraction, and solid phase microextraction (SPME)44-47 from water, silt,
animal tissues, and aquatic products.48 Stir bar, dispersive
liquid-liquid microextraction, and ultrasound-assisted surfactant-enhanced emulsification microextraction have also been employed in extracting estrogen.49-51 Extraction
of estrogen in infant milk powder by core-shell MIC has not been reported previously.
In the present paper, spherical core-shell magnetic Fe3O4@SiO2@MIC with E2 as template was prepared through
coating MIC on magnetic microparticles via cryogenical free radical polymerization. The prepared Fe3O4@SiO2@MIC
was utilized in the selective extraction of E2 from infant formula milk powder. Magnetic substrate was first modified with SiO2 and then grafted with vinyl end groups. Cryogenical
polymerization was performed via copolymerization of vinyl group with functional monomer and cross linker in the presence of target molecule at −20 °C. The results verified that the present Fe3O4@SiO2@MIC was applicable to the
detection of E2 from infant formula milk powder.
Experimental
Reagents and equipments
FeCl3·6H2O was analytical reagent (AR) and purchased
from Aladdin, China. 3-Methyl propyl trimethoxy silane (MPS, AR) was purchased from Nanjing Daoning Chemical Co. Ltd., China. E2 and estriol (98%) were obtained from Adamas Reagent, Ltd., China. Methyl acrylic acid (MAA) was chemically pure (CP) and obtained from Shanghai Ling Feng Chemical Reagent Co., Ltd., China. Ethylene glycol dimethyl acrylate (EGDMA, AR) was from Alfa Aesar, China. Azobisisobutyronitrile (AIBN, CP) and tetraethoxysilane (TEOS, AR) were purchased from Shanghai NO. 4 Reagent & H. V. Chemical, Co., Ltd., China. Anhydrous sodium acetate (NaAc, AR), Tween-20 (CP), ammonium persulfate (APS, AR), sodium hydrogen sulfite (SBS, AR), methanol (guaranteed reagent), acetonitrile (AR), n-hexane (AR), ethanol (AR), acetone (AR) and potassium bromide (AR) were purchased from Sinopharm Chemical Reagent Co., Ltd., China.
Methods
The infrared absorption spectrogram of Fe3O4@SiO2@MIC
investigated by transmission electron microscopy (TEM, Tecnai 12, Philips, Netherlands) and X-ray diffraction (XRD, D8 ADVANCE, Bruker, Germany). HPLC analysis was performed on an Agilent 1200 HPLC comprising of a G1311A quaternary pump module, a G1329A autosampler and a G1315D diode-array detector (DAD). The mobile phases were methanol and water of different volume ratios at a flow rate of 0.8 mL min−1. Separation was performed in
a C18 column (150 × 4.6 mm, Inertsil, GL Sciences, Japan)
or a packed column at room temperature (25 °C). 20 µL of solution was injected into the columns for each analysis on DAD at 280 nm.
In real sample analysis, the samples of milk powder was preprocessed by liquid-liquid extraction, and extracted with MMIC after spiked with E2. The filter liquors before and after extraction were analyzed by HPLC.
Preparation of Fe3O4 microparticles
The Fe3O4 magnetic microparticles were prepared from
1.35 g FeCl3·6H2O, 3.60 g NaAc and 40 mL ethylene glycol
in a sealed high pressure reactor at 200 °C for 8 h, according to the method in literature.21
Preparation of double bond silanized magnetic microparticles of Fe3O4@SiO2
0 . 1 g F e3O4 w a s d i s p e r s e d i n a s o l u t i o n
(C2H2OH:H2O:NH3·H2O 80:20:1 v/v/v) after it was
ultrasonically washed in HCl (0.1 mol L-1) and water. The
mixture was magnetically stirred at room temperature for 6 h after 0.75 mL TEOS was dropped into it. Then black Fe3O4@SiO2 microparticles were prepared after the lower
solid was consecutively separated from liquid under an external magnetic field, washed with ethanol, and dried at 50 °C in a vacuum.
The mixture of 0.1 g Fe3O4@SiO2 in 30 mL C2H2OH was
stirred for 24 h at room temperature after 3 mL MPS was dropped into it. The lower solid was magnetically separated from the upper liquid and washed with CH3OH to remove
the residual MPS. Double bond silanized Fe3O4@SiO2
magnetic microparticles were obtained after the solid was dried at 50 °C in a vacuum.
Preparation of MMIC
A pre-reaction was carried out for 3 h at −20 °C in 2 mL acetone comprising 0.055 g E2 and 0.075 mL MAA. The prepolymerized pMAA containing E2, 0.050 g double bond silanized Fe3O4@SiO2, 0.660 mL EGDMA, and Tween 20
were ultrasonically dispersed evenly in 40 mL water. After
the mixture was emulsified completely, 0.028 g SBS and 0.086 g APS were ultrasonically dissolved in it evenly.
The crosslinking reaction was conducted at −20 °C for 24 h in a zip lock bag. The prepared cryogel was thawed at 60 °C in a water bath and the surplus water was removed by pump filtration afterwards. E2 was eliminated by a mixed solution of methanol and HAc (9:1 v/v). The magnetic microparticles MMIC were prepared ultimately after the solid remainder was dried at 50 °C. The complete route for preparing MMIC was illustrated in Figure 1.
For comparison, the MNIC (magnetic non-imprinted cryogel) was prepared in a similar route as that for preparing MMIC, without E2 molecules. Meanwhile, the E2 templated MIC was prepared in a similar route, without double bond silanized Fe3O4@SiO2 as the core.
Preparation of MMIP
0.075 mL MAA was prepolymerized with 0.055 g E2 in 20 mL solution of acetonitrile and toluene (3:1 v/v) for 3 h at room temperature. Afterwards, 0.05 g Fe3O4@MPS,
0.66 mL EGDMA, 40 mg AIBN were ultrasonically dispersed evenly in another 20 mL solution of acetonitrile and toluene (3:1 v/v). The two aliquots of mixture were mixed together and the crosslinking reaction was carried out at 60 °C for 24 h. The lower solid was magnetically separated from the liquid and washed with methanol after ageing at 80 °C for 3 h. E2 was removed by the solution (CH3OH:HAc 9:1 v/v) and MMIP was prepared after the
solid remainder was dried. MNIP (magnetic non-imprinted polymer) was prepared in a similar route as that for preparing MMIP, without E2.
Results and Discussion
Preparation conditions
the molar ratio of E2:MAA:EGDMA was 1:4:16. When 0.05 g E2 was placed in 2 mL acetonitrile, dioxane and acetone, E2 could hardly dissolve in acetonitrile. E2 dissolved completely in dioxane, however, the packed column with the prepared E2 templated MMIC as stationary phase tended to be blocked. E2 was readily dissolved in acetone, and the pressure of the MMIC packed column was still lower than 10 bars within 36 h. Therefore, acetone was chosen as the solvent of E2.
Characterization of MMIC
TEM
From Figure 2, the well dispersed Fe3O4 microparticles
were uniformly 500 nm. The diameter of the finally prepared MMIC particles increased to about three times as much as that of Fe3O4. From Figure 2e, MMIC particles had obvious
core-shell structure and larger cavities on the surface of it, which was formed during the polymerization at −20 °C. The core-shell structure of MMIC particles could not only increase the mass transfer rate between the solution and the surfaces of particles, but also could increase the hardness of the organic-inorganic hybrid material. It was advantageous for a good chromatographic behavior of MMIC when it was packed in a column as a stationary phase in HPLC.
FTIR
In Figure 3, the stretching vibration peaks at 769 cm-1 of
Si−O and 1082 cm-1 of Si−O−Si suggested the successful
silicon alkylation on the surfaces of Fe3O4 particles. The
sharp peak at 1631 cm-1 of C=C showed that MPS had
been successfully modified on the silanized magnetic microparticles, which would provide a large number of reactive sites for the subsequent polymerization. The stretching vibration peaks of C=O at 1728 cm-1 and C=C
at 2949 cm-1 were of MMIP, while the peaks of C=O at
1730 cm-1 and C=C at 2927 cm-1 were of MMIC. These
illustrated that MAA had been grafted on the surface of Fe3O4@MPS, as well as that the surfaces of the magnetic Fe3O4@SiO2 particles had been modified successfully with
a MIC layer.
XRD
Figure 4 showed that all the XRD curves of Fe3O4,
Fe3O4@SiO2, Fe3O4@MPS, MMIP and MMIC presented
the six characteristic peaks (2θ) of 30.2°, 35.6°, 43.2°,
53.6°, 57.2°, and 62.8°. These peaks corresponded to the crystal face index of (220), (311), (400), (422), (511), and (440) of Fe3O4 in XRD standard card (JCPDS: 19-629).
These XRD data stated that the prepared magnetic microparticles of Fe3O4@SiO2, Fe3O4@MPS, MMIP and
MMIC kept fine crystal structures consistent with that of
Figure 2. TEM images of (a) Fe3O4; (b) Fe3O4@SiO2; (c) Fe3O4@MPS;
(d) MMIP and (e) MMIC.
Figure 3. FTIR images of (a) Fe3O4@SiO2; (b) Fe3O4@MPS; (c) MMIP
and (d) MMIC.
Figure 4. XRD images of (a) Fe3O4; (b) Fe3O4@SiO2; (c) Fe3O4@MPS;
Fe3O4. It was conducive for a rapid solid-liquid separation
between MMIC and the upper solution, especially under an applied magnetic field.
Sedimentation behavior
Figure 5 presented the sedimentation behaviors of MIC, MMIC, and MMIP in bottles after ultrasonically processed for 1 min and settled for 10 min. The opaque solution above MMIC and MMIP became clear soon, while the upper solution kept opaque above MIC before and after sedimentation. MMIC and MMIP had a density far larger than MIC, thus MMIC and MMIP were far more readily to be settled in the bottom of the solution than MIC. Therefore, MMIC of a core-shell structure had a potential to be utilized as an adsorbent for a fast analysis of a target through a rapid solid-liquid phase separation.
Adsorption kinetics
10 mg MMIC, MMIP, MNIC, and MNIP were put into four centrifuge tubes, each one containing 10 mL solutions of E2 (80 mg L-1). Figure 6 presented the adsorption
quantity (Q) of E2 by MMIC, MMIP, MNIC and MNIP after 5, 10, 15, 20, 30, 40, 50, 60 min. All experiments were performed in triplicate.
The adsorption quantity (Q) was calculated from the equation 1:
(1)
where Ao is the initial absorbance of the sample solution;
At is the absorbance of the sample solution after adsorbed;
co is the initial concentration of the solution (mg mL-1);
V is the volume of the solution (mL); mi is the mass of dry
adsorption materials (g).
With the increase of time, the adsorption of E2 by MMIC increased more sharply than by MMIP, and the equilibrium adsorption capacity of E2 by MMIC was nearly twice that of MMIP. This was because MMIC had a large specific surface area and an appropriate pore-size distribution, namely, the proper proportion of macro-, meso- and micro-pores, and there were specific recognition sites of E2 on the surface and inside the large holes of MMIC. Thus, MMIC had a higher density of adsorption sites than MMIP. Meanwhile, the structure of the MMIC surface was more loose (see Figures 2d and 2e), thus analyte molecules were more likely to come into contact with the specific sites of MMIC. Briefly, the specific interaction between E2 and imprinting sites on MMIC led to a shift of adsorption-desorption equilibrium for the adsorption. Consequently, MMIC had a higher adsorption capacity and a faster adsorption rate for E2 than MMIP.
MNIC had no specific recognition sites for E2, though it had a looser structure than MNIP. Thus there was only slightly increase of the adsorption of E2 by MNIC, compared to MNIP.
The selectivity of MMIC for E2
The selectivity of MMIC for E2 was verified by comparing the adsorption quantity of MMIC for E2 with that for estriol (E3), a structural analogue of E2.
As shown in Figure 7, it was carried out the adsorption of E2 or E3 alone by MMIC or MNIC individually. Meanwhile, the simultaneous adsorption of E2 and E3 by Figure 5. Photos of (a) MIC (left) and MMIC (right) before sedimentation;
(b) MIC (left) and MMIC (right) 10 min after sedimentation; (c) MMIP before sedimentation; and (d) MMIP 10 min after sedimentation.
MMIC or MNIC in a mixed solution was conducted. All experiments were performed in triplicate.
When MMIC or MNIC adsorbed E2 and E3 solution individually, MMIC showed an adsorption capacity of E2 2.8 times that by MNIC. However, MMIC had an adsorption capacity of E3 15% higher than that of MNIC. Meanwhile, MMIC has an adsorption capacity for E2 70.5% higher than that for E3.
While MMIC or MNIC were placed in the mixed solution of E2 and E3, both adsorption for E2 and E3 decreased compared to that in their individual solution. The adsorption of E2 by MMIC reduced by 7.1%, while the adsorption of E3 reduced by 21.5%. The adsorption of E2 and E3 by MNIC reduced just slightly.3,10
Chromatographic performances
MMIC was packed in a 2 cm stainless steel column as stationary phase. Because Fe3O4@MPS had a greater
hardness than MAA, then a higher ratio of Fe3O4@MPS
to MAA in raw reactants resulted in a better pressure resistance of the prepared MMIC. With the increase of the ratio of Fe3O4@MPS to MAA, the column pressure
dropped gradually. When the ratio of Fe3O4@MPS to
MAA was 2:5, the imprinting factor (If) for E2 by MMIC
was the largest.
From Table S1(Supplementary Information) we can find that the polarity of the mobile phase increased and If
for E2 by MMIC rose by 3.61 times with the increase of H2O% (v/v) in the mobile phase from 0 to 40%. Acetone,
chosen as a non-retention component for the determination of dead time, has a larger polarity than E2. Then the elution ability of acetone was enhanced slightly; while for E2, the elution ability reduced relatively. Thus, the capacity factor (k) for E2 by MMIC increased, while k for E2 by
MMIC did not nearly change at the meantime. Under the synergic impacts of the molecular imprinting effect and the enhancement of the polarity of mobile phase, the imprinting factor of E2 by MMIC increased significantly.
Real sample analysis
5.00 g milk powder was placed in 45.00 mL of H2O/CH3CN (1:2 v/v). 3.00 g NaCl was placed in the
solution, and the mixture was centrifuged for 10 min at 5000 rpm. After the supernatant was taken out from the centrifuge tube, 10.00 mL n-hexane was added in it. The mixture was shaken for 1 min and kept still for 5 min (twice). Then n-hexane was removed and the lipid materials in milk powder were removed. The residual solution was dried, re-dissolved and capacitized to 5.00 mL with methanol. Finally, the E2-spiked solution of milk powder was prepared by adding 3.00 mL of above solution into 27.00 mL E2 standard solution (25 mg L-1).
MMIC and MNIC were put into the E2-spiked solution of milk powder. After the adsorption, the solution was filtered through 0.22 µm membrane.
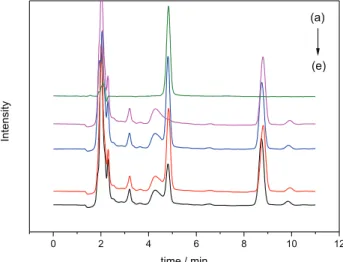
Each 20 µL of solution was injected in C18 column
(150 × 4.6 mm, Inertsil) and analyzed at 280 nm on DAD at a flow rate of 0.8 mL min−1 (CH
3OH:H2O 80:20 v/v).
From Figure 8, there were obvious signals of E2 (retention time 4.84 min) in the spiked solution before extraction. The peak height of E2 was dropped sharply about 50% after E2 in the spiked solution was extracted with MMIC, while just about 10% of the spiked E2 was extracted with MNIC. This indicates that MMIC possessed high enrichment capabilities and selectivity for E2 in milk powder.
Figure 7. Adsorption selectivity for E2 and E3 by MMIC and MNIC.
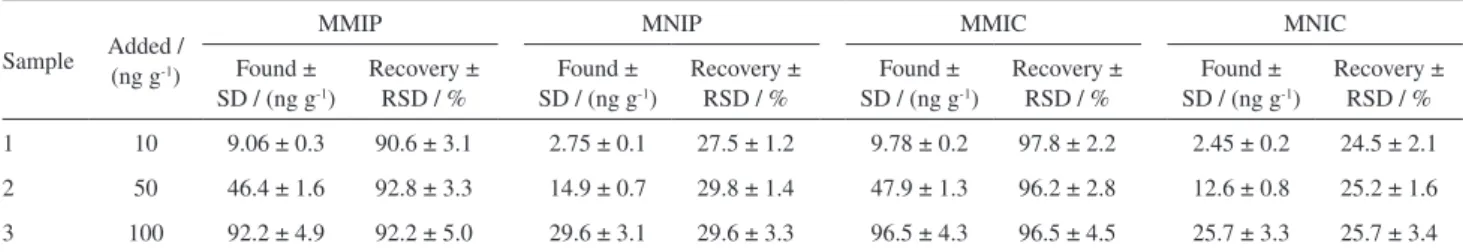
From Table 1, the recoveries and RSD of E2 from the spiked solution of real milk powder (10, 50 and 100 ng g−1)
after extraction by MMIC were 92-101% and 2.2-4.5% (n = 3), respectively. Meanwhile, the recoveries and RSD of E2 after extraction by MMIP from the spiked real samples were 87.2-97.2% and 3.1-5.0% (n = 3), respectively. Both the recoveries and RSD for the extraction of E2 using MMIC were better than using MMIP.
Different methods for determining E2 were summarized briefly in Table 2. The present approach had a limit of detection (LOD) for E2 0.8-1.2 ng g−1 (S/N 3), which was
lower than those reported by other methods. The present method could be utilized to detect E2 in milk powder with a satisfactory result owing to the relatively lower LOD and RSD, as well as higher recoveries.
Conclusion
An E2-templated MMIC was prepared with MAA as monomer, EGDMA as crosslinker at −20 °C on Fe3O4@MPS
microparticles. The diameter of the prepared MMIC particle was uniformly around three times as that of Fe3O4@SiO2.
MMIC had a higher adsorption capacity and a better recognition for E2 than MMIP. Meanwhile, MMIC showed good chromatographic properties as for the pressure of the packed column. The If for E2 as to acetone by MMIC
packed column was the largest under a mass ratio of Fe3O4@MPS to MAA 2:5 in raw materials.
In the analysis of E2 in the milk powder through MMIC based SPE-HPLC, the LOD was 0.8 ng g−1 (S/N 3) at spiked
levels of 10, 50 and 100 ng g−1, which was lower than that
using the conventional methods. The recoveries and RSD of E2 in the spiked samples were 92-101% and 2.2-4.5% (n = 3), respectively.
Supplementary Information
Supplementary information is available free of charge at http://jbcs.sbq.org.br.
Acknowledgments
This work was financially supported by China NSFC (No. 21375115), and the Priority Academic Program Development of Jiangsu Higher Education Institutions.
References
1. Wu, X.; Li, Y. R.; Zhu, X. L.; He, C. Y.; Wang, Q.; Liu, S. R.;
Talanta 2017, 162, 57.
2. Zarei, A. R.; Zafarghandi, R. S.; J. Braz. Chem. Soc. 2015, 26, 741.
Table 1. Performances of the analysis of E2 by HPLC (high-performance liquid chromatography) with MMIC and MMIP packed column
Sample Added / (ng g-1)
MMIP MNIP MMIC MNIC
Found ± SD / (ng g-1)
Recovery ± RSD / %
Found ± SD / (ng g-1)
Recovery ± RSD / %
Found ± SD / (ng g-1)
Recovery ± RSD / %
Found ± SD / (ng g-1)
Recovery ± RSD / %
1 10 9.06 ± 0.3 90.6 ± 3.1 2.75 ± 0.1 27.5 ± 1.2 9.78 ± 0.2 97.8 ± 2.2 2.45 ± 0.2 24.5 ± 2.1
2 50 46.4 ± 1.6 92.8 ± 3.3 14.9 ± 0.7 29.8 ± 1.4 47.9 ± 1.3 96.2 ± 2.8 12.6 ± 0.8 25.2 ± 1.6
3 100 92.2 ± 4.9 92.2 ± 5.0 29.6 ± 3.1 29.6 ± 3.3 96.5 ± 4.3 96.5 ± 4.5 25.7 ± 3.3 25.7 ± 3.4
MMIP: magnetic molecularly imprinted polymer; MNIP: magnetic non-imprinted polymer; MMIC: magnetic molecularly imprinted cryogel; MNIC: magnetic non-imprinted cryogel; SD: standard deviation; RSD: relative standard deviation.
Table 2. Comparison of LOD of E2 by various methods
Sample Pretreatment method Assay method LOD Recovery / % Reference
Water C18-SPE HPLC-UV 41.0-240.0 µg L−1 60-101 52
Milk, milk powder SPME HPLC-UV 4.3-7.5 ng mL−1 72.6-94.5 53
Milk d-SPE RAM-MMIP-HPLC-UV 4.7-10.5 ng g−1 85.2-98.6 54
Milk SPE HPLC-UV 4-6 ng g−1 84.1-93.5 55
Fish and prawn MIPs-SPE HPLC-FL 23.0 µg L−1 78.3-84.5 56
Milk powder MMIC-SPE HPLC-UV 0.8-1.2 ng g-1 92-101 this work
3. Madrakian, T.; Afkhami, A.; Mahmood-Kashani, H.; Ahmadi, M.; Talanta 2013, 105, 255.
4. Hajizadeh, S.; Xu, C. G.; Kirsebom, H.; Ye, L.; Mattiasson, B.;
J. Chromatogr. A 2013, 1274, 6.
5. Shi, H. L.; Peng, S. L.; Sun, J.; Liu, Y. M.; Zhu, Y. T.; Qing, L. S.; Liao, X.; J. Sep. Sci. 2014, 37, 704.
6. Martin, M.; Salazar, P.; Villalonga, R.; Campuzano, S.; Pingarron, J. M.; Gonzalez-Mora, J. L.; J. Mater. Chem. B 2014,
2, 739.
7. Martin, M.; Orive, A. G.; Lorenzo-Luis, P.; Creus, A. H.; Gonzalez-Mora, J. L.; Salazar, P.; ChemPhysChem 2014, 15, 3742.
8. Azodi-Deilami, S.; Abdouss, M.; Asadi, E.; Najafabadi, A. H.; Sadeghi, S.; Farzaneh, S.; Asadi, S.; J. Appl. Polym. Sci. 2014,
131, 41209.
9. Gao, R.; Mu, X.; Zhang, J.; Tang, Y.; J. Mater. Chem. B 2014,
2, 783.
10. Zengin, A.; Yildirim, E.; Tamer, U.; Caykara, T.; Analyst 2013,
138, 7238.
11. Socas-Rodriguez, B.; Hernandez-Borges, J.; Salazar, P.; Martin, M.; Rodriguez-Delgado, M. A.; J. Chromatogr. A 2015, 1397, 1.
12. Rios, A.; Zougagh, M.; Bouri, M.; Anal. Methods 2013, 5, 4558.
13. Xie, L. J.; Jiang, R. F.; Zhu, F.; Liu, H.; Ouyang, G. F.; Anal. Bioanal. Chem. 2014, 406, 377.
14. Li, Q. L.; Lam, M. H. W.; Wu, R. S. S.; Jiang, B. W.;
J. Chromatogr. A 2010, 1217, 1219.
15. Huang, H. Y.; Lin, C. L.; Wu, C. Y.; Cheng, Y. J.; Lin, C. H.;
Anal. Chim. Acta 2013, 779, 96.
16. Cychosz, K. A.; Ahmad, R.; Matzger, A. J.; Chem. Sci. 2010,
1, 293.
17. Zhu, Y. X.; Zhou, C. R.; Qin, S. S.; Ren, Z. Y.; Zhang, L. Y.; Fu, H. G.; Zhang, W. B.; Electrophoresis 2012, 33, 340. 18. Yan, Z. M.; Zheng, J. N.; Chen, J. F.; Tong, P.; Lu, M. H.; Lin,
Z.; Zhang, L.; J. Chromatogr. A 2014, 1366, 45.
19. Qin, W. W.; Silvestre, M. E.; Kirschhöfer, F.; Brenner-Weiss, G.; Franzreb, M.; J. Chromatogr. A 2015, 1411, 77.
20. He, L.; Gielen, G.; Bolan, N. S.; Zhang, X.; Qin, H.; Huang, H.; Wang, H.; Agron. Sustainable Dev. 2015, 35, 519. 21. Lan, H. Z.; Gan, N.; Pan, D. D.; Hu, F. T.; Li, T. H.; Long, N.
B.; Qiao, L.; J. Chromatogr. A 2014, 1331, 10.
22. Denizli, A.; Say, R.; Pişkin, E.; React. Funct. Polym. 2003, 55, 99.
23. Cetin, K.; Denizli, A.; Colloids Surf. B 2015, 126, 401. 24. Yang, C.; Zhou, X. L.; Liu, Y. R.; Zhang, Y.; Wang, J.; Tian, L.
L.; Yan, Y. N.; Chin. J. Anal. Chem. 2016, 44, 1322.
25. Unluer, O. B.; Ersoz, A.; Denizli, A.; Demirel, R.; Say, R.;
J. Chromatogr. B 2013, 934, 46.
26. Yang, C.; Zhou, X. L.; Liu, Y. R.; Wang, J.; Tian, L. L.; Zhang, Y.; Hu, X. Y.; J. Appl. Polym. Sci. 2016, 133, 1.
27. Wang, Y.; Li, N.; Chem. Ind. Eng. Prog. (Beijing, China) 2010,
29, 2315.
28. Yang, C.; Liu, G. F.; Zhou, X. L.; Liu, Y. R.; Wang, J.; Tian, L. L.; Hu, X. Y.; Wang, Y. Y.; Catal. Lett. 2015, 145, 1778. 29. Zhang, C.; Jia, X.; Wang, Y.; Zhang, M.; Yang, S.; Guo, J.;
J. Sep. Sci. 2014, 37, 419.
30. Onnby, L.; Pakade, V.; Mattiasson, B.; Kirsebom, H.; Water Res. 2012, 46, 4111.
31. Yang, C.; Luan, X.; Zhao, M.; Liu, G.; Wang, J.; Qu, Q.; Hu, X.; Electrophoresis 2013, 34, 1383.
32. Asliyuce, S.; Uzun, L.; Say, R.; Denizli, A.; React. Funct. Polym.
2013, 73, 813.
33. Qiao, L.; Gan, N.; Hu, F.; Wang, D.; Lan, H.; Li, T.; Wang, H.;
Microchim. Acta 2014, 181, 1341.
34. Marques, R.; Vaz, F. A. S.; Polonini, H. C.; de Oliveira, M. A. L.; J. Braz. Chem. Soc. 2015, 26, 609.
35. Peng, H. L.; Luo, M.; Xiong, H.; Yu, N. X.; Ning, F. J.; Fan, J. P.; Zeng, Z. L.; Li, J. H.; Chen, L. X.; J. Chromatogr. A 2016,
1442, 1.
36. Li, Y.; Zhang, C.; Liu, J. L.; Li, X. P.; Wang, X. J.; Chem. J. Chin. Univ. 2013, 34, 634.
37. Xie, G. J.; Jiang, L. Y.; Chen, J. M.; Chin. J. Soil Sci. 2008, 39, 182.
38. Gail, M. H.; Fears, T. R.; Hoover, R. N.; Chandler, D. W.; Donaldson, J. L.; Hyer, M. B.; Pee, D.; Ricker, W. V.; Siiteri, P. K.; Stanczyk, F. Z.; Vaught, J. B.; Ziegler, R. G.; Cancer Epidemiol., Biomarkers Prev. 1996, 5, 835.
39. Cesen, M.; Heath, E.; Sci. Total Environ. 2017, 590, 832. 40. Zhu, W.; Liu, Y.; Yuan, P.; Yang, J.; Chin. J. Chromatogr. 2010,
28, 1031.
41. Barreiro, R.; Regal, P.; Diaz-Bao, M.; Fente, C. A.; Cepeda, A.;
Foods 2015, 4, 605.
42. Ni, X.; Xia, B.; Wang, L. M.; Ye, J.; Du, G. S.; Feng, H. W.; Zhou, X. T.; Zhang, T.; Wang, W. H.; Anal. Biochem. 2017,
523, 17.
43. Albuquerque, C. D. L.; Nogueira, R. B.; Poppi, R. J.;
Microchem. J. 2016, 128, 95.
44. Ben Sghaier, R.; Net, S.; Ghorbel-Abid, I.; Bessadok, S.; Le Coz, M.; Hassan-Chehimi, D. B.; Trabelsi-Ayadi, M.; Tackx, M.; Ouddane, B.; Water, Air, Soil Pollut. 2017, 228, 2. 45. Goh, S. X. L.; Duarah, A.; Zhang, L. F.; Snyder, S. A.; Lee, H.
K.; J. Chromatogr. A 2016, 1465, 9.
46. de Amorim, K. P.; Andrade, L. S.; Anal. Methods 2017, 9, 1627.
47. Iparraguirre, A.; Navarro, P.; Rodil, R.; Prieto, A.; Olivares, M.; Etxebarria, N.; Zuloaga, O.; J. Chromatogr. A 2014, 1356, 163. 48. Luo, X. L.; Li, G. K.; Hu, Y. F.; Talanta 2017, 165, 377. 49. Qiu, X. Z.; Wu, Y.; Chen, D. Z.; Lai, L. Y.; Liang, Y.; Guo, H.
S.; J. Nanosci. Nanotechnol. 2016, 16, 12374.
51. Zou, Y.; Li, Y. H.; Jin, H.; Zou, D. Q.; Liu, M. S.; Yang, Y. L.;
J. Braz. Chem. Soc. 2012, 23, 694.
52. Stafiej, A.; Pyrzynska, K.; Regan, F.; J. Sep. Sci. 2007, 30, 985. 53. Tian, M. M.; Feng, W.; Ye, J. J.; Jia, Q.; Anal. Methods 2013,
5, 3984.
54. Lv, Y. K.; He, Y. D.; Xiong, X.; Wang, J. Z.; Wang, H. Y.; Han, Y. M.; New J. Chem. 2015, 39, 1792.
55. Liu, H. C.; Zou, Y. H.; Li, Q. W.; Zhu, E.; Chin. J. Anal. Chem.
2008, 36, 245.
56. Jiang, T. H.; Zhao, L. X.; Chu, B. L.; Feng, Q. H.; Yan, W.; Lin, J. M.; Talanta 2009, 78, 442.
Submitted: April 7, 2017
Published online: June 7, 2017