Article
Printed in Brazil - ©2017 Sociedade Brasileira de Química0103 - 5053 $6.00+0.00*e-mail: [email protected]
Development of Molecularly Imprinted Polymers for Solid Phase Extraction of
Parabens in Plasma Samples and Analysis by UHPLC-MS/MS
Mariane V. Roldão, Lidervan P. Melo, Luis Felippe C. Miranda, Marcos G. Resende and Maria Eugênia C. Queiroz*
Departamento de Química, Faculdade de Filosofia Ciência e Letras de Ribeirão Preto, Universidade de São Paulo, 14040-901 Ribeirão Preto-SP, Brazil
Two molecularly imprinted polymers (MIPs) were synthesized, by sol-gel and radical polymerization procedures. These MIPs were evaluated as selective stationary phases for miniaturized solid phase extraction (MISPE) to determine parabens in plasma samples by ultra-high performance liquid chromatography-tandem mass spectrometry (UHPLC-MS/MS). Selective cavities of the MIPs, based on molecular recognition (hydrogen bonds), were revealed after removal of the template (benzylparaben). Both MIPs were characterized by scanning electron microscope (SEM) and Fourier-transform infrared spectroscopy (FTIR). MIP prepared by radical process presented higher selective binding capacity for the target parabens than MIP prepared by sol-gel. Several variables that influence MISPE performance, including sample pH, sorbent washing, elution solvent, and elution solvent volume were also evaluated. According to the analytical validation parameters, the MISPE/UHPLC-MS/MS method is suitable for the analysis of parabens in plasma samples. The effectiveness of this method was demonstrated through the analyses of the umbilical plasma samples from postpartum women.
Keywords: parabens, molecularly imprinted polymer, miniaturized solid phase extraction, UHPLC-MS/MS, plasma samples
Introduction
Parabens, neutral esters derived from p-hydroxybenzoic acid, are used on large scale as chemical preservatives in cosmetic products. Parabens at low concentrations (0.016 to 0.4%) inhibits the growth of bacteria and fungi. These compounds also have low reactivity and showed low package absorption.1-3 When parabens are present in high
concentrations in the dermis, they may accumulate in the human body tissues in a similar way to other lipophilic compounds, which are bioaccumulative, or they may induce allergic dermatitis in sensitive individuals.3,4
Although the use of parabens is regulated, traces concentrations of unhydrolyzed parabens have been determined in different biological samples, including plasma,5
breast milk,6-9 ovarian tissues,10 urine,4,7,11-14 and serum4,7,13,15
by chromatographic or electrophoresis techniques.
Biological samples may not be introduced in their nature state in chromatographic systems, due to their endogenous compounds, mainly the proteins that can:
(i) suppress the ionization of analytes, during the ionization process (liquid chromatography-mass spectrometry (LC-MS) analysis); (ii) co-elute with analytes, during the chromatographic separation; or (iii) adsorb irreversibly in analytical column. Therefore, several sample preparation techniques, including protein precipitation,16 solid phase
extraction (SPE),4,5,11,13 stir-membrane solid-liquid-liquid
microextraction (SM-SLLME),9 dispersive liquid-liquid
microextraction (DLLME),8,15 and microextraction by
packed sorbent (MEPS),12 have been used in combination
with chromatographic or electrophoresis techniques to determine parabens in biological samples.
Due to the complexity of biological samples and the low concentration (trace levels) of parabens in biological samples, molecularly imprinted polymers have been used to increase selectivity and sensitive of the SPE method.6
Molecularly imprinted polymers (MIPs), synthetic materials based on biomimetic systems (molecular recognition sites),
such as enzyme-substrate or antigen-antibody,16,17 have
Most polymers of molecular imprinting based on acrylic polymers or organic acrylates are synthesized by radical polymerization. The main advantages of the radical MIP are chemical stability, robustness, reproducibility in synthesis procedure, higher adsorption capacity, and low cost.21 The
sol-gel process is an alternative technique. The organic-inorganic materials are obtained through sequential stages of hydrolysis and condensation reactions of metal alkoxides in acidic or basic condition. MIP via sol-gel process are porous, robust, chemically inert, and exhibit high affinity, selectivity and efficient mass transfer rate.6
This manuscript describes the development of two molecularly imprinted polymers by distinct process, sol-gel and radical polymerization that were used as stationary phase for MISPE to determine parabens in plasma samples by ultra-high performance liquid chromatography-tandem mass spectrometry (UHPLC-MS/MS) to assess the human exposure to these compounds.
Experimental
Materials
The chromatographic standards of methyl, ethyl, propyl and butyl-parabens were acquired from Sigma-Aldrich (São Paulo, SP, Brazil). The diluted standard solutions of parabens were prepared in methanol from their respective stock solutions, 10.0 mg mL-1. These solutions
were stable for 12 months under storage conditions at
−4 °C. Methanol, acetonitrile, tetrahydrofuran, all with
chromatographic grade, and sodium acetate, were acquired from J. T. Baker (Phillipsburg, NJ, USA). The ultrapure water was purified by Milli-Q (Millipore, São Paulo, Brazil) system. The mobile phase was filtered through a vacuum filtration system (Millipore, São Paulo, Brazil), and degassed in an ultrasound bath. The 4-vinylpyridine, ethylene glycol dimethacrylate, tetraethyl orthosilicate and (3-aminopropyl) trimethoxysilane reagents were acquired from Sigma-Aldrich (São Paulo, SP, Brazil), and the 2,2’-azobisisobutyronitrile from Merck (Darmstadt, Germany). The ammonium hydroxide was acquired from J. T. Baker (Phillipsburg, NJ, USA).
In order to obtain plasma samples for analysis, immediately after the partum, the blood collection in venipuncture was performed, kept in the antecubital fossa, by the right arm from ten women in the Hospital das Clínicas da Faculdade de Medicina de Ribeirão Preto,
University of São Paulo(Ribeirão Preto, SP, Brazil). The
venipuncture of fetal blood was performed in the umbilical cord immediately after handling the placenta. Then the blood samples were centrifuged at 3000 rpm for 10 min,
and the supernatant (plasma) was stored at −20 °C, until the time of analysis.
Methods
The employed LC system was a Varian 230 ProStar (Varian, California, USA) equipment. Signals were monitored at 250 nm by a Varian 310 ProStar UV detector. Separation was performed in an RP 18 LichroCART® column (125 mm × 4 mm × 5 µm particle size-Merck, Darmstadt, Germany), at room temperature (25 °C), using methanol and water (62:38 v/v) as the mobile phase, in the isocratic mode, at a flow rate of 1.0 mL min-1.
The UHPLC-MS/MS system consisted of a Waters ACQUITY UPLC (Waters Corporation, Milford, MA, USA) using an ACQUITY UPLC binary solvent manager and ACQUITY UPLC sample manager, coupled with a Waters XEVO TQD sequential mass spectrometer (tandem quadrupole) with electrospray ionization (ESI). Chromatographic separations were carried out using a Kinetex C18 (100 mm × 2.1 mm × 1.7 µm) (Phenomenex, CA, USA) column at 40 °C, under isocratic conditions with mobile phase composed of acetonitrile:water
(40:60 v/v) at a flow rate of 0.3 mL min-1. Data were
acquired in the MRM (multiple reaction monitoring) mode, with negative ionization. The analytical parameters were as follows: capillary voltage: 3.30 kV, ion source temperature: 150 °C, extractor: 3.0 V, and RF lens: 2.5 V. Nitrogen was used as desolvation gas at a flow-rate
of 1000 L h-1, and at the temperature of 450 °C. Cone
voltage (CV) was set up individually for each analyte (Table 1). The product ions were selected according to the fragmentation pathways in the daughter scan mode. Argon was the collision gas; collision energy (CE) was optimized for each analyte individually (Table 1). Instrument control, peak detection and integration were carried out using MassLynx 4.1 Data System. QuanLynx software was used for data processing and quantitation: regression analysis of standard, matrix calibration curves and calculation of concentrations.
Two specific transitions were optimized for each molecule, to increase the selectivity and reliability of the method. The first transition was used to quantify the analytes; while the second MRM transition was used for qualitative identification.
Syntheses of the molecularly imprinted polymers
For radical polymerization, in a conic vial, following the stoichiometric ratio (1:4:20 v/v/v) among template, functional monomer, and crosslinking agent; 22 mg of benzylparaben (template molecule) was dissolved in acetonitrile (porogen), followed by the addition of 49 µL of the 4-vinylpyridine (functional monomer), and 430 µL of ethylene glycol dimethacrylate (crosslinking agent). This vial was mixed for 10 s and sonicated for 10 min. After this procedure, 16 mg of 2,2’-azobisisobutyronitrile (initiator) was added to the reaction vial, and incubated at 60 °C for 24 h for polymerization. The acetonitrile volume (15, 30, 60 and 90 mL) was also evaluated.
For sol-gel procedure, 12.2 µL of the (3-aminopropyl) trimethoxysilane (APTMS) (precursor), and 500 µL of the benzylparaben solution (5 mg mL-1) were added to the
reaction vial, and mixed for 10 s. After this step, 88.4 µL of
tetraethyl orthosilicate (TEOS) and 25 µL of NH4OH were
also added to the reaction vial. This vial was incubated for 12 h at room temperature (25 °C).
Monoliths obtained in both syntheses procedures were crushed, ground and sieved to obtain particles in the 50 and 100 µm size range. Subsequently, the template was removed from the MIP selective cavities by soxhlet extraction for approximately 72 h, using methanol:ethanol solution (90:10 v/v). The template removal was monitored by liquid chromatography-ultraviolet detector (LC-UV) analysis, until the benzylparaben presence was not observed in the chromatograms.
To evaluate the selectivity of each MIP synthesized, non-imprinted polymers (NIP) were prepared using the same procedure, but omitting the template molecule.
Physical and chemical characterization of the MIPs
The surface morphology analysis of the MIP and NIP polymers were performed on a scanning electron microscope (Zeiss EVO5O) at the Department of Chemistry, FFCLRP, University of São Paulo. Measurements by scanning electron microscopy were carried out with magnitude of 50.00 k× and nominal resolution of 200 nm;
and magnitude of 5.00 k× and nominal resolution of 2 µm. The measurements were made under 20.00 and 5.00 kV.
Infrared analyses were performed on a Fourier transform infrared spectrophotometer (ABB Bomem MB100 series) at Department of Chemistry, FFCLRP, University of São Paulo. The spectra were analyzed in KBr pellet in a range
from 4000 to 400 cm-1 and 200 cumulative scans.
Miniaturized MISPE process
Sterile CA syringe filters RC of 0.20 µm pore size and 4 mm diameter were used as extraction devices for SPE. These SPE devices were packed with 10 mg of the synthesized polymers. Initially, the SPE devices containing the MIP phase were conditioned with 200 µL of methanol and 200 µL of Milli-Q water. Prior to the MISPE procedure, the proteins of plasma samples (200 µL) were precipitated with acetonitrile (400 µL). After the centrifugation, the
supernatant was evaporated under N2 flow, and the dried
extract was reconstituted with 200 µL of the ultrapure water. This extract was percolate through the MIP phase. For the removal of endogenous compounds, 100 µL of the ultrapure water were also percolated through this phase. After this step, parabens were eluted from the MIP with methanol (300 µL). The average flow-rate of the solvents
through the cartridges was 500 µL min-1 (10 mmHg). The
extract was evaporated under N2 flow, and the dried extract
was reconstituted with mobile phase (methanol:water solution, 80:20 v/v). 5 µL of this solution were injected into UHPLC-MS/MS system.
Analytical validation
The MISPE (radical polymerization)/UHPLC-MS/MS method was validated using paraben-free plasma samples (blank plasma samples) spiked with the internal standard (45 ng mL−1) and parabens standard solutions at the plasma
concentrations ranging from 1 to 50 ng mL−1.
The linearity was evaluated by calibration curves constructed by linear regression of the ratio between the
parabens and the internal standard (Y) peak areas versus
the nominal parabens concentrations (X, ng mL−1). The
Table 1. MS/MS transition (MRM), optimal declustering potential (DP), optimal collision energy (CE) and retention time (tR) for the parabens studied. Dwell time = 0.027. *IS: Internal standard (deuterated propylparaben)
Parabens Precursor ion (m/z) Product ion (m/z) DP / V CE / eV tR / min
Methylparaben 151 92/136 35 10/20 1.15
Ethylparaben 165 91.9/136 33 23/14 1.51
Propylparaben 179.0 92/136 30 20/20 2.23
Butylparaben 193 92/136 30 20/20 3.55
linearity of the calibration curve was determined using linear regression analysis. The lower limit of quantification (LLOQ) was defined as the lowest concentration in the calibration curve that could be quantitatively measured with acceptable precision and accuracy (within 20%).
The selectivity of the method was evaluated by comparison of MRM chromatograms of the spiked plasma samples at the LLOQ level with those of the human blank plasma samples. The response of co-eluting interferences should be less than 20% of the response of the analytes and less than 5% of the peak area of the internal standard (IS). Inter-assay accuracy and precision values were determined by replicate (n = 5) analyses (MISPE/UHPLC-MS/MS assays) of the blank samples spiked with the analytes at six different concentrations throughout the linear range. The accuracy was calculated by the relative standard error (RSE), values outside the range of ± 15% of the nominal value were not accepted, except for the limit of quantitation for which values outside the range of ± 20% of the nominal value was not accepted.
During validation, carry-over was assessed by injecting three aliquots of the same blank plasma sample: one before and two after analysis of the plasma sample spiked with analytes at the concentration that corresponded to the upper
limit of quantification (ULOQ: 50 ng mL−1). Carry-over
in the blank sample that evaluated immediately after the ULOQ sample should not be greater than 20% of the analytes signals at LLOQ chromatogram, and not greater than 5% of the internal standard signal (IS).
Matrix effects were investigated using at least five lots of blank matrix from individual donors. Considering each analyte and the IS, the matrix factor (MF) was determined for each lot of matrix, by calculating the ratio between the peak area of the analytes in the presence of matrix (measured by analyzing spiked blank matrix after extraction of the analyte), and the peak area of the analytes in the absence of matrix (pure solution of the analyte). The IS normalized MF was also calculated by dividing the MF of the analyte by the MF of the IS. The CV of the IS-normalized MF calculated from the five lots of matrix should not be greater than 15%. This determination (n = 5) was conducted at low and high concentrations of analytes (3.0 and 40 ng mL−1), respectively.
Results and Discussion
Optimization of the syntheses
For radical polymerization, the functional monomer, 4-vinylpyridine, was selected due to its alkalinity. Acetonitrile (porogenic solvent), which is a polar protic
solvent, was evaluated in different volumes (15, 30, 60 and 90 mL), data not shown. Increasing the acetonitrile volume in reactional medium, the MIP porosity reduces, and consequently, the extraction efficiency, and parabens diffusion decrease.
For sol-gel process,the synthesis of MIP consisted of the hydrolysis and condensation reactions of the alkoxide precursors (APTMS and TEOS) in a basic medium in the
presence of benzylparaben, template molecule. The NH4OH
was used as a catalyst for the sol-gel reaction. Under basic conditions, the condensation of the silanol groups occurs preferably among highly branched oligomers, which generate the gel particles, and then the polymeric materials with high porosity, after drying.22 The addition of
TEOS results in higher network intersection. The choice of APTMS was due to its specific properties, such as hydrophobicity, and reactivity.
For both syntheses, benzylparaben was chosen as a template, because among the evaluated parabens, benzylparaben presents selective cavities with suitable size, shape, and functionality for selective extraction of analogues molecules. Furthermore, benzylparaben has not been used as a preservative in cosmetic products and should not be found in human plasma samples.
Characterization of MIPs
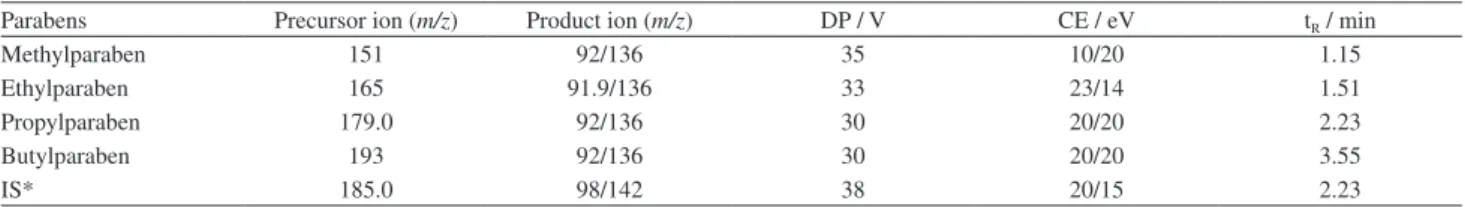
MIP obtained by radical polymerization presented higher porosity and more spherical and homogeneous particles than MIP obtained by sol-gel process (Figure 1). The MIP obtained by sol-gel process resulted in a cluster of non-regular shape of the particles.
The rougher surface of the MIP synthesized by radical polymerization (Figure 1) should be resulted in higher area surface area, and consequently, higher extraction efficiency.
Based on the analysis of the IR spectra, the spectral band at 3439 cm-1 (radical MIP and sol-gel MIP) is related to
the N−H vibrations of symmetric and asymmetric stretch
of the primary amine.
Figure 2 illustrates the absorption bands of C−H bonds at 2936 (Figure 2b) and at 2953 cm-1 (Figure 2a) (relating
to the asymmetric stretching of the CH2 groups). Figure 2b
illustrates the symmetrical angular deformation out of the plane of the grouping NH amine in the region of 795 cm-1.
This band is very sensitive to the formation of hydrogen bonds. The bands present at 1633 (Figure 2b) and at 1602 cm-1 (Figure 2a) are typical binding generated by C
−H functional groups (amino) present in both polymers. It is also possible to allocate the bands in the spectrum radical MIP (Figure 2a) in 1728 (C=O), 1618 (C=C), 1160 and
bands) which are related to the presence of ethylene glycol dimethacrylate (EGDMA) in the MIP.
For MIP via sol-gel, the confirmation of the presence of silicon atoms bonded to the polymer chain can be attributed to the bands in the region of 970 cm-1, corresponding to the
deformation of free silanol groups (Si−OH). It can also be observed the presence of bands in the region of 1094 cm-1,
related to the connection stretching silicates groups (Si−O). The characteristic bands of siloxane bonds are in the region of 469 cm-1.
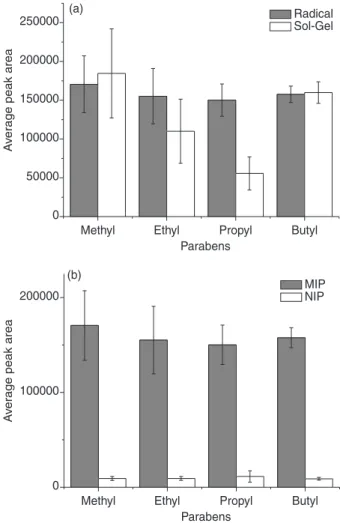
Comparison of extraction efficiency of MIPs obtained
The extraction efficiency (MISPE) of the imprinted polymers (10 mg) obtained by sol-gel process and radical polymerization were evaluated using blank plasma samples
spiked with parabens at concentration of 500 ng mL-1.
The average value of peak areas obtained from the MISPE/LC-UV analysis is illustrated in Figure 3a.
The MIP obtained by radical polymerization presented lower standards deviation, and higher extraction efficiency for ethyl and propyl-parabens than the MIP obtained by sol-gel process (Figure 3a). Furthermore, the MIP synthesized via radical polymerization presented higher imprinting
factors (Table 2). The polymeric non-imprinted material (radical NIP) presented non-specific interactions, and much lower extraction efficiency than radical MIP. These results confirm the selectivity (complementary shape and size) of radical MIP for parabens analysis. Due to the presence of hydroxyl groups on the polymer surface (not encapsulated groups), the MIP synthesized via sol-gel can result in greater number of non-specific interactions.
Selectivity of MIP by radical polymerization
Figure 3b and Table 2 illustrate the selectivity (imprinting factor) of radical MIP that was evaluated using blank plasma samples spiked with parabens
at concentration of 500 ng mL-1 by MISPE/LC-UV
analysis.
Analytical validation
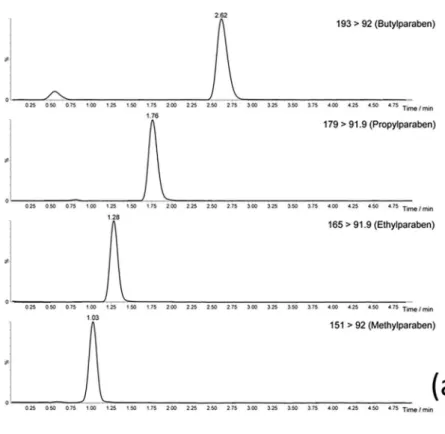
The selectivity of the method can be verified by representative MISPE/UHPLC-MS/MS (MRM mode) chromatograms of a blank plasma sample (Figure 4a) and of a blank plasma sample spiked with the target parabens at a concentration of 1 ng mL−1 (Figure 4b).
The chromatograms evidenced that the method was able to measure the analytes in the presence of endogenous components.
The MISPE/UHPLC-MS/MS method presented a linear
range from the 1 ng mL−1 (LLOQ) up to 50 ng mL−1 with
correlation coefficients greater than 0.993. The calibration standards (1.0, 3.0, 10, 25, 40, and 50 ng mL−1) presented
CV lower than 15%. Table 2 also illustrates the linear regression equations and the corresponding correlation coefficient for all the target parabens.
Accuracy (expressed as relative standard error) of the method ranged from −11 to 14.5%. The inter-assay precision presented coefficient of variation ranging from 1.4 to 12.2% for all the analytes (Table 3). The MISPE procedure was performed manually, and this fact justified these results. Carry-over in the blank sample, after the analysis of ULOQ sample, was not greater than 20% of the analytes signals at LLOQ chromatogram, and not greater than 5% of the IS signal.
The CV of the IS-normalized MF (matrix effects) was not greater than 15% (Table 3).
Figure 2. FTIR (KBr) spectrum of compound (a) radical MIP; and (b) via sol-gel process.
Methyl Ethyl Propyl Butyl 0
50000 100000 150000 200000 250000
A
v
erage peak area
A
v
erage peak area
Parabens
Radical Sol-Gel (a)
Methyl Ethyl Propyl Butyl 0
100000 200000
Parabens
MIP NIP (b)
Figure 3. (a) Extraction efficiency (MISPE/LC-UV, n = 3) from polymers obtained by radical polymerization and sol-gel process and (b) extraction efficiency (MISPE/LC-UV, n = 3) from MIP and NIP obtained by radical polymerization.
Table 2. Imprinting factor of radical MIP (MISPE/LC-UV analysis), and linearity of the MISPE/LC-MS/MS method
Analyte Imprinting factor
(area MIP/ aea NIP)
Regression equation linear range
(LLOQ: 50 ng mL−1) r2
Methylparaben 30.21 y = 0.173x – 0.069 0.9952
Ethylparaben 26.05 y = 0.084x – 0.038 0.9930
Propylparaben 17.71 y = 0.152x – 0.026 0.9938
Figure 4. Representative MISPE/UHPLC-MS/MS (MRM) chromatograms of the (a) blank plasma spiked with parabens at LLOQ level (1.0 ng mL−1); and (b) blank plasma sample.
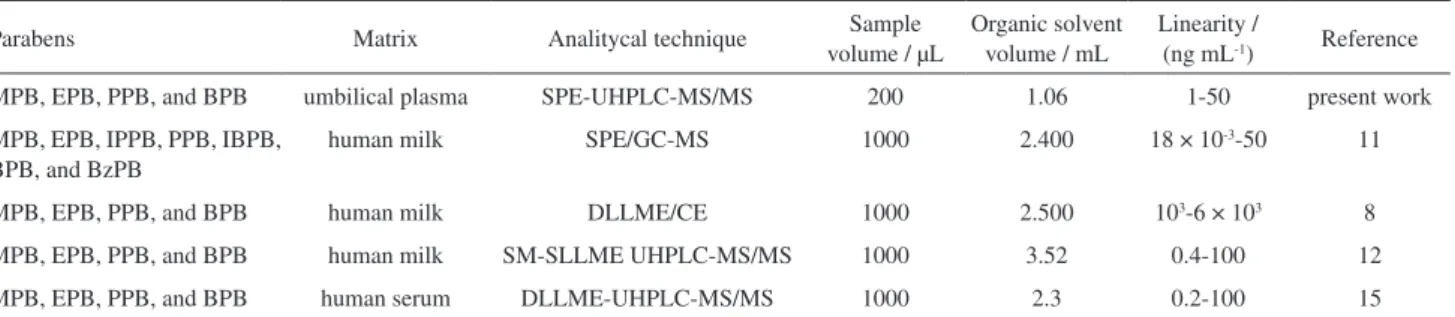
The developed MISPE/UHPLC-MS/MS method was compared with other recent reported methods for the determination of parabens in biological samples, Table 4. The main advantages of this method (MISPE/UHPLC-MS/MS) are the selectivity of the MISPE stationary phase, the reuse
Analyses of human umbilical plasma samples from postpartum women
The effectiveness of the MISPE-UHPLC-MS/MS method for parabens determination in plasma samples was evaluated by analyzing umbilical plasma samples from postpartum women (n = 10). According to the results from the MISPE/UHPLC–MS/MS analyses, parabens were not present at concentrations higher than the LLOQ value.
Table 3. LOD, LLOQ, inter-assay precision (coefficient of variation, CV), inter-assay accuracy (relative standard error, RSE), and matrix factor (MF) of the MISPE(MIP)/UHPLC-MS/MS method for the determination of parabens in plasma samples
Analyte LOD / (ng mL-1) LLOQ / (ng mL-1) Precision (%CV) n = 5
Accuracy (%RSE) n = 5
MF (%CV) n = 3
Methylparaben 0.1 1.0
4.1 1.4
6.3 −7.1 4.7
1.4 −3.0
6.0 8.3
3.3 −5.1 8.8
5.7 4.6
Ethylparaben 0.1 1.0
5.3 −8.1
7.6 −7.5 11.4
9.1 −8.2
9.1 7.8
9.6 −10.3 8.0
2.7 4.9
Propylparaben 0.2 1.0
8.5 9.2
10.7 −11.0 7.5
2.3 1.0
2.5 −2.4
7.6 10.4 6.2
2.9 −0.7
Butylparaben 0.2 1.0
11.0 −8.3
12.2 14.5 13.3
6.1 9.3
6.7 −8.9
5.6 6.5 9.6
2.9 0.1
LOD: Limit of detection; LLOQ: lower limit of quantification.
Table 4. Comparison of present method with other methods for the determination of parabens in biological samples
Parabens Matrix Analitycal technique Sample
volume / µL
Organic solvent volume / mL
Linearity /
(ng mL-1) Reference
MPB, EPB, PPB, and BPB umbilical plasma SPE-UHPLC-MS/MS 200 1.06 1-50 present work
MPB, EPB, IPPB, PPB, IBPB, BPB, and BzPB
human milk SPE/GC-MS 1000 2.400 18 × 10-3-50 11
MPB, EPB, PPB, and BPB human milk DLLME/CE 1000 2.500 103-6 × 10³ 8
MPB, EPB, PPB, and BPB human milk SM-SLLME UHPLC-MS/MS 1000 3.52 0.4-100 12
MPB, EPB, PPB, and BPB human serum DLLME-UHPLC-MS/MS 1000 2.3 0.2-100 15
MPB: Methylparaben; EPB: ethylparaben; PPB: propylparaben; BPB: butylparaben; IPPB: isopropylparaben; IBPB: isobutylparaben; BzPB: benzylparaben; SPE: solid phase extraction; GC: gas chromatography; DLLME: dispersive liquid-liquid microextraction; SM-SLLME: stir-membrane solid-liquid-liquid microextraction; CE: capillary electrophoresis.
Conclusion
In this work, new MIPs phases were synthesized by radical polymerization and by sol-gel process for the analysis of the target parabens in plasma samples by MISPE/UHPLC-MS/MS.
sol-gel process. Furthermore, the MIP synthesized via radical polymerization presented higher imprinting factor. The polymeric non-imprinted material (radical NIP) presented non-specific interactions, and much lower extraction efficiency than radical MIP. These results confirm the selectivity (complementary shape and size) of radical MIP for parabens analysis.
The optimization of the MISPE process favored not only the analytical method sensitivity, but also reduced the number of non-specific interaction with the printed material. The miniaturized MISPE, compared with SPE conventional, reduced the amount of MIP phase (10 mg), minimized the organic solvent, and allowed the reusese of the extraction phase.
According to the parameters of the analytical validation, the miniaturized MISPE/UHPLC-MS/MS method is suitable for analysis of parabens in human plasma samples. The applicability of this method was demonstrated by the umbilical plasma sample analyzes from postpartum women that did not presented the target parabens in concentrations above the LLOQ values established.
Acknowledgments
The authors acknowledge financial support from FAPESP (No. 12/21178-0) and Conselho Nacional de Desenvolvimento Científico e Tecnológico (CNPq).
References
1. Soni, M. G.; Carabin, I. G.; Burdock, G. A.; Food Chem. Toxicol.
2005, 43, 985.
2. Darbre, P. D.; Harvey, P. W.; J. Appl. Toxicol. 2008, 28, 561. 3. Darbre, P. D.; Aljarrah, A.; Miller, W. R.; Coldham, N. G.;
Sauer, M. J.; Pope, G. S.; J. Appl. Toxicol. 2004, 24, 5. 4. Frederiksen, H.; Jorgensen, N.; Andersson, A.; J. Exposure Sci.
Environ. Epidemiol. 2011, 21, 262.
5. Zhao, Y.; Liu, G.; Shen, H.; Shen, J.; Aubry, A. F.; Sivaraman; L.; Arnold M. E. ; J. Chromatogr. B: Anal. Technol. Biomed. Life Sci. 2014, 947, 68.
6. Melo, L. P.; Queiroz, M. E. C.; Anal. Methods 2013, 5, 3538.
7. Hines, E. P.; Mendola, P.; Ehrenstein, O. S.; Ye, X.; Calafat, A. M.; Fenton, S. E.; Reprod. Toxicol. 2015, 54, 120. 8. Alshana, U.; Ertas, N.; Goger, N. G.; Food Chem. 2015,
181, 1.
9. Gómez, R. R.; Pijuán, M. R.; Lucena, R.; Cárdenas, S.; Gómez, A. Z.; Ballesteros, O.; Navalón, A.; Valcárcel, M.;
J. Chromatogr.A 2014, 1354, 26.
10. Sajid, M.; Basheer, C.; Narasimhan, K.; Choolani, M.; Lee, H. K.; J. Chromatogr. B: Anal. Technol. Biomed. Life Sci. 2015,
1000, 192.
11. Azzouz, A.; Rascón, A. J.; Ballesteros, E.; J. Pharm. Biomed. Anal. 2016, 119, 16.
12. Jardim, V. C.; Melo, L. P.; Domingues, D. S.; Queiroz, M. E. C.; J. Chromatogr. B: Anal. Technol. Biomed. Life Sci. 2015,
974, 35.
13. Hines, E. P.; Mendola, P.; Ehrenstein, O. S.; Ye, X.; Calafat, A. M.; Fenton, S. E.; Reprod. Toxicol. 2015, 54, 120.
14. Navarro, M. V.; Carballo, M. C. M.; Torres, R. F.; Mochón, M. C.; López, M. A. B.; Anal. Bioanal. Chem. 2016, 408, 1615. 15. Soria, F. V.; Ballesteros, O.; Rodríguez, I.; Gómez, A. Z.;
Ballesteros, L.; Cela, R.; Navalón, A.; Anal. Bioanal. Chem.
2013, 405, 7259.
16. Mayes, A. G.; Whiticombe, M. J.; Adv. Drug Delivery Rev.
2005, 57, 1742.
17. Yan, H.; Ho Row, K.; Int. J. Mol. Sci. 2006, 7, 155.
18. Du, B.; Qu, T.; Chen, Z.; Cao, X.; Han, S.; Shen, G.; Wang, L.;
Talanta 2014, 129, 465.
19. Cormack, P. A. G.; Harun, N; Anderson, R. A.; Anal. Bioanal. Chem. 2010, 39, 2449.
20. Clausen, D. N; Visentainer, J. V.; Tarley, C. R. T.; Analyst 2014, 139, 19, 5021.
21. Ferrer, I.; Lanza, F.; Tolokan, A.; Horvath, V.; Sellergren, B.; Horvai, G.; Barceló, D.; Anal. Chem. 2000, 72, 3934. 22. Pilau, E. J.; Silva, R. G.; Jardim, I. C. S. F.; Augusto, F.; J. Braz.
Chem. Soc. 2008, 19, 1136.
Submitted: February 29, 2016 Published online: June 3, 2016