211 PRODUCTION SYSTEM OF SOYBEAN FARMS IN THE SOUTHWEST OF PARANÁ,
BRAZIL
Thomas Newton Martin 1, Glauber Monçon Fipke 2, Paulo Sérgio Pavinato 3, Lindolfo Storck 4
1Federal University of Santa Maria. E-mail: martin.ufsm@gmail.com 2Federal University of Pampa. E-mail: gm.fipke@hotmail.com 3University of São Paulo – ESALQ/USP. E-mail: pavinato@usp.br
4Federal Technological University of Paraná -UTFPR. E-mail: lindolfostorck@gmail.com
ABSTRACT
This study aimed at characterizing the production system of the soybean crop in Southwestern Paraná, Brazil to subsidize research and development programs. The study was conducted by applying a questionnaire to 446 farms in three consecutive agricultural years (2008 to 2010). The information requested concerned the characterization of the farm, crop management, destination of production, and the perspectives of farmers. Data were grouped by class and estimated the position and dispersion statistics. Soybean production in the Southwest Paraná is based on small farms, with average cultivation area ranging from 19 to 23 ha, using certified seed, and 55% using inoculation at soybean seeds. Soybean grain yield in the region is above 3,000 kg ha-1 in years without drought. Among the practices that can be implemented include the inoculation, control of pests, diseases, and weeds.
Keywords: Glycine max, limitations, management, tillage, yield
SISTEMA PRODUTIVO DA SOJICULTURA NO SUDOESTE DO PARANÁ, BRASIL
RESUMO
Objetivou-se com esse trabalho caracterizar o sistema produtivo da cultura da soja no Sudoeste do Paraná, para subsidiar programas de pesquisa e desenvolvimento agrícola. O estudo foi realizado com a aplicação de um questionário a 446 propriedades rurais em três safras consecutivas (2008 à 2010). As informações solicitadas referiam-se a caracterização da propriedade, manejo da cultura, destino da produção e as perspectivas dos produtores. Os dados foram agrupados por classes e estimou-se as estatísticas de posição e de dispersão. A produção de soja na região Sudoeste do Paraná está baseada em pequenas propriedades rurais, com área de
212
cultivo média variando de 19 á 23 ha, uso de sementes certificadas e inoculadas em 55% das propriedades. A produtividade de grãos na região está acima de 3.000 kg ha-1 nos anos sem seca. Dentre as práticas de manejo que podem ser implementadas destacam-se a inoculação, controle de pragas, doenças e plantas daninhas.
Palavras-chave: Glycine max, limitações, manejo, cultivo, produção
INTRODUCTION
In the last decades (1995-2015), the State of Paraná, Brazil, presented an economic performance above the national average. Contrary to economic theories, this performance has strong participation of the agricultural sector by the intensive use of technology. It should be considered that soybean cultivation was introduced in the Southwestern region of Paraná by southern immigrants in the 1950s gaining socioeconomic importance and helping in the formation of regional society. Moreover, over the years, soybean has been a vector of changes in social, economic and technical relations in the region.
The State of Paraná has a very diversified agricultural agenda, with emphasis on soybeans. With a total production of 17.2 million tons in 5.2 million hectares, Paraná presented an average yield of 3,294 kg ha-1 in the 2014/2015 harvest (CONAB, 2015). In addition to direct participation, soybean cultivation promotes extremely dynamic industrial complexes both downstream and upstream of the farm, improve to importance for the economy of Paraná (IBGE, 2011).
The soybean produced in Paraná has significant variations in grain yield, a fact that can be explained by distinct environmental and/or socioeconomic conditions in the State territory. It is observed, for example, that the Southwest region of Paraná presented in the 2009/2010 harvest a lower average grain yield (2,099 kg ha-1) in the north of the State (2,260 kg ha-1), a region with similar conditions (unpublished data). The preferential period for sowing corresponds to the month of November, but the region has favorable agroclimatic zoning between October 15th to December 15th (MAPA, 2016). Early sowing is practiced in warmer regions of the State, where there is humid winter, high fertility soils, and temperatures favorable to the emergence of plants since the beginning of October. These conditions are more common in the western region of Paraná, in the areas of lower altitude, closer to the Paraná River, located between the Piquiri and Iguaçu Rivers (ALBRECHT et al., 2008).
213 Some factors that may influence soybean cultivation are water availability, poor control of pests, diseases and weeds, as well as soil fertility and productive potential of the cultivar (SANDINI & FANCELLI, 2000). Other factors that also influence is socioeconomic, such as the landing module, the technical assistance and the regional infrastructure, among other conditions, that favor the dynamism of the activity and the generation of innovations (SANTOS, 2011).
The objective of this work was to characterize the productive system of the soybean crop in the southwest of Paraná, to subsidize research and development programs, as well as to contextualize the changes based on the inferences obtained in the evaluated properties.
MATERIAL AND METHODS
The present study was carried out with the application of a questionnaire to 446 farms located in the Southwest of Paraná and some counties in neighboring regions (Table 1), in three consecutive agricultural years (2008, 2009 and 2010). Each farm was sampled only once in the assessed period.
The interviews were conducted prior to the soybean harvest in each of the years. The territorial area covered by the survey was 1,036,526 ha. The climate of the region is classified as Cfa (Humid Subtropical Climate), with an average of the hottest month exceeding 22ºC and, in the coldest month, below 18ºC, with no defined dry season, hot summer and less frequently frosts) according to the classification of Köppen (PEEL et al., 2007).
The questionnaire focused on the identification of the area of use of each farm with the soybean crop. In the sequence, the productive system of each farm was characterized, emphasizing the management of the crop and the inputs used, as well as the perspectives of the soybean producers. The information requested referred to: 1) area of the farm; 2) area of soybean production; 3) seed origin; 4) use of inoculant in the seeds; 5) use of transgenic cultivars; 6) use of fungicides; 7) weed control; 8) most frequent diseases; 9) diseases of most difficult control; 10) other agricultural activities that it performs on the property; 11) destination of soybean production; 12) presence of technical assistance; 12) origin of technical assistance; 13) average production of the farm; 14) farmers interest in training courses; 15) relation of possession with the field area; 16) cultivation system used; 17) major inscts pests; 18) major weeds; 19) row spacing; and 20) growth cycle of the cultivars.
214
Table 1. Number of rural properties evaluated (NRPE); total population (POP), area (AREA), total soybean production (TSP), average yield (AY) and area of cultivation (AC) in each county*.
Counties* NRPE POP AREA TSP AY AC
2008 2009 2010 (mil) (km²) (tonne) (tonne ha-1) (mil ha)
Bela Vista da Caroba 6 3 0 3.9 148,107 5.4 1.800 3
Boa Esperança Iguaçu 6 10 15 2.8 151,986 4.6 1.955 2.3 Bom Sucesso do Sul 0 3 6 3.3 195,867 25.6 2.491 10.3
Capanema 0 14 27 18.5 418,705 38.4 2.400 16 Cascavel 1 1 0 286.2 2,100,105 214.2 2.550 84 Catanduvas 0 2 3 10.2 581,754 43.7 3.080 14.2 Chopinzinho 0 1 1 19.7 959,692 68.8 2.775 24.8 Coronel Vivida 2 1 0 21.7 684,417 67.7 2.462 27.5 Cruzeiro do Iguaçu 5 5 5 4.3 161,493 4.2 1.750 2..4 Dois Vizinhos 37 32 30 36.2 418,320 32.4 2.025 16 Francisco Beltrão 1 1 0 78.8 35,266 26.4 2.237 11.8 Guaraniaçu 1 1 0 14.5 1,225,607 37.21 2.331 15.9 Guarapuava 0 1 1 167.5 3,115,329 124.4 2.498 49.8 Ibema 4 2 0 6.1 145,442 13.3 3.000 4.4 Marmeleiro 11 5 0 13.9 387,680 30.1 2.369 12.7
Nova Esp. Sudoeste 1 1 0 5.1 208,472 3.7 2.500 1.5
Nova Laranjeiras 5 5 5 11.2 1,145,485 13.7 2.490 5.5 Nova Prata do Iguaçu 5 3 1 10.4 352,565 25.2 2.297 10.9
Peróla D'Oeste 25 17 0 6.8 206,048 14.6 1.800 8.1 Planalto 1 1 0 13.7 345,740 29.7 2.479 12 Porto Barreiro 5 3 0 3.6 361,982 20.2 2.593 7.70 Quedas do Iguaçu 0 3 5 30.6 821,503 30.6 2.094 14.6 Realeza 8 4 0 16.3 353,415 14.0 2.250 14 Salto do Lontra 11 5 0 13.7 313,290 18.2 2.427 7.5 Santa Izabel d'Oeste 7 8 10 13.1 321,169 22.2 1.876 11.8
São João 0 5 4 10.6 388,060 52.9 2.607 20.3
Sao Jorge do Oeste 0 6 13 9.1 379,047 13.8 1.594 8.6
Saudades do Iguaçu 0 0 1 5.0 152,084 4.9 2.000 2.5
Sto. Antônio Sudoeste 3 4 5 18.9 325,672 17.2 1.792 9.6
Verê 0 7 15 7.9 312,418 19.1 1.893 10.1
215 *Source: IBGE (2011a), IBGE (2011b), PNUD (2011), IPARDES (2010), IBGE (2002).
The responses were tabulated creating a database in the Excel® application. From this, each questionnaire question was treated in a simple way, classifying (mean, minimum and maximum) and dispersion statistics (standard deviation, variance and coefficient of variation).
RESULTS AND DISCUSSION
The total area of soybean producing farms in the Southwest of Paraná varies from 38.6 to 47.4 ha (Table 2). As the introduction of soybean cultivation was carried out from the 50's, due to the arrival of southern imigrants, there were changes in the land structures of the place as well as valorization of the agricultural areas. Thus, over the years there has been a change in the social, economic and technical relations caused by the introduction of soybean cultivation in the region.
The difference in the size of the year-to-year farms are due to random sampling among the properties that grow soybean, and therefore, there is no replacement in the number of properties. The average size of the areas with soybean varies from 19.4 to 23 ha, that is, approximately half of the total area of the farms is destined for this purpose. In this sense, there is a great variability in the size of the farms and in the soybean growing areas. In addition, most properties have less than 500 ha, with a maximum of 470 ha and a minimum of 2.5 ha. Thus, it is verified that only two farms evaluated have more than 200 ha, conferring a characterization of small family farms.
It was observed that in the first two years, 90% of the farms had up to 50 ha, however, in the last year of research (2010), the same percentage of farms was only reached when the area was enlarged to 100 ha. However, the highest frequency of farms (total area) is up to 10 ha. In the last year presented the highest frequency of properties in areas of 10 to 20 ha. For the cultivation area, the highest frequency of farms was verified between 10 and 20 ha, now except for the first year (2008). This characterization indicates that the farms that own the soybean as one of the cultures within its productive system are, in general, small properties, with restricted areas of cultivation.
Soybean farmers in the Southwestern region of Paraná use (> 86%) seeds purchased from certified farms, which may correspond to genetic, physical, physiological and phytosanitary quality (Table 3). Thus, farmers are aware that it is necessary to use superior genotypes with high productive potential to obtain better yields.
216
Table 2. Area of cultivation (AC, ha) and total area of properties (TA, ha) and position and dispersion statistics and frequency table, number of properties with area smaller than given size and number of properties with area within certain Limits.
Statistic 2008 2009 2010 General AC TA AC TA AC TA AC TA Average 19,4 38,6 23,9 47,4 23,1 42,4 22,1 42,8 Minimum 0,5 2,5 1,0 4,0 2,0 4,8 1,2 3,8 Maximum 266,0 338,0 270,0 470,0 240,0 320,0 258,7 376,0 Standart deviation 35,1 54,1 42,2 68,1 28,6 46,3 35,3 56,1 Coefficient of variation 180,7 140,1 176,4 143,7 124,1 109,3 160,4 131,0 <10 ha 80 16 69 13 51 7 200 36 <20 112 66 110 53 96 48 318 167 <30 122 96 122 89 115 79 359 264 <50 136 120 136 117 127 110 399 347 <100 142 136 144 135 144 134 430 405 <150 144 140 146 143 146 141 436 424 <200 144 141 147 146 146 144 437 431 <500 (Total) 146 146 151 152 147 147 444 445 0-10 ha 80 16 69 69 13 7 162 92 10-20 32 50 41 41 40 41 113 132 20-30 10 30 12 12 36 31 58 73 30-50 14 24 14 14 28 31 56 69 50-100 6 16 8 8 18 24 32 48 100-150 2 4 2 2 8 7 12 13 150-200 0 1 1 1 3 3 4 5 200-500 2 5 4 4 6 3 12 12
However, there is a share of up to 10% of farmers who produce their own seed, but the important thing is that this percentage has gradually declined over the three years evaluated. The use of certified seeds by the producers means that there is an increase in the total cost of the crop of approximately 10% for the 2010/2011 crop year (AGRIANUAL, 2010); however, the benefits attributed to the use of certified seeds are much higher than the referred to above.
217 Table 3. Origin of soybean seeds used by rural producers in the Southwest of Paraná, the number
of farmers (NF) and percentage of seed utilization (%).
Origin of soybean seeds 2008 2009 2010 General NP
NF % NF % NF % %
Own production 15 10.3 12 7.8 7 4.8 11.3 7.6
Farm shop - certified 125 86.3 139 90.3 132 89.8 132.0 88.8
Farm shop – no certified 0 0.0 1 0.6 5 3.4 2.0 1.3
Bought / won 4 2.8 1 0.6 2 1.4 2.3 1.6
Swapped with the neighbor 1 0.7 1 0.6 1 0.7 1.0 0.7
Total 145 100 154 100 147 100 148.6 100
Management action 2008 2009 2010 General
Yes No Yes No Yes No % Yes
Use of inoculants 55.2 44.8 52 48 56.5 43.5 54.5
They answered (Total) 143 154 147 148
Use of transgenic cultivars 81.2 18.8 96 4 89.8 10.2 89
They answered (Total) 144 151 147 147.3
Use of fungicide 61.1 38.8 56.7 43.2 55.6 44.3 57.8
They answered (Total) 144 148 142 144.6
Weed control 91.7 8.2 94.1 5.88 93.1 6.81 93.0
They answered (Total) 145 153 147 148.3
When considering the historical series from 1976 to 2010, it is verified that soybean yield increases about 32 kg ha-1 on average for the State of Paraná and 36 kg ha-1 on the Brazilian level (CONAB, 2011). This evolution in average productivity was due to the genetic improvement of soybean cultivars and the management used in the crops, with better fertilization and better control of pests, diseases and weeds.
In the interviewed properties, the sowing is done more frequently to 45 cm (62.9%) and 40 cm (28.4%) between rows, with the other spacings varying over 45 cm. Spacings between rows smaller than 40 cm were not evidenced in this study (DALLEY et al., 2004) and the reduction of soil, water loss through evaporation (CALISKAN et al., 2007). However, this reduction practice is not included in the recommendation guides for the crop and is not a reality in the Southwestern
218
region of Paraná due to the fact that the producers have not used the recommended fertilizer dose, which can reduce the productivity of the crop in smaller row spacing.
About the growth cycle of the cultivars, the preference for genotypes of the medium cycle (69.3%) was verified, followed by short cycle (17.3%) and long cycle (13.3%). The preference for medium cycle is due to the greater productive potential in relation to the short cycle cultivars. Long-cycle cultivars are deferred due to the use of many areas for the second harvest, or for early wheat cultivation in the winter, which causes the need for early soybean harvesting.
As far as the cultivation system used, no-tillage sowing is almost constant and unanimous, with 95.7% of the crops using this technique, 2.9% using conventional tillage and 1.4% minimum cultivation. The no-tillage sowing system is used due to its characteristics favorable to the development of the crop, such as the reduction of costs due to the practices of soil preparation, maintenance of soil moisture for a longer period, better soil conservation, among other advantages. Derpsch et al. (1991) indicate that the no-tillage system provided increases in grain yield of 19 and 35% relative to conventional tillage in wheat and soybean crops, respectively. This can be caused by a number of factors, such as the emergence speed of soybeans, which is higher in direct seeding compared to conventional seeding, maintenance of humidity, lower losses of soil and nutrients with rains, among others (LIMA et al., 2010).
Although there are several studies in the literature indicating the efficiency of the use of inoculants in the soybean crop, this management practice was used in little more than 50% of the properties. The inoculation practice increases the grain yield of the crop by an average of 4.5% (HUNGRIA et al., 2006a), associated to fungides and micronutrients in the treatment of seeds, in the first year of cultivation, thus increasing soybean nodulation (VIEIRA NETO et al., 2008).
The present results on inoculation indicate that the advantages in relation to this practice have not been widely disseminated so far in the region, and practically half of the producers still do not use it (Table 3). One of the hypotheses of this fact can be justified because the bacterium is present in the soils due to the intensification of soybean cultivation, thus occurring the symbiosis with native bacteria in the soil itself. It should be noted that such bacteria do not have the same efficiency as those given commercially for inoculation, they are selected for such characteristics (HUNGRIA et al., 2006b).
According to Miyamoto (2007), the area cultivated with transgenic soybeans, at the Brazilian level, for the 2007/2008 harvest was 40%. However, there is an annual increase in
219 cultivated areas with this technology. In the present study, it was verified that 81.6 to 96% of the producers used transgenic soybean seeds in the three evaluated years (Table 3), being therefore widely used by the producers. This is one of the technologies that can be used to control weeds, which as a rule is a problem for the production of Brazilian and Paraná soybeans. Despite the intense cultivation of RR soybeans (Roudup Ready®, resistant to glyphosate), the cost of production (per bag produced) of conventional soybeans is lower than that of transgenic soybeans (FURLANETO et al., 2008). A hypothesis for the production of transgenic soybeans should be related to the incidence and control of weeds.
In terms of diseases, between 55 and 61% of the farmers carry out the application of fungicides to control them. According to the farmers, the most frequent disease among the three mentioned was “soybean rust” (Phakopsora pachyrhizi), however interesting information is that a significative of the farms interviewed (Table 4). In the case of the most difficult control, “soybean rust” was the main one reported in 71% of the farmes interviewed (Table 4). In this situation there is an important point that should be highlighted, since the incidence of diseases in soybean is, in general, very great, as well as its potential to reduce yield. When considering leaf diseases caused by fungi, these can reduce yield, but when considering specifically “soybean rust”, losses can reach 75% of production (YORINORI, 2002). Perhaps farmers misunderstanding of disease identification may have contributed to many failing to make the proper applications of pesticides.
Table 4. Percentage of the most frequent diseases (MFD) and more difficult to control (MDC).
Soybean rost1 Powdery mildew 1 Mildew1 No one Number of respondents
2008 MFD 48.9 13.1 0.0 37.9 145 MDC 71.0 4.8 0.0 24.1 145 2009 MFD 29.9 17.5 0.6 51.9 154 MDC 42.9 3.9 0.6 52.6 154 2010 MFD 33.3 2.0 1.4 63.3 147 MDC 51.0 1.4 0.7 46.9 147 Geral MFD 37.4 10.9 0.7 51.0 148
220
MDC 54.9 3.4 0.4 41.2 148
1 soybean rost (Phakopsora pachyrhizi), powdery mildew (Microsphaera diffusa), mildew (Peronospora manshurica). Regarding the labor force verified in the farms, for the years 2008 and 2009 more than 80% had its origin in the family itself. However, as mentioned previously, the properties evaluated in 2010 are larger, with a smaller participation of family labor (69.38%), being larger in extension and in cultivated area. In this case, the participation of hiring labor is considered natural, due to the extensions of the properties. The hiring of day laborers occurs exporadically, and can reach up to 3% of the properties. According to Martin et al. (2011), for maize, the use of family labor in the Southwestern region of Paraná is the majority, and these rural properties represent between 76 and 78%.
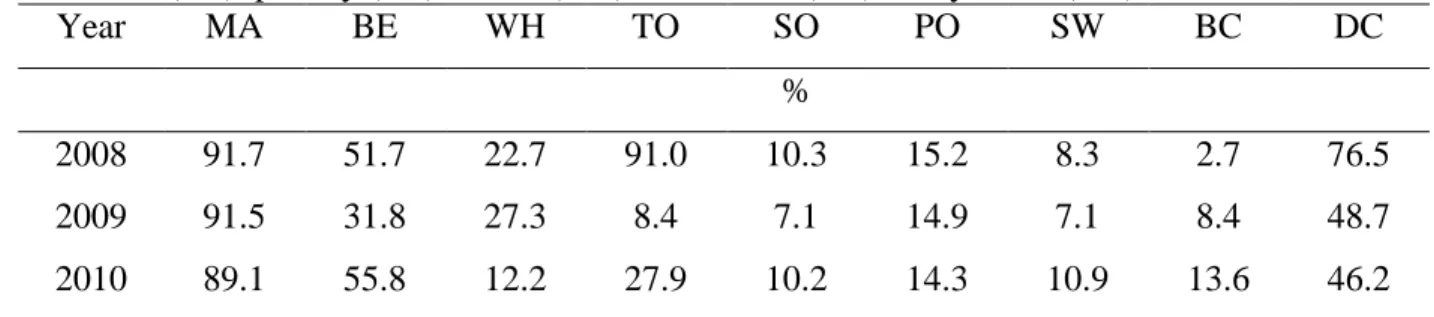
Regarding the relation of possession of the farms, it is verified that the soybean is cultivated in own land in 81 to 91% of the properties, depending on the year evaluated. The lease occurs only between 9 and 19% of the properties, with a higher frequency in the year 2010. Among the complementary activities carried out on the evaluated farms, it is verified that the maize crop is one of the most used, arriving to be present in more than 89% of the farms interviewed (Table 5). Smoke has high concomitants in the first year, being considered that the presence of tobacco in the farms is related to the property characteristics of the farms (small and family labor), in addition to the remuneration that the tobacco companies make available for the culture, which turn out to be more attractive than other crops that require more investment in machinery. In addition, there is intensive technical assistance for this crop, which is supplied by the industries under contract, and they are responsible for the purchase of the production. However, the annual variation in tobacco use is also due to the fluctuation of prices offered by the industry, which varies greatly from year to year.
Table 5. Percentage of complementary agricultural activities on the property (in addition to soybean cultivation): maize (MA), beans (BE), wheat (WH), tobacco (TO), sorghum (SO), poultry (PO), swine (SW), beef cattle (BC), dairy cattle (DC).
Year MA BE WH TO SO PO SW BC DC
%
2008 91.7 51.7 22.7 91.0 10.3 15.2 8.3 2.7 76.5
2009 91.5 31.8 27.3 8.4 7.1 14.9 7.1 8.4 48.7
221
General 90.8 46.4 20.7 42.4 9.2 14.8 8.8 8.3 57.2
For livestock production, dairy cattle are present in at least 46% of farms, especially the first year that surpassed 76% of the evaluated farms. Poultry is present at around 14% of farms and lower values are verified for pig farms and beef cattle. This is certainly one of the most promising regions for milk and poultry cattle production, requiring a considerable amount of soybean and corn for production in this way. However, such soybeans and corn are minced by the region's feed industries, which make it feed for animals.
Among the most difficult to control pests are the bugs, with 38.5% and the caterpillars, with 23.6%. However, 73.6% carried out applications for insect control and the rest did not. As for weeds, Ipomoea sp. (51.7%), Euphorbia heterophylla (23.6%), Conyza sp. (17.1%) are outstanding the most important and most difficult to control. Lazaroto et al. (2008) highlighted the reduction of yield, which could reach 83% when the infestation is very high. All species have already shown some resistance to glyphosate herbicide, which is widely used in crops with transgenic soybean (TREZZI et al., 2011; VARGAS et al., 2013). The cost of production related to weed control ranges from 17 to 40% of the variable cost. However, currently it is considered between 17 to 27% for conventional soybean, and 8 to 12% for cultivars with RR technology (AGRIANUAL, 2010).
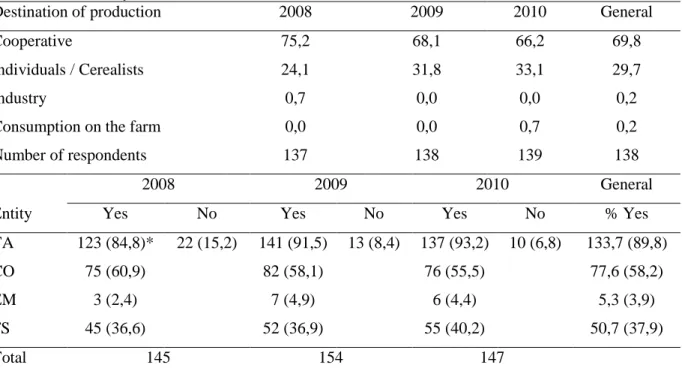
From the data presented in Table 6, it can be seen that the majority of farmers gives soybean production to the cooperatives (more than 66%), and as a second option for individuals or cereal farmers. However, for the maize crop, this trend is not verified (Southwestern Paraná), because the maize is consumed in the own farms by the characteristics of exploitation of them, varying from 28 to 42% (MARTIN et al., 2011).
The participation of cooperatives in soybean production in the Southwestern region of Paraná is quite intense, as verified by technical assistance received (Table 6). More than 89% of farmers use technical assistance to improve their production rates. This technical assistance comes from a large part of the cooperatives (58%), to which these farmers are cooperating. Another large portion of the technical assistance is allocated to the farm shop, who present technical assistance within a technology package for the sale of inputs. However, educational institutions do not provide (mostly) direct technical assistance to farmers, but work in the training of technicians, agronomists, zootechnicians and veterinarians, who will work in technical assistance. In addition, they will be staffed by private companies and Emater, which will contribute to the technical assistance related
222
to soybean cultivation in the region. More efforts at national levels should be made possible to strengthen these two entities, aiming particularly at improving the quality of information available to farmers through extension actions. However, public companies, mainly universities, act directly in the training of human resources that are working in the private sector. Thus, the effective participation of universities in the technical orientation of these properties is emphasized.
Table 6. Destination of soybean production in the Southwest of Paraná and a number of producers assisted by technicians in different entities.
Destination of production 2008 2009 2010 General
Cooperative 75,2 68,1 66,2 69,8
Individuals / Cerealists 24,1 31,8 33,1 29,7
Industry 0,7 0,0 0,0 0,2
Consumption on the farm 0,0 0,0 0,7 0,2
Number of respondents 137 138 139 138
2008 2009 2010 General
Entity Yes No Yes No Yes No % Yes
TA 123 (84,8)* 22 (15,2) 141 (91,5) 13 (8,4) 137 (93,2) 10 (6,8) 133,7 (89,8)
CO 75 (60,9) 82 (58,1) 76 (55,5) 77,6 (58,2)
EM 3 (2,4) 7 (4,9) 6 (4,4) 5,3 (3,9)
FS 45 (36,6) 52 (36,9) 55 (40,2) 50,7 (37,9)
Total 145 154 147
* represents the percentage in relation to the total value, technical assistance (TA), cooperative (CO), Emater (EM), Farm shop (FS).
The average productivity of the soybean crop in the three years was 2,666 kg ha-1 (44.4 sc ha-1), but considering only the first and third year, it is verified that these production arrived to approximately 3,100 kg ha-1, with a lower value in the second year (1,923 kg ha-1). This variability was due to contrasting climatic conditions in this second year, as well as different management practices used in the soybean crop. In this sense, it can be seen that the farmers seem satisfied with the average yield obtained. If we consider the average of Paraná soybean yield (2001-2010), it is verified that the average obtained in the farms interviewed in this second year was lower than the State average (2,774 kg ha-1) (CONAB, 2011).
When asked if there is interest in conducting a training course that involves soybean cultivation, between 50 and 60% of respondents indicate that they are not interested. This should
223 be viewed with concern, as farmers with relatively small areas, with no productive capital and with no productive interest in training courses, may be potential migrants to the cities, characterizing the exodus of agricultural and livestock farms. According to CESB (2011), the production of maximized soybeans, even in small farms, depends on a number of factors, for example: searching for technical support and information through experienced agronomists and / or agronomists and using technical information to maximize productivity in order to enable the plant in a favorable climate to express its maximum potential.
CONCLUSIONS
Soybean production in the Southwest region of Paraná is based on small farms (19 to 23 ha), areas owned by the farmer himself and his family, constituting the essential labor force. Certified seed inoculated with Bradyrhizobium spp. (55%). The average productivity in the region is above 2.5 tons of ha-1 grains in the years without water deficit.
Among the practices that can be implemented to improve yield are inoculation, control of pests, diseases, and weeds.
ACKNOWLEDGEMENTS
To the Araucária Foundation, CNPq and Federal Technological University of Paraná (UTFPR), Campus Dois Vizinhos.
REFERENCES
ALBRECHT, L. P.; BRACCINI, A. L.; ÁVILA, M. R.; SUZUKI, L. S.; SCAPIM, C. A.; BARBOSA, M. C. 2008. Teores de óleo, proteínas e produtividade de soja em função da antecipação da semeadura na região Oeste do Paraná. Bragantia, Campinas, v.67, n.4, p.865-873.
AGRIANUAL – Anuário da Agricultura Brasileira, 2010. Soja. São Paulo, Agra FNP Pesquisas Ltda. 520p.
CALISKAN, S.; ARSLAN, M.; UREMIS, I.; CALISKAN, M. E. 2007. The effects of row spacing on yield and yield components of full season and double-cropped soybean. Turkish Journal of Agriculture and Forestry, Ankara, v.31, n.1 p.147-154.
CESB - Comitê Estratégico Soja no Brasil, 2011. Conheça o que há em comum entre o recordista de alta produtividade da soja nos Estados Unidos e no Brasil. Available in: <http://www.cesbrasil.org.br/noticias/paralelo-produtores.aspx> Access in: March 23, 2011. CONAB – Companhia Nacional de Abastecimento, 2011. Séries históricas relativas às safras
224
<http://www.conab.gov.br/conteudos.php?a=1252&t=2&Pagina_objcmsconteudos=2#A_obj cmsconteudos> Access in: April 11, 2011.
CONAB – Companhia Nacional de Abastecimento, 2015. Levantamento de Safra: 3º Levantamento de Grão Safra 2015-16, dezembro de 2015. Available in: < http://www.conab.gov.br/OlalaCMS/uploads/arquivos/15_12_11_11_02_58_boletim_graos_ dezembro_2015.pdf>. Acces in: January 06, 2016.
DALLEY, C. D.; KELLS, J. J.; RENNER, K. A., 2004. Effect of glyphosate application timing and row spacing on corn (Zea mays) and soybean (Glycine max) yields. Weed Technology, Fayetteville, v.18, n.1, p.165-176.
DERPSCH, R., C.; ROTH, H.; SIDIRAS, N.; KÖPKE, U. 1991. Controle de erosão no Paraná, Brasil: Sistemas de Cobertura do Solo, Plantio Direto e Preparo Conservacionista do Solo. GTZ/IAPAR, Londrina. 272p.
FURLANETO, F. P. B.; RECO, P. C.; KANTHACK, R. A. D.; ESPERANCINI, M. S. T.; OJIMA, A. J. R. O. 2008. Soja transgênica versus convencional: estimativa dos custos operacionais de produção na região do Médio Paranapanema, Estado de São Paulo. Ciência e Agrotecnologia, Lavras, v.32, n.6, p.1935-1940.
HUNGRIA, M., FRANCHINI, J. C., CAMPO, R. J., CRISPINO, C. C., MORAES, J. Z., SIBALDELLI, R. N. R., MENDES, I. C.; ARIHARA, J. 2006a. Nitrogen Nutrition of Soybean in Brazil: Contributions of Biological N2 Fixation and of N Fertilizer to Grain Yield. Canadian Journal of Plant Sciences, Ottawa, v.86, n.4, p.927-939.
HUNGRIA, M., CAMPO, R. J.; MENDES, I. C.; GRAHAM, P. H. 2006b. Contribution of biological nitrogen fixation to the N nutrition of grain crops in the tropics: the success of soybean (Glycine max (L.) Merr.) in South America. In: SINGH, R. P.; SHANKAR, N.; JAIWAL, P. K. (Ed.) Nitrogen nutrition and sustainable plant productivity. Houston, Texas: Studium Press, p.43-93.
IBGE – Insituto Brasileiro de Geografia e Estatística, 2002. Área Territorial Oficial. Resolução do Presidência do IBGE de n°5 (R.PR-5/02) de 10 de outubro de 2002. Available in: <http://www.ibge.gov.br/home/geociencias/cartografia/default_territ_area.shtm> Access in March 26, 2011.
IBGE – Instituto Brasileiro de Geografia e Estatística, 2011a. CENSO, 2010. Available in: <http://www.ibge.gov.br/home/estatistica/populacao/censo2010/tabelas_pdf/total_populacao _parana.pdf> Access March 26, 2011.
IBGE – Instituto Brasileiro de Geografia e Estatística, 2011b. Produto Interno Bruto. Available in:<http://www.ibge.gov.br/home/estatistica/economia/pibmunicipios/2004_2008/defaulttab. shtm> Access in: March 26, 2011.
INSTITUTO PARANAENSE DE DESENVOLVIMENTO ECONÔMICO E SOCIAL - IPARDES. 2010. Cadernos municipais. Available in: <http://www.ipardes.gov.br>. Access in: April 11, 2010.
LAZAROTO, L. A.; FLECK, N. G.; VIDAL, R. A. 2008. Biologia e ecofisiologia de buva (Conyza
bonariensis e Conyza canadensis). Ciência Rural, Santa Maria, v.38, n.3, p.852-860.
LIMA, C. R. L. M.; REINERT, D. J.; REINCHERT, J. M.; SUZUKI, L. E. A. S. 2010. Produtividade de culturas e resistência à penetração de Argissolo Vermelho sob diferentes manejos. Pesquisa Agropecuária Brasileira, Brasília, v.45, n.1, p.89-98.
MARTIN, T. N., VENTURINI, T.; API, I.; PAGNOCELLI, A.; VIEIRA JÚNIOR, P. A. 2011. Perfil do manejo da cultura de milho no sudoeste do Paraná. Revista Ceres, Viçosa, v.58, n.1, p.1-8.
225 MAPA – Ministério da Agricultura, Pecuária e Abastecimento, 2016. Zoneamento agroclimático. Online. Availale in: <http://www.agricultura.gov.br/politica-agricola/zoneamento-agricola> Access in: January 12, 2016.
MIYAMOTO, Y. 2007. Estimativa da área com soja transgênica no Brasil. Available in: <http://www.caminhosdocampo.ondarpc.com.br>. Access in: November 20, 2007.
PEEL, M. C.; FINLAYSON, B. L.; MCMAHON, T. A. 2007. Updated world map of the Köppen-Geiger climate classification. Hydrology and Earth System Science, Karlsruhe, v.11, n.5, p.1633-1644.
PNUD – Programa das Nações Unidas para o Desenvolvimento, 2011. Índice de Desenvolvimento Humano - Municipal, 1991 e 2000. Available in:
<http://www.pnud.org.br/atlas/ranking/IDH-M%2091%2000%20Ranking%20decrescente%20(pelos%20dados%20de%202000).htm> Access in: March 26, 2011.
SANDINI, I. E.; FANCELLI, A. L. 2000. Milho: estratégias de manejo para a região sul. Guarapuava, Fundação Agrária de Pesquisa Agropecuária. 209 p.
SANTOS, R. A. 2011. Território e modernização da agricultura no Sudoeste do Paraná. Revista Espaço Acadêmico, Maringá, v.10, n.118, p.114-122.
TREZZI, M. M., VIDAL, R. A.; XAVIER, E.; ROSIN, D.; BALBINOT JR, A. A.; PRATES, M. A. 2011. Resistência ao glyphosate em biótipos de buva (Conyza spp.) das regiões oeste e sudoeste do Paraná. Planta Daninha, v.29, p.1113-1120.
VARGAS, L., NOHATTO, M. A.; AGOSTINETTO, D.; BIANCHI, M. A.; PAULA, J. M.; POLIDORO, E.; TOLEDO, R. 2013. Práticas de manejo e a resistência de Euphorbia
heterophylla aos inibidores da ALS e tolerância ao glyphosate no Rio Grande do Sul. Planta
Daninha, Viçosa, v.31, n.special, p.427-432.
VIEIRA NETO, A. S., PIRES, F. R.; MENEZES, C. C. E.; MENEZES, J. F. S.; SILVA, A. G.; SILVA, O. S.; ASSIS, R. L. 2008. Formas de aplicação de inoculante e seus efeitos sobre a nodulação da soja. Revista Brasileira de Ciência do Solo, Viçosa, v.32, n.2, p.861-870. YORINORI, J. T. 2002. Ferrugem asiática da soja (Phakopsora pachyrhizi): ocorrência no
Brasil e estratégias de manejo. In: XXIV Reunião da Pesquisa de Soja da Região Central do Brasil. Londrina, Embrapa soja (Documentos, 186).
Received in: February, 25, 2016 Accepted in: December, 12, 2019