(Annals of the Brazilian Academy of Sciences) ISSN 0001-3765
www.scielo.br/aabc
Interpretation of the stiffness and permeability of Sand-Kaolin mixtures
in the framework of homogenization
CLAUDE BOUTIN, GREGORY KACPRZAK and THIEP DOANH
Université de Lyon, École Nationale des Travaux Publics de l’Etat, LGM/DGCB CNRS 1652 Rue Maurice Audin 69518 Vaulx-en-Velin, France
Manuscript received on June 4, 2008; accepted for publication on February 9, 2009
ABSTRACT
This study deals with the behaviour of mixtures of sand and saturated kaolin paste considered as composite materials made of permeable and deformable (with non-linear behaviour) matrix (the kaolin paste) with rigid and impervious inclusions (the sand grains). Oedometric and permeability tests conducted on such mixtures highlight the key role of the state of the clay paste, and show the existence of a threshold of sand grain concentration above which a struc-turing effect influences both modulus and permeability. At the light of these experiments, the usual and tangent homogenization process (with simplifying assumptions to make the problem manageable) has been applied to estimate the mixture permeability and tangent compressibility. Qualitative and quantitative comparisons with experimental data point out the domain of interest and the limitations of such approaches.
Key words: homogenization, non-linear behaviour, sand-clay mixtures, permeability, tangent modulus, compaction,
hardening.
INTRODUCTION
Materials made of sand and clay are widely encoun-tered in civil engineering either as common natural soils on which structures are settled, or as reconstituted ma-terials used for road embankment, earth dam, contami-nation barrier, etc. Their ability to be compacted is of first importance in design, either to predict or control the structural settlement due to consolidation, or to reach re-quired performances in terms of mechanical resistance or impermeability, particularly in the case of clay lin-ers. From practice, it is well known that the compress-ibility highly depends on the nature of the constituents – especially the mineralogical structure of the clay – their relative proportions, as well as the overall density
Selected paper presented at the IUTAM Symposium on Swelling and Shrinking of Porous Materials: From Colloid Science to Poro-mechanics – August 06-10 2007, LNCC/MCT.
Correspondence to: Claude Boutin E-mail: [email protected]
and the water content. However, if empirical rules are well established, the derivation of the sand-clay mixture compressibility from that of the constituents remains an open question.
This is typically an upscaling problem that could in principle be handle in the framework of homogeniza-tion methods. The use of such a framework is, however, made difficult by the strong non-linearity and irrever-sibility of the compaction process, whose aim is to pro-duce a large reduction in pore volume (and to expel wa-ter in case of saturated mawa-terials). It is largely accepted in soil mechanics that, for simple soils like uncemented sand or remoulded kaolin recompacted in the laboratory, the decrease in void volume during compaction is pro-portional to the logarithm of the effective stressσ′ fol-lowing the phenomenological law:
e1−e0= −Cc∙Log
σ1′
where eis the void ratio,Cc is the compression index
and the subscript 0 and 1 denote two arbitrary states. Actually, even in the basic case of a composite made of saturated clay and rigid sand grains, such a non-linear physics including volume variations as an essential fea-ture leads to homogenization problems of high theoreti-cal and numeritheoreti-cal complexity. For this reason, simplify-ing physically based assumptions are of interest to make the up-scaling problem manageable, while catching the key mechanisms at the local scale.
This study aims at clarifying this question by a two-fold approach that consists in, (Kacprzak 2006):
• first, to produce and analyze experimental data in order to identify the key mechanisms of compaction hardening at the inter-granular scale and to derive reasonable assumptions in view of homogenizat-ion. For the sake of simplicity, only unidirectional experiments have been performed. Moreover, as linear homogenization is well established, experi-ments involving both linear (viscous flow) and non-linear phenomena (consolidation hardening) will be conducted in order to point out the specificity in-duced by the non-linearity.
• second, to identify up to which extent some usual homogenization processes are able to describe rea-sonably the mixture behaviour, and, using experi-ments for comparison, to point out their main limi-tations.
The paper is divided into four sections. First, the basic principles taken in consideration to develop this study are given. Then, the fabrication procedure of the satu-rated sand-clay mixtures and the testing program of oe-dometric and permeability measurements are described. The third section is focused on the experimental results and their physical interpretations. Finally, by using clas-sical and tangent homogenization approaches in asso-ciation with simplifying assumptions, basic modelling of the mixture permeability and non-linear oedometric compressibility are presented and discussed.
GUIDELINES OF THE STUDY
This study is devoted to saturated mixtures made of the three following constituents:
• Hostun’s sand grains (G), having a densityρgequal
to 2650 kg/m3, and quasi-uniform size distribution
with a D50 close to 0.5 mm. The minimum and
maximum void ratio of this sand are respectively of emin=0.65; emax=1.04.
• Kaolin (C), having a densityρcequal to 2650 kg/
m3and typical size of platelets equal to 5µm. The
water content at the liquid and plastic limits is equal towL =0.51 andwP =0.24, respectively.
• Water (W) having a densityρw equal to 1000 kg/ m3. Note that the use of kaolin avoids or greatly minimizes any phenomena of swelling induced by water, whatever is its ionic concentration.
The mixtures are macroscopically homogeneous, and the characteristic size of their Representative Elemen-tary Volume (REV) is much smaller than the size of the samples tested for this study.
TRIANGULARREPRESENTATION OFSATURATED MIXTURES
For saturated mixtures, the volume ratio of grains G, clay plateletsC, and waterW, defined by:
C = VC
VC+VG+VW
;
G = VG
VC+VG+VW
;
W = VW
VC+VG+VW
,
(2)
are related by:
C+G+W =1, (3)
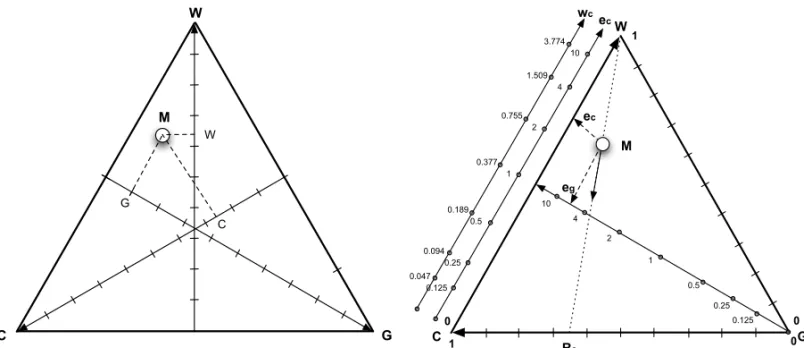
and the water volume ratioW is the usual porosityn. Conveniently, any mixture may by represented by a point Min an equilateral triangle {C,G,W}whose summitsC,G,W correspond respectively to C = 1, G=1,W =1, and the opposite basis, e.g.GW,
corre-sponds toC =0, (andCWtoG =0;CGtoW =0). The three volume ratios of the mixture represented by
Mare provided by the three orthogonal projections of Mon the three altitudes (Fig. 1 on the left).
The clay content ratioRcthat determines the grains
W
G C
G
W
C
M
W
G C
M
Rc 1
0
0 0
!
! eg
ec
10 4
2
1
0.5 0.25 10
4
2
1
0.5
0.25
0.125
wc
3.774
1.509
0.755
0.377
0.189
0.094
0.047
0.125
1
ec
Fig. 1 – Triangular representation of saturated sand clay mixtures. On the left, determination of the mixture composition with of the volume ratio parametersC,W,G. On the right, identification of the two control parametersecandeg. The extended lineWMcorresponds to mixtures of
identicalRcand indicates the consolidation path in oedometer testing.
or volume, since the grains and platelets specific gravi-ties are identical) is defined by:
Rc=
C
C+G (4)
Graphically, Rc is obtained by the intersection of the
lineWMwith the baseCG. (Fig. 1 right). Note that
all mixtures located on the lineWMhave the same clay
content ratio, i.e., the same constitution of solid parti-cles (and, therefore, same grain size distribution). For this reason, during its oedometric consolidation, a mix-ture necessarily evolves on the lineWM.
The void ratio eof the saturated mixture is given by:
e= W C+G =
W
1−W. (5)
It is obtained in the triangular graph – with a non-linear scale – by the projection of M on the altitude issued
from the vertexW, perpendicular toCG. Thus, all
mix-tures located on a line parallel toCGhave an identical
void ratioe, or also the same porosityn =W.
The two control parameters ecand eg
Because of the great difference of size between sand grains and kaolin platelets, such mixtures can be con-sidered as bi-composite materials made of sand grains embedded in a matrix of saturated clay paste (i.e., kaolin
and water). These two components present highly con-trasted properties, since the grains are rigid and impervi-ous while the clay paste is deformable and permeable.
The mechanical properties of the clay paste strongly depend of its water contentwc. The behaviour ranges
from that of a quasi-liquid suspension for wc > wL
(undrained shear strengthcu typically less than 2 kPa,
(Wood 1990)) to that of a plastic paste forwL > wc >
wP (undrained shear strength typically comprised
be-tween 2 and 200 kPa), and reaches a solid behaviour for wc < wP (cu typically higher than 200 kPa). When
the shrinking limitwS < wP is reached, the
arrange-ment of the clay platelets cannot adapt anymore to the weak amount of water and the saturation is no more pos-sible. In this state, the behaviour of the material is pro-gressively affected by other mechanism such as suction by desaturation, and cracks start to develop.
The density of the mixture obeys moreover to re-strictions imposed by the sand skeleton. Sand grain ar-rangement in the mixture cannot be denser than the densest arrangement of pure sand alone(Rc = 0), but
oppositely, can be looser than the loosest arrangement of pure sand. Then, considering the paste to grain vol-ume ratio,eg=(C+W)/G, (Mitchell 1976):
• necessarilyeg>emin;
• when emax > eg > emin, one may infer that the
• the larger the grain volume ratioeg(> emax), the
lower the contacts among grains will be. As a con-sequence, grains do not build a skeleton and the mixture turns to a clay paste matrix embedding dis-persed grains.
These observations lead to the use of the two volumetric control parametersecandegfor specifying the
mechan-ical behaviour of the mixtures:
• the clay paste void ratio defined by:
ec=
W
C , (6)
is related to the water content of the paste (defined in terms of mass ratio) by ec = (ρc/ρw)wc =
2.65wc. In the triangular graph,ec is obtained –
with a non-linear scale – by the intersection of the line GMwith the baseCW(Fig. 1 on the right).
Note that all mixtures located on the lineGMhave
the same clay void ratio, i.e., the same clay be-haviour at the initial state.
• the granular “void” ratio related to the concentra-tion in grains. By analogy with pure sand, the gran-ular void ratio is the ratio of the volume in-between sand grains divided by the volume of grains in a unit volume of mixture. Its expression is:
eg=
C+W
G =
1−G
G . (7)
Aseg is a function ofG, its representation in the
triangular graph lies on the same axis thanG(i.e., the projection of M on the line perpendicular to
the baseCW, Fig. 1 on the right), but with a
non-linear scale (Fig. 1 on the left). Consequently, all the mixtures located on a line parallel toCWhave
identical granular void ratio.
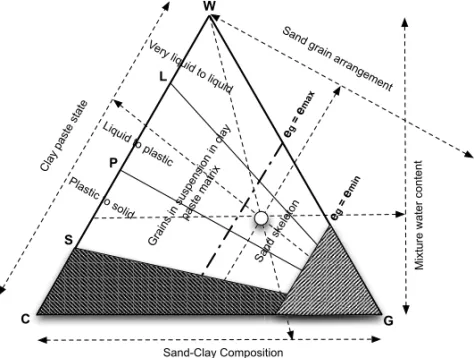
MIXTURECOMPOSITION ANDMECHANICALBEHAVIOUR
By crossing the features of sand(emin,emax)and of clay paste(wL, wP, wS), one may define different
morpho-logies of the mixtures (Fig. 2).
Three regions are defined by the two lines parallel toCWcorresponding toeg=eminandeg=emax.
Mix-tures ofeg < emin are impossible to happen, between
the lineseg =eminandeg =emaxthey present a
gran-ular skeleton, and between eg = emax andCW, their
morphology turns progressively to dispersed grains into a clayed matrix.
The linesGL,GP,GScorresponding towc=wL,
wP,wS define four sectors. In betweenGWandGL,
the clay paste behaves as a quasi-liquid suspension; in betweenGLandGP, the clay paste behaves as a
plas-tic paste; in betweenGPandGS, the clay paste is solid.
Finally, in betweenGSandGC, it is impossible to
sat-urate the clay and therefore, the mixture. The shaded regions in Figure 2 beloweminandwSindicate the
im-possible states of saturated sand-clay mixtures.
From this representation it is clear that, by modi-fying the amount of water, mixtures made of the same sandy clay material may range from a quasi-liquid sus-pension of clay with dispersed sand grains (that may even be unstable because of the sand grains sedimen-tation) to a sand skeleton surrounded by a plastic paste. Similarly, at the same porosity (or void ratio), by chang-ing the sand content, the mixture may vary from a clayed sand made of a solid clay matrix embedding sand grains, to a sandy clay having a grain skeleton surrounded by a plastic paste.
These two examples show that, when varying in-dependently the usual soil mechanics parameterse(or W) andRc, both clay water content and sand content are
modified. Thus, the links between the behaviour of the constituents and the one of the mixture would be diffi-cult to identify. For this reason, in this study, the mix-tures have been created in view of controlling the paste behaviour – bywcorec– and the sand content, byeg.
TESTED MIXTURES AND EXPERIMENTS
More than twenty mixtures have been done (Kacprzak 2006). Three initial water contents(wci)were selected
to study mixtures made of paste either at the liquid limit (wci = wL = 0.51;cu ≈ 2k Pa), at an intermediate
water content(wci = 0.35;cu ≈ 31k Pa), and close
to the plastic limit(wci = 0.30 > wP = 0.24;cu ≈
73k Pa), Figure 3. The grain size distribution of the tested mixtures is shown in Figure 4. Values ofegclose
toeg ≈1≈emax,1.5,2,3,4,6 and∞(no sand) have
Sand-Clay Composition
Cla y p
ast e st
ate
W
G C
L
P
S
Mi
xt
u
re
w
a
te
r
co
n
te
n
t
Sand gra in arra
ngeme nt Very
liquid to liquid
Liqu id to
plastic
Pla stic
to so lid
eg = em
ax
eg = em
in
Gra
ins
in su
spen
sion
in cl ay
past
e ma
trix
San
d ske
leto
n
Fig. 2 – Possible morphology of saturated sand-clay mixtures.
W
G C
Rc = 0.75 0.50 0.30 eg =
ema
x= 1.0
41
eg = emi
n= 0.6
48
eg =
2
eg =
4
eg =
6
Wc = W
L= 0.51
Wc = W
P= 0.24
W
c= 0.35
W
c= 0.30
tested mixtures
Fig. 3 – Triangular representation of the tested sand clay mixtures.
FABRICATIONPROCEDURE
A reliable fabrication procedure has been defined and followed cautiously for all tested mixtures. First, the kaolin powder is mixed thoroughly with distilled water added progressively in a 5 litres mechanical mixer. The combined effects of mixing and slowly water impregna-tion yields easily to homogeneous saturated pastes with the target initial water content(wci). Then, an
appro-priate amount of Hostun sand was added progressively
to this clay paste at the required state(wci)and slowly
mixed to reach a target value ofeg. Observations
indi-cated that this procedure leads to a mixture formed by sand particles uniformly coated by the clay paste. How-ever, air remains in between the spheroid coated grains (except in the case of liquid paste and small amount of sand).
0 10 20 30 40 50 60 70 80 90 100
0.1 1 10 100 1000
Particule size [µm]
F
in
e
r
[%
]
Kaolinite P300, Rc=1
Rc=0.75
Rc=0.50
Rc=0.30
Hostun S28, Rc=0
Tested mixtures
Fig. 4 – Range of variation of grain size distribution of mixtures.
of blows were applied to avoid a high level of pre-con-solidation (AFNOR 1993)). The reproducibility of the tests results further carried out on these samples let us be confident about the homogeneity of each specimen and the uniformity of sample population.
It is worth mentioning that, despite the saturation of the clay paste in the first fabrication stage, air bub-bles remain trapped during compaction. The checking and loading tests further carried out evidenced the pres-ence of a volume of air around 10% of the overall vol-ume of the mixture. In the following, to avoid any am-biguity, the term “mixture” systematically specifies the saturated clay, water and sand media (on which the pa-rameter and notations introduced above apply), when “soil” denotes the mixture together with the air bub-bles (whose associated parameters are indexed by “s”). The term “pure” refers solely to one constituent of the mixture, i.e., pure sand means only sand in the mixture (Rc =0).
PREVIOUSSTUDIES
Surprisingly, there are relatively few systematic studies on the response of clay-sand mixtures for different mix-ture density, water content and clay-sand ratio. Geor-gianou et al. (1990) study the response of Ham river sands merged in a very liquid speswhite kaolin slurry
(5wL), and found that the mixture behaves almost as a
sand saturated by pure water. This result indicates that, for such a high level of clay paste liquidity, suspensions of sand grains are unstable, so that mixtures necessar-ily present a skeleton of sand grains. Wood and Ku-mar (2000) investigate mixtures made of a liquid kaolin clay(1.5wL)and coarse sand. They establish two kinds
of behaviour: the behaviour of stable suspensions of grains, mainly controlled by the clay paste, and the be-haviour of skeletons of grains in contact filled by the clay paste, mainly controlled by the grains. The con-clusions drawn in this study are, however, limited to the case of clay paste with a water content higher than the liquid limit, that is with a very low shear strength. As a consequence, the clay paste cannot carry shear forces and cannot consequently act as bridges in-between the sand particles. The aim of the present study is to pro-vide some insights into the behaviour of clay-sand mix-tures where the stiffness and the strength of the clay paste range from low values to values close to that of the sand skeleton.
EXPERIMENTS
0
100
200
300
400
500
600
700
800
1 10 100 Time [sec] 1000 10000 100000
S
e
tt
le
me
n
t
[
µ
m
]
Instantaneous Phase
Plastic deformation due to air bubbles
Primary Consolidation
Secondary Consolidation
Volume variation of the mixture
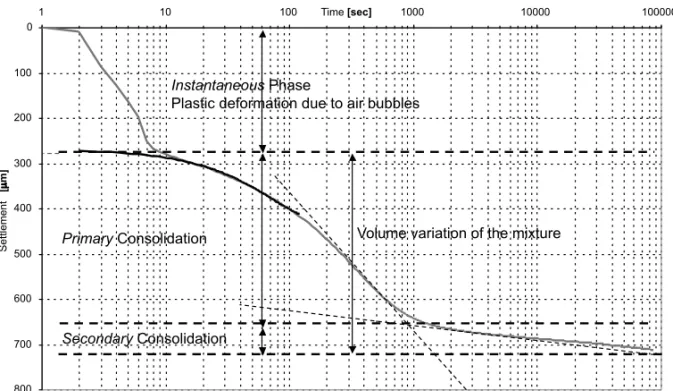
Fig. 5 – Typical record of settlementversusLog(t)for a single loading stage, separated into three mechanisms decoupled in time.
sample was used for checking the values of targetedec
andeg. The two others were submitted to identical
oedo-metric tests (AFNOR 1997) and permeability measure-ments (AFNOR 2005). A fairly good reproducibility of the experimental results is systematically noticed.
The oedometric experiments follow the standard procedure, doubling the load every 24 hours, from 35 kPa, to 1120 kPa. Including the intermediate (280– 70 kPa) unloading-reloading, and final unloading steps (1120–35 kPa), the experiments took 14 days. The set-tlement of the sample was measured automatically by LVDT sensors.
The permeability measurements have been per-formed straightforwardly on the samples in the oedo-metric cell before each additional loading step using the variable head method. The ambient temperature was also monitored in the oedometric cell.
ANALYSIS AND TREATMENT OF EXPERIMENTAL DATA
RESULTS FROMOEDOMETERLOADING
The record of the settlements observed during all the oedometer tests and for all the loading stages systemati-cally evidence three different steps (Fig. 5).
Initially, an instantaneous high deformation is ob-served. Further unloading indicates that this deformation
is irreversible. Because clay, grain and water are weakly compressible, an instantaneous seepage is impossible. Moreover, the adjustment of mechanical gaps in the ap-paratus only concerns the first loading step. Thus, this systematic quick volume variation results from the com-pression of the very deformable air bubbles captured in-side the soil during the sample preparation: under a load increment, the paste instantaneously yields, compresses the air bubbles, and the soil reaches a more compact con-figuration that supports the total applied load.
In a second step, the classical phase of consolida-tion starts to develop. It corresponds to the transfer of load from the fluid to the solid, associated with the expul-sion of water that induces the volume variation. In good agreement with the consolidation theory, it has been ob-served that the duration of the primary consolidation and the magnitude and rate of settlements increased for sam-ples with a higher void ratio of the clay paste and a lower granular void ratio.
The third step consists in the secondary consolida-tion, characterized by a linear evolution of the settlements with Log(t). By testing the different mixtures, it has been noticed that the amplitude of this phase increases with the void ratio of the clay paste. Moreover, when egis close toemax(i.e., when the grains are in contact
secondary and primary consolidation have been observed to be comparable.
MEANCLAYPASTEVOIDRATIO<ec>ANDAPPARENT
CLAYCOMPRESSIBILITY
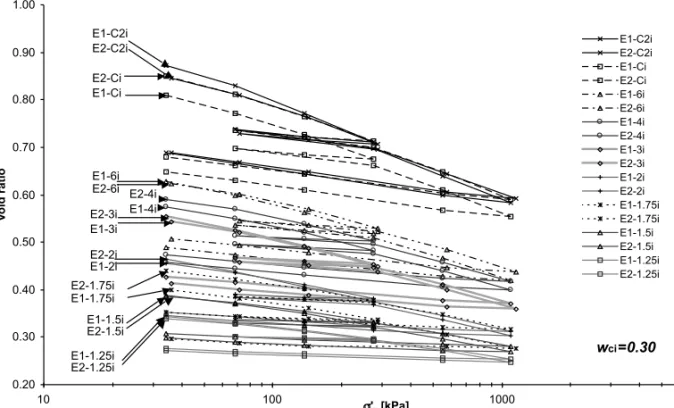
It can be deduced from Figure 6 that all the tested soils follow the classical one dimensional consolidation be-haviour as all the compression curves are straight lines in thees – Log(σ′)diagram. However, they do not
al-low for a good discrimination of the behaviour of the different soils. A better insight into this question is pre-sented hereinafter by drawing the compression curve of the mixture and the apparent compression curve of the clay paste within the mixture.
At each loading stage, the effective volume varia-tion of the saturated sand clay mixture is calculated by subtracting the instantaneous settlement (due only to air bubbles compression) from the total settlement of the soil. This procedure enables the derivation of the aver-age void ratio of the saturated mixture, denoted<e>:
<e>= W
C+G (8)
and the drawing of the mixture compression curve<e> versusLog(σ′).
Now, the average void ratio of the clay paste<ec>
can be obtained by dividing<e>by the clay content Rc, which is constant during each oedometric tests:
<e> Rc
= W
C+G C+G
C =
W
C =<ec> (9)
Then, the apparent compression curve (Log(σ′);<ec>)
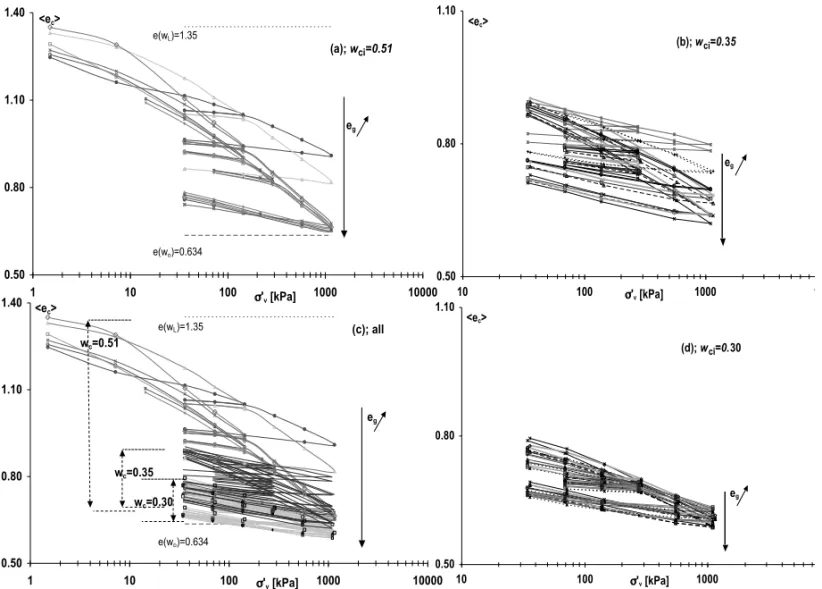
of the clay pastewithin the mixture, can be deduced as shown in Figure 7. The term “apparent” underlines that, in most of the cases, the effective stress σ′ applied on the mixture is not the stress supported by the clay itself. The following paragraphs address the analysis of the be-haviour of the different mixtures from the analysis of the apparent compression curve of the clay paste only. The discussion is organized by distinguishing the effect of the initial water content of the clay paste (from the liquid to the plastic limit) and the granular void ratio (from dilute to dense).
Mixtures made of clay paste at the liquid limit
Figure 7(a) shows the apparent compression curve of the clay paste within a mixture at the liquid limit and for dif-ferent granular void ratio(eg=1,1.2,1.7,3,5,9), and
the compression curve of the pure clay paste. Mixtures witheg≥2emax, that is with sand grains dispersed in the
clay paste, have the same apparent compression curve than the pure clay paste. This suggests that the effective stress applied to the mixture(σ′)is merely transferred to the clay paste that supports (at least in average) the load applied to the mixture(< σc′>=σ′). Two reasons can be argued for the negligible effect of rigid sand in-clusions on the clay paste. The first reason relies on the fact that the grains are too distant to interact significantly. The second reason relies on the low shear strength of the clay paste that avoids the development of shear stresses in the paste. As a result, the stress state inside the clay is very close to be uniformly hydrostatic within all the sam-ple. Both the local vertical stress< σc′>and the local void ratio of the clay paste are homogeneous in the sam-ple and equal, respectively, to the vertical applied load < σ′>and average void ratio of the clay paste<ec>.
Thus,σc′ =σ′and<ec>=ec, the compression curves
(Log(σ′);<ec>)and(Log(σ′);ec)coincide.
Oppositely, the mixture that presents a skeleton of grains,eg =1=emax, shows an apparent compression
curve close to that of the loose sand, much less com-pressible than the pure clay paste. The reason is that the grain skeleton – significantly stiffer than the liquid clay paste – supports most of the stress applied to the mixture (σsk′ ≈σ′). Thus, the clay paste undergoes locally small stresses(σc′≪σ′)and its volume variation is essentially governed by the grain rearrangement. Consequently, the volume variations of the pure clay paste are much smaller than those that would have suffered by carrying the whole mixture stress.
Finally, the apparent compression curve of the mix-ture with a granular void ratioeg =1.2 lies in between
those of the pure clay paste and the mixture of loose sand (eg =emax)– clay paste. In this intermediary case, de-spite of a sand skeleton being in formation (not all the grains are in contact aseg > emax) the mixture is able
0.20 0.30 0.40 0.50 0.60 0.70 0.80 0.90 1.00
10 100 1000
! 'v [kPa]
V
o
id
r
a
ti
o
E1-C2i E2-C2i E1-Ci E2-Ci E1-6i E2-6i E1-4i E2-4i E1-3i E2-3i E1-2i E2-2i E1-1.75i E2-1.75i E1-1.5i E2-1.5i E1-1.25i E2-1.25i
wci=0.30
E1-C2i E2-C2i
E2-Ci E1-Ci
E1-6i E2-6i E2-4i
E1-4i E2-3i E1-3i
E2-2i E1-2i
E1-1.25i E2-1.25i E1-1.5i E2-1.5i E2-1.75i E1-1.75i
Fig. 6 – Compression curves(es;Log(σ′))obtained for the soil samples prepared withwc = 0.30 and
eg = 1.25,1.5,1.75,2,3,4,6, and the pure clay paste. The superimposed curves are an evidence of the
good repeatability of the results.
existence of a tenuous skeleton made of sand grains al-ready in contact and clay bridges that undergo stresses of the same order(σk′ ≈σc′). Due to load partly carried by the tenuous skeleton and partly by the clay paste, both having comparable stiffnesses, the stress within the paste differs from that applied to the mixture and the apparent compression curve differs from that of pure clay paste.
These results are qualitatively identical to those obtained by (Wood and Kumar 2000) for mixtures of similar constitution. Both studies indicate that the be-haviour “jumps” from that driven by the clay paste to that driven by the grain skeleton for a limited increase in granular void ratio. The connection threshold of the grains is the determining factor. The present study indi-cates that, for the case of a clay paste at the liquid limit, the connection threshold takes place for a granular void ratio ranging between 1.5emaxand 2emax.
Mixtures made of clay at an intermediate state
Figure 7(b) shows the apparent compression curves of mixtures of different granular void ratio (eg =
1,1.5,2,3,4,6), made of clay paste at water content wc = 0.30, an intermediate value between the liquid
and plastic limits. They are regularly distributed, rang-ing from that of pure clay paste and that of loose sand, as the sand concentration increases, i.e.,egdecreases. It
is worth mentioning that, in all the cases, the presence of sand modifies the apparent compression curve, even at a very low concentration(eg = 6). This last case
is particularly interesting as it provides keys about the homogeneity of the stress state inside the clay paste. In-deed, as mentioned above, when the grains are dispersed, the clay paste undergoes in average the load applied to the mixture(< σc′ >= σ′). If the stress state would be homogeneous, then, there would be a uniform vol-ume variation of the clay paste and the average void ratio <ec>would be equal to that of the pure clay pasteec.
As a consequence, the apparent and the pure clay paste compression curves would coincide. As it is not case, one can conclude that the stress state and the volume variations within the clay paste are heterogeneous.
0.50 0.80 1.10 1.40
1 10 100 !' 1000 10000
v [kPa]
<ec>
eg
e(wL)=1.35
e(wp)=0.634
(a);wci=0.51
0.50 0.80 1.10
10 100 !'v [kPa] 1000 10
<ec>
eg
(b);wci=0.35
0.50 0.80 1.10
10 100 !'v [kPa] 1000
<ec>
eg
(d);w
ci=0.30
0.50 0.80 1.10 1.40
1 10 100 ! 'v [kPa] 1000 10000
<ec>
eg
wc=0.30
wc=0.35
e(wL)=1.35
e(wp)=0.634
wc=0.51
(c); all
Fig. 7 – Apparent compression curves<ec>versusLog(σ′)of the clay within the mixture. Mixtures initially made of clay paste at the liquid state: wc=0.51;eg=1,1.2,1.7,3,5,9, (a), at an intermediate state: wc=0.35,eg=1,1.5,2,3,4,6, (b) and at a quasi-plastic state:wc=0.30,
eg=1.25,1.5,1.75,2,3,4,6, (d). The data of all samples are plotted together on (c).
the load and shear zones between grains shifted one each other with respect to this direction. As (i) the represen-tative elementary volume (REV) undergoes a uniform vertical displacement, and (ii) the grains are rigid, the local axial deformation of the clay paste tends to be in inverse proportion of the inter-grains distance in the load-ing direction. Because the clay can support shear, this deformation is not compensated by an equivalent lateral deformation. Thus, the clay paste is more loaded in the narrow inter-grains spaces than in larger spaces. As a result of this mechanism, locally denser zones will be created in the clay. Such heterogeneous local stress dis-tributions in heterogeneous media have been already put forward in particular for elastic composites (Sanchez-Palencia 1980). It explains why, even in absence of a skeleton, the apparent behaviour – related to a local
het-erogeneous state – is stiffer than that of the pure clay paste under homogeneous load.
local stressσ′c higher than the stress externally applied σ′and a local void ratioec lower than the average void
ratio of the clay paste <ec >, meanwhile other clay
zones remain weakly loaded(σ′c ≪ σ′), then weakly compacted(ec > <ec>). Clearly, the effect of such a
structuring process is to increase the apparent stiffness of the mixture. One may infer from the test results that the higher is the grain concentration, local denser zones be-come more and more stressed and, consequently, more and more compact and stiffer, and the more plastic is the paste (i.e., more able to sustain deviatoric stress), the more dominating will be this effect.
One may finally notice that the higher stiffness ob-served in Figure 7(b) for the mixtureeg =1, possibly
results from the presence of a loose skeleton. The ex-planation is similar to that proposed for the liquid clay paste.
Mixtures made of clay close to the plastic limit
Figure 7(d) shows the variation of the apparent compres-sion curves for a mixture made of a clay paste close to the plastic limitwci =0.30 and granular void ratios ranging
betweenemaxand 6emax. It evidences that the apparent
compressibility decreases as the granular void ratio in-creases, in a qualitative way similar to that observed in the other tests. However, the effect of granular void ratio seems to be much more limited. This can be attributed to the higher stiffness of the clay paste, close to that of the sand skeleton. As the stiffness of the mixture can vary only between that of the pure clay and the pure sand, its variation is necessarily limited.
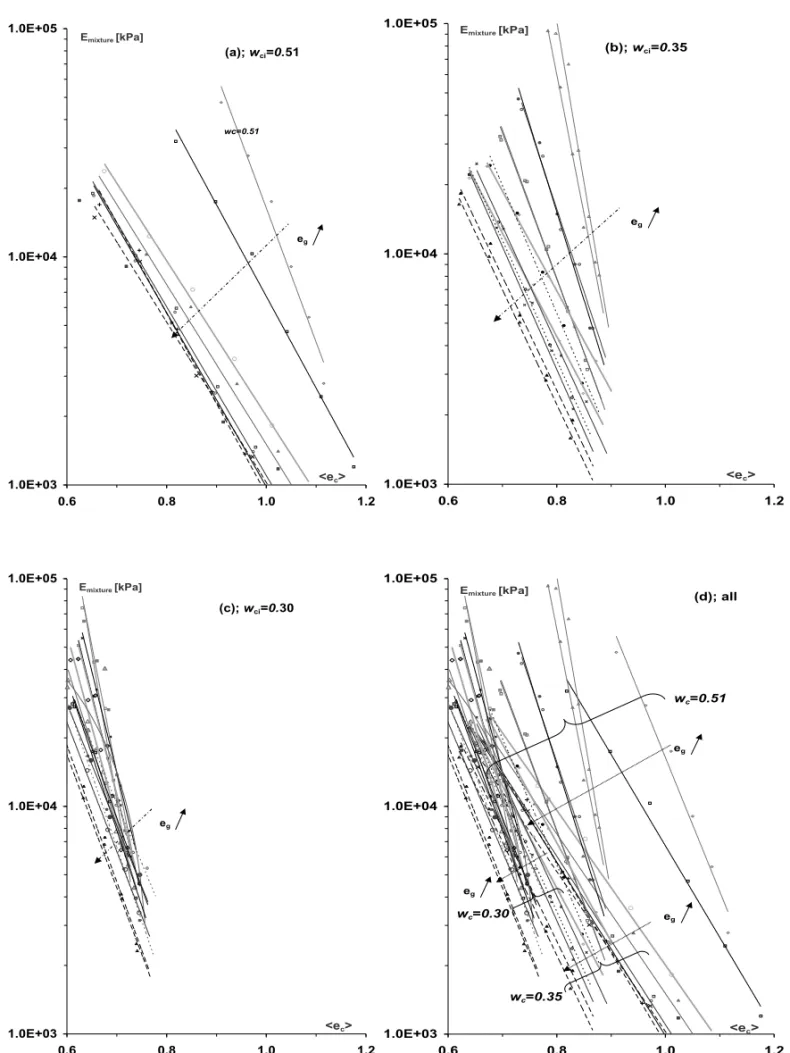
TANGENTOEDOMETRICMODULUS OFMIXTURES
An alternative analyse of the mixture behaviour is to re-late the tangent oedometric modulus of mixtureEoed to
the mean clay paste void ratio<ec>for different
val-ues ofeg. At each loading stage characterized byσi′and
ei = Rc. <ec>i,Eoed(ei)is classically deduced from
the mixture compression curve(e;Log(σ′))by:
Eoed(ei)=
△σ
△e(1+ei). (10)
The results given on Figure 8 show that, for a fixed eg, Log(Eoed)is a linear decreasing function of<ec>.
Moreover, aseg increases, Log(Eoed)increases. This
remarkable linearity indicates that the roles played by ecandegon the mixture behaviour can be expressed in
the general empirical form:
Log(Eoed)=a(eg)−b(eg). <ec>,
or Eoed=F(eg).10−<ec>.b(eg)
(11)
The coefficientb(eg)ranges from 4 for very
compress-ible pure clay pastes, eg = ∞to 10 for stiff mixtures
(presenting a grain skeleton,eg≈emax).
For mixtures free of skeleton (eg > 2emax), the relation (11) can be specified more precisely from Figure 8. Almost independently of the clay paste state, the value of Log(Eoed) can straightforwardly be
de-duced from that of the pure clay paste Epaste(<ec >)
by a translation factor depending oneg:
Log(Eoed)=a(eg)+Log(Epaste(<ec>)),
i.e. Eoed =F(eg).Epaste(<ec>)
(12)
The empirical equation (12)uncouplesthe rheological effect (clay paste response) and the geometrical effect (distance in-between sand grains related to their concen-tration) in the expression of the stiffness of the mixture. Note that< ec >represents the average void ratio of
the clay paste computed during loading for a given mix-ture, and is not representative of the initial water content of the clay. As well, Figure 8 indicates that F(eg)and
Epaste(< ec >) take different forms depending of the
initial state of the clay paste. For instance, in the case of paste prepared at the liquid state, Epasteis found to
follow the relationship:
Epaste(<ec>)=105104(1−<ec>)
andF(eg)ranges from 1 foreg= ∞, to 3 foreg=2.
For the mixtures with skeleton and/or possible structuring effect (eg < 2emax), the roles of eg and
<ec >are systematicallycoupled. This illustrates the
interdependences of the rheological and geometrical ef-fects that exist in most of non-linear material.
ANALYSIS OF THERESULTS ONPERMEABILITY
A similar analysis has been performed to relate the mix-ture permeability K (m/s) to the pure clay paste per-meability Kpasteand the sand content. Because of the
1.0E+03 1.0E+04 1.0E+05
0.6 0.8 1.0 1.2
<ec> Emixture[kPa]
wc=0.51
wc=0.35 wc=0.30
eg
eg eg
(d); all 1.0E+03
1.0E+04 1.0E+05
0.6 0.8 1.0 1.2
<ec> Emixture[kPa]
wc=0.51 (a);wci=0.51
eg
1.0E+03 1.0E+04 1.0E+05
0.6 0.8 1.0 1.2
<ec> Emixture[kPa]
(b);wci=0.35
eg
1.0E+03 1.0E+04 1.0E+05
0.6 0.8 1.0 1.2
<ec> Emixture[kPa]
(c);wci=0.30
eg
Fig. 8 – The oedometric tangent modulus Log(Eoed)of the mixturesversusthe average void ratio of the clay paste<ec>parameterized byeg.
1.0E-11 1.0E-10 1.0E-09 1.0E-08
0.6 0.8 1.0 1.2
<ec>
kmixture[m/s]
E1-1L E1-1.2L
E1-1.7L E1-3L
E1-CL E2-CL
E1-5L E1-9L
(a);wci=0.51
eg
1.0E-11 1.0E-10 1.0E-09 1.0E-08
0.6 0.8 1.0 1.2
<ec>
kmixture[m/s]
E1-1s E2-1s
E1-1.5s E2-1.5s
E1-3s
E2-3s
E1-2s E2-2s
E2-6s E1-6s
E2-Cs
E1-Cs E2-4s E1-4s
(b);wci=0.35
eg
1.0E-11 1.0E-10 1.0E-09 1.0E-08
0.6 0.8 1.0 1.2
<ec> kmixture[m/s]
E1-1.25i E2-1.25i
E1-1.5i E2-1.5i
E1-3i E2-3i
E1-6i E2-6i
E1-Ci E2-Ci
E2-1.75i E1-1.75iE2-2i
E1-2i E1-4i E2-4i
(c);wci=0.30
eg
1.0E-11 1.0E-10 1.0E-09 1.0E-08
0.6 0.8 1.0 1.2
<ec> kmixture[m/s]
eg
eg
eg
(d); all
wc=0.51
wc=0.35
wc=0.30
Fig. 9 – Permeability of the mixturesversus< ec >parameterized byeg. Mixture initially made of clay paste at the liquid state (a), at an
negligible and the mixture permeability is assimilated to the soil permeability. Figure 9 shows the variation of Log(K)with<ec >for different eg. A linear trend
is observed with a slope that decreases aseg increases,
according to the physical intuition. It is interesting to note that the curves present the same general trends as observed for the tangent oedometric modulus.
For mixtures with dispersed grains(eg>2emax)or made of paste at the liquid state, Log(K)can be reason-ably deduced from Log(Kpaste)by a translation factor
depending onegonly, following the expression:
K =H(eg)∙Kpaste(ec) (13)
Consequently, as for the constrained modulus, the mix-ture permeability can be decoupled into the product of the clay paste permeability by a pure geometrical factor related to grain concentration. For instance, considering mixtures prepared with paste at the liquid state:
Kpaste=10−9102(1−ec)
H(eg)lies in between 1 and 3.
Mixtures with closer grains(eg <2emax)and less
liquid paste are much less permeable, and the influence of<ec>andegcannot be decoupled. In those cases,
the experimental results may be summarized by the fol-lowing empirical relationships:
Log(K)=a′(eg)−b′(eg)Log(Kpaste);
or K =G′(eg)[Kpaste]b
′(e
g),
(14)
with 1/3<b′(eg) <1. The strong reduction of
perme-ability and its interdependence with the grain concentra-tion, argues in favour of a structuring process previously mentionned. Indeed, the significant reduction in perme-ability can be interpreted as being caused by the presence of a network of denser (and, thus, less permeable) zones within the clay paste.
BASIC MODELLING IN THE FRAMEWORK OF HOMOGENIZATION
Phenomena in heterogeneous media can be upscaled and formulated in terms of macroscopic behaviour, provided that a condition of scale separation is fulfilled. This latter condition requires that the medium morphology is suffi-ciently regular to be described by a Representative Ele-mentary Volume REV and that the characteristic size of
the phenomena is much larger than the REV size. These two conditions are respected in the present work.
For linear phenomena, the homogenization of pe-riodic media (Sanchez-Palencia 1980) – based on a two scale asymptotic expansions of both physical variables and differential operators – provides a rigorous the-oretical framework to justify the existence of the macro-scopic behaviour and to determine its features and limits of validity.
Non-linear phenomena drastically increase the theoretical difficulties, so that only sparse results for spe-cific cases are available (Suquet and Zaoui 1997). A way to relax this difficulty without missing the theoretical tools of the periodic homogenization is to linearize the problem. At the expense of simplifying assumptions, the homogenization can, then, be applied to determine the incremental tangent macroscopic properties.
This section aims at identify up to which extent the usual and tangent homogenization techniques are able to describe reasonably the mixture permeability and tangent compressibility. A corollary aim is also to point out the domain of interest and the limitations of such approaches by using the experiments described in this work for qualitative and quantitative comparisons.
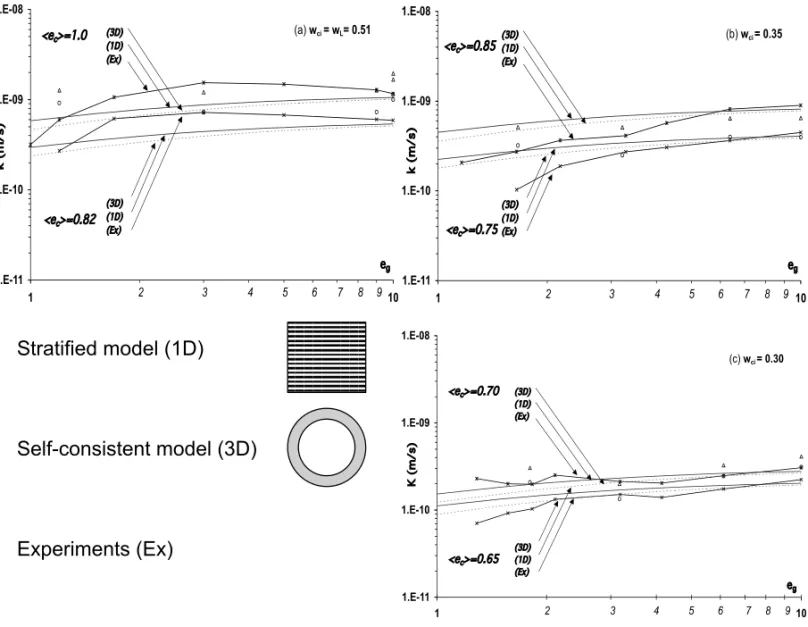
MODELLING OFPERMEABILITY
The determination of the permeability of a composite material made of a permeable media (the clay paste char-acterized byKpaste) and impervious grains at a granular
void ratioeg is a classical linear problem of
homoge-nization. By assimilating the mixture to a bi-composite withKpaste constant and isotropic (implying thatecis
considered homogeneous in the REV, i.e. ec,=<ec>),
and assuming in addition the mixture being isotropic, the homogenization procedure leads to express the per-meability of the mixtureK as:
K =Kpaste∙H (15)
whereHdepends only on the cell geometry. In absence of more details about grain arrangement in the REV,H will be expressed as a function of the most basic geo-metrical information: the volume ratio between the two constituentseg. To estimate H(eg), assumptions must
• the idealized case of a 1D stratified sand-clay paste microstructure. In this case, the permeability in the direction of the clay layers is given by:
K =Kpaste∙(1−G)=Kpaste
eg
1+eg
• a more realistic 3D geometry suggested by the ob-servation that the microstructure is essentially made of grains coated by the clay paste. For such config-uration, the form factor corresponding to spherical grains dispersed in the clay paste can be assessed by using a self-consistent approach based on a pat-tern formed by a bi-composite sand/paste sphere (Hashin 1968). The expression is:
K =Kpaste
eg 3 2+eg
The similarity between Equation (15) and the empirical equation (13) indicates that the assumption of constant ecwithin the REV is in accordance with the experience
for the case of mixture witheg>2emax.
Conversely, the discrepancy between Equation (15) and the power law observed experimentally (Equation 14) indicates that the assumption of an homogeneous clay paste within the REV is missed foreg < 2emax.
For quantitative purpose, a comparison of the theoreti-cal and experimental laws are drawn in Figure 10. The progressive departure of the curves asegdecreases
con-firms the previous remark and suggests the occurrence of structuring phenomena foreg<2emax.
From a theoretical point of view, the structuring ef-fect can be modelled by representing the mixture by a composite with inhomogeneous matrix (instead of a bi-composite). However, the necessity to known the local values of the permeability within the REV makes the problem much more complex in practice.
MODELLING OFOEDOMETRICTANGENTMODULUS
As already mentioned, the mixture compression be-haviour relies on a non-linear hardening mechanism in the clay paste surrounding the grains. A rigorous treat-ment by homogenization would be extremely complex since, at each loading stage, the inhomogeneous stress distribution modifies the local properties of the clay
paste within the REV. Thus, the derivation of the macro-scopic behaviour would require an incremental homog-enization procedure. A new step of calculation requires the construction of a new REV with properties deter-mined by the previous steps and accounting for the heterogeneous state of the clay paste. Note also that, conversely to the linear case, there is no proof of the uniqueness of the local solution in the REV until now.
In this context, no theoretical derivation of the uniqueness of the local solution will be looked for, but one will rely on the fairly good experimental repeatabil-ity to assume its existence. Notice that this assumption is necessary to justify the search of a macroscopic de-scription.
To reduce the complexity of the local problem, three successive simplifying assumptions will be intro-duced.
• First, the tangent homogenization approach is con-sidered. It considers a fictitious REV made of elas-tic materials whose properties matches the tangent properties of the real material in the REV. The ap-plication of the homogenization method on the fic-titious REV leads to the derivation of the tangent macroscopic properties of the real media. Although simplified, this tangent method remains complex because of the general anisotropy of the tangent behaviour. As a matter of fact, if the non linear constitutive law is expressed by:
σ =L(E):E
whereEis the strain tensor, the tangent behaviour
reads:
dσ =Lt(E):dE
And, from the tensor representation theorem, (Boel-her 1987), asEis generally anisotropic, the tangent
tensorLt(E)is also anisotropic.
• The second simplifying assumption is that the non-linear behaviour only depend on the isotropic invariant ofE, i.e., on the volume variation, so that
1.E-11 1.E-10 1.E-09 1.E-08
1 10
(c)wci= 0.30
2 3 4 5 6 7 8 9
Stratified model (1D)
Self-consistent model (3D)
Experiments (Ex)
1.E-111.E-10 1.E-09 1.E-08
1 10
(a)wci= wL= 0.51
2 3 4 5 6 7 8 9 1.E-11
1.E-10 1.E-09 1.E-08
1 10
(b)wci= 0.35
2 3 4 5 6 7 8 9
Fig. 10 – Permeabilityversusthe granular void ratio: comparison between theoretical expressions (assimilating the mixture to a 1D or 3D bi-composite) and experimental values.
However, the necessity to specify the local elastic-ity tensor within the REV makes the problem still complex.
• The third simplifying assumption states an homoge-neous volume variation within the clay paste (then ecequals<ec>). Then, the macroscopic tangent
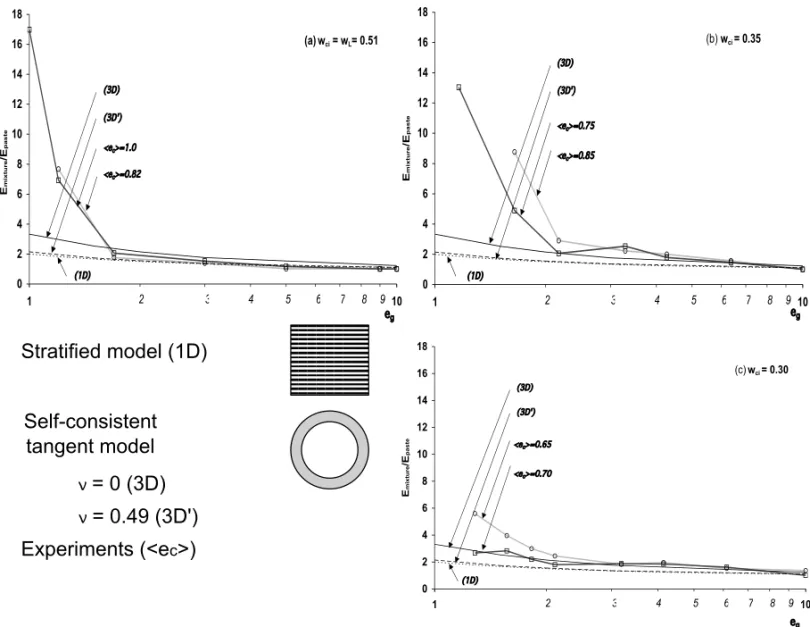
behaviour can be estimated from the basic homog-enization of a bi-composite made of rigid inclu-sions and an homogeneous isotropic matrix. This leads to express the oedometric modulus in the form (Kacprzak 2006):
Eoed=Epaste(<ec>)A(eg, ν) (16)
whereAis a dimensionless factor depending on the cell geometry (in that case oneg) and on the Poisson
ratioν.
The modulus of a 1D idealized stratified sand-clay paste microstructure is, in the direction perpendicular to the clay layers:
Eoed=
Epast e
1−G =Epaste 1+eg
eg
For spherical grains dispersed in the clay paste, the form factor can be assessed analytically by a self-consistent approach based on a pattern constituted by a bi-composite sand/paste sphere (Christiensen and Lo 1979). The theo-retical value ofA(eg, ν)slightly depends on the Poisson
ratio, (Kacprzak 2006).
0 2 4 6 8 10 12 14 16 18
1 10
E
m
ix
tu
r
e
/E
p
a
s
te
2 3 4 5 6 7 8 9
(a) wci = wL= 0.51
0 2 4 6 8 10 12 14 16 18
1 10
E
m
ix
tu
re
/E
p
a
s
te
2 3 4 5 6 7 8 9 (c)wci= 0.30
Stratified model (1D)
Self-consistent
tangent model
Experiments (<e
c>)
0 2 4 6 8 10 12 14 16 18
1 10
E
m
ix
tu
r
e
/E
p
a
s
te
2 3 4 5 6 7 8 9
(b)wci= 0.35
= 0 (3D)
= 0.49 (3D')
Fig. 11 – Oedometric tangent modulus. Comparison of the ratioEoed/Epastededuced from experimental data with those given by tangent
homogenization.
a quantitative point of view, a reasonable agreement is also observed (Fig. 11) for granular void ratio above the threshold 2emax.
However, this rudimentary analysis does not give neither qualitative nor quantitative results in agreement with the experimental results obtained on the mixtures witheg < 2emax. As for the permeability, this fact is
an indication of the effect played by both structuring and skeleton effects.
CONCLUSION
The response of mixtures of sand and saturated kaolin paste has been studied in the oedometer for different states of the clay paste (function of the initial water con-tent) and different sand concentrations. Results have been drawn as a function of two volumetric state
param-eters, the clay void ratioec and the granular void ratio
eg, instead of the overall void ratio parameter classically
used in soil mechanics. Results have been interpreted by considering the material as a composite made of a non-linear and permeable matrix (the kaolin paste) and rigid and impervious inclusions (the sand grains). The final aim of this study is to investigate the possibility to build by homogenization a macroscopic description related to a strongly non-linear local behaviour where volume variation is an essential feature.
Oedometric loading and permeability test results highlight the key role of the deviatoric strength of the clay paste in the perturbations introduced by the grains. They also point out a threshold of granular void ratio of about 2emax, below which both structuring and
the mixtures respect the classical logarithmic compres-sion behaviour. Finally, the good repeatability of the results provides, in some way, an experimental proof of the uniqueness of the solution at the local scale (at least statistically), which justifies the search of a macroscopic description.
Incidentally, the structuring effect explains possibly the higher inefficiency of the static uniaxial compaction with respect to the dynamic one. Indeed, the rotation of the principal stresses associated to the dynamic or rolling compaction imposes the stress paths to move and, thus, avoid the construction of stable hardening force chains that channel the stress flux. Location and orientation of the denser zones are constantly redistributed in the material and there is, consequently, no creation of stiffer material response in the preferential direction of the load. At the light of these experiments, the usual and tangent homogenization processes (with strongly sim-plifying assumptions to make the problem manageable) have been applied to estimate the mixture permeability and tangent compressibility. Qualitative and quantitative comparisons with experiments show that this approach reasonably succeeds to capture the macroscopic prop-erties over the whole range of loading when the granu-lar void ratio is granu-larger than the threshold of 2emax, but
fails in other cases. For these latter cases, the structuring and/or skeleton effect plays a significant role and must be taken into account at the local scale.
RESUMO
O estudo lida com o comportamento de misturas compostas por areia e uma pasta de caulinita considerada um material composto feito de uma matriz (caulinita) permeável e defor-mável (com comportamento não-linear) com inclusões rígidas e impermeáveis (grãos de areia). Testes de permeabilidade e odométricos conduzidos nestas misturas enfatizam o papel chave de estado da pasta argilosa e mostram a existência de uma concentração crítica de grãos de areia com efeito estru-turante que influencia o módulo e a permeabilidade. Sob a luz destes experimentos o processo de homogeneização usual e tangente (com hipóteses simplificadoras para tornar o problema tratável) foi aplicado para estimar a permeabilidade da mistura e a compressibilidade tangente. Comparações qualitativas e quantitativas com dados experimentais apontam o domínio de interesse bem como a limitação destas abordagens.
Palavras-chave: homogeneização, comportamento não-linear, misturas de areia-argila, permeabilidade, módulo tan-gente, compactação, endurecimento.
REFERENCES
AFNOR NF P94-093. 1993. Détermination des références de compactage d’un matériau. Essai Proctor normal. Essai Proctor modifié. Norme Française.
AFNOR XP P94-090-1. 1997. Essai oedométrique. Es-sai de compressibilité sur matériaux fins quasi saturé avec chargement par paliers. Norme Française.
AFNOR XP CEN ISO/TS 17892-11. 2005. Détermination de perméabilité à charge constante et à charge variable décroissante. Norme Française.
BOELHERJ-P. 1987. Applications of Tensor Functions in Solid Mechanics. CISM Courses and Lectures, 292, Springer Verlag, Wien, New York, 299 p.
CHRISTENSENRMANDLOKH. 1979. Solutions for effec-tive shear properties in three phase sphere and cylinder model. J Mech Phys Solids 27: 315–330.
GEORGIANOU V, BURLANDJ ANDHIGHTD. 1990. The undrained behaviour of clayed sands in triaxial compres-sion and extencompres-sion. Geotechnique 41(3): 383–393. HASHINZ. 1968. Assessment of self consistent scheme
ap-proximation: Conductivity of particulate composites. J Comp Mater 2: 284–304.
KACPRZAKG. 2006. Etude du comportement mécanique des mélanges sable/argile. PhD ENTPE/INSA.
MITCHELL JK. 1976. Fundamentals of soil behaviour. J Wiley & Sons, New York.
SANCHEZ-PALENCIAE. 1980. Non-homogeneous media and vibration theory. In: LECTURESNOTES IN PHYSICS, Springer-Verlag, Berlin, vol. 127, 396 p.
SUQUETPANDZAOUIA. 1997. Continuum micromechan-ics. Springer, Wien, New York, 247 p.
WOODDM. 1990. Soil behaviour and critical state soil me-chanics. Cambridge University Press, 462 p.