94 USING THE WEIBULL FUNCTION FOR PROGNOSIS OF YIELD BYMIGUEL, E. P. et al. DIAMETER CLASS IN Eucalyptus urophylla STANDS
Eder Pereira Miguel1, Sebastião do Amaral Machado2, Afonso Figueiredo Filho3, Julio Eduardo Arce4 (received: March 24, 2009; accepted: January 29, 2010)
ABSTRACT: This study aimed to fit the Weibull probability density function to stand data so as to represent the distribution of number of trees by diameter class, and also to fit models representing stand attributes so as to project growth and yield by diameter class and also yield of multiple wood products at the relevant rotation age (7 years). Data were collected from Eucalyptus urophylla stands owned by Anglo Americana plc (CODEMIM), a company situated in the municipality of Niquelândia, Goiás state. Initially a 3P-Weibull probability function was fitted by the percentile method for the aggregate stand. Then models were fitted and selected of stand attributes using residuals plot, residual standard error (syx) and coefficient of determination (R²) as selection criteria. The hypsometric model of Trorey was then used to derive the average height of possible diameter classes, and the taper model of degree 5 and volumetric model of Takata were used to check compatibility of generated volumes. Prognosticated results were consistent with local productivity when compared to previous inventories complied by the same company of stands within the same age group.
Key words: Modeling, stand attributes, implicit models.
UTILIZAÇÃO DA FUNÇÃO WEIBULL PARA PROGNOSE DA PRODUÇÃO POR CLASSE DIAMÉTRICA PARA POVOAMENTOS DE Eucalyptus urophylla
RESUMO: Nesta pesquisa, objetivou-se ajustar a função de densidade de probabilidade Weibull aos dados do povoamento, visando a representar a distribuição do número de árvores por classes de diâmetro bem como ajustar modelos que representem seus atributos para projetar o crescimento e a produção por classe diamétrica e o rendimento dos múltiplos produtos da madeira na idade da rotação adotada pela empresa (sete anos). Os dados provieram de povoamentos de Eucalyptus urophylla da empresa Anglo Americana plc (CODEMIM), localizada no município de Niquelândia no estado de Goiás. Inicialmente foi ajustada a função de probabilidade Weibull três parâmetros pelo método dos percentis, para o povoamento como um todo. Posteriormente, foram ajustados e selecionados modelos dos atributos do povoamento, utilizando-se como critérios de seleção o Gráfico de resíduos, Erro Padrão Residual (syx) e o Coeficiente de Determinação (R²). Em seguida, foi utilizado o modelo hipsométrico de Trorey para obtenção da altura média das possíveis classes diamétricas e utilizado o modelo de afilamento de 5° grau e o modelo volumétrico de Takata, visando à compatibilidade dos volumes por eles gerados. Os resultados prognosticados foram coerentes com a produção do local, quando comparados com inventários já realizados na empresa em povoamento com essa faixa de idade.
Palavras-chave: Modelagem, atributos do povoamento, modelos implícitos.
1Forest Engineer, M.Sc. Professor at Faculdades Integradas de Mineiros/FIMES – Rua 22 s/n, Aeroporto – 75830-000 – Mineiros, GO,
Brazil – [email protected]
2Forest Engineer, Ph.D, CNPq 1A Researcher, Senior Professor of the Departamento de Ciências Florestais – Universidade Federal do
Paraná – 80.210-170 – Curitiba, PR, Brazil – [email protected]
3Forest Engineer, Dr., CNPq 1C Researcher, Senior Professor at Universidade Federal do Paraná/UFPR, Professor at the Departamento
de Engenharia Florestal/UNICENTRO – PR-153, km 7, Riozinho – 84500-000 – Irati, PR, Brazil – [email protected]
4Forest Engineer, Dr. Professor of the Departamento de Ciências Florestais, Universidade Federal do Paraná – 80.210-170 – Curitiba,
PR, Brazil – [email protected] 1 INTRODUCTION
The structure of a forest consists of the distribution of trees and their respective size in relation to a unit area, being a result of species growth patterns, environmental conditions and forest management practices. In studying forest structure, diameter distribution is a basic, widely disseminated and applied tool that constitutes the simplest and most effective way to describe the characteristics of a given stand (BARTOSZECK 2000).
Diameter distribution is an efficient indicator of forest growth and the most powerful way to describe the properties of a stand. The diameter variable is derived from direct measurement of trees and is well correlated to other important variables, including volume, production quality and exploration costs (BAILEY & DELL 1973).
there is an interest in describing diameter frequency distribution by using probability density functions. A probability density function defines the probability associated to each value of the variable in question, or else it can describe the relative and/or absolute frequency distribution of the various tree sizes (CAMPOS & LEITE 2006).
Diameter distribution models can estimate the number of trees per hectare per diameter class at present and future ages. Then the use of a volume, taper or volumetric ratio equation allows estimating yield per diameter class, it being an important tool in situations where multiple wood products are concerned.
The Weibull distribution function was first applied to forest environment by Bailey & Dell (1973). Since then, several works on growth modeling have used the Weibull probability distribution, in Brazil and abroad, due to its efficacy (EISFELD 2004). Péllico Netto (1993) mentioned that its superiority in the large majority of cases is attributed to great flexibility, it being suitable for fitting skewed diameter distributions because its parameters have a correlation with stand variables.
Eucalyptus is the most extensively planted genus in the world, being used in various market segments, and that justifies sustained efforts in pursuing more detailed growth and yield projections with which to prescribe suitable management regimes seeking final product quality and to allow the forest industry to outline a supply plan always seeking to maximize profits.
The objectives of this study include:
- to fit the Weibull probability density function (p.d.f.) using the percentile method for species Eucalyptus
urophylla;
- to estimate growth and yield by diameter class using the cumulative function and models representing attributes for the age interval 5 to 7 years;
- to check compatibility of estimated volume by the volumetric model and the taper model;
- to estimate the yield of multiple wood products for the relevant stand at the scheduled age of technical/ silvicultural rotation.
2 MATERIAL AND METHODS 2.1 Study site
The study site is owned by Grupo Anglo American plc (CODEMIN), a company situated in the municipality of Niquelândia, Goiás state, at an average altitude of 535 m. The local soil, according to Embrapa
classification (1999), is predominantly nonhydromorphic red-yellow latosol with a latosolic B horizon, a low alumina/silica molar ratio, below 1.9, and color shifting from red to yellow with in-between shades. They usually are very deep or deep, with sequential A, B and C horizons and diffuse, gradual transitions between subhorizons, notably well drained. They are mostly alic, which means the percentage of aluminum saturation is above 50%, potentially reaching around 95%. They present medium texture and flat to rugged relief.
The local climate is Aw, according to Köppen classification, which is typical of tropical wet conditions, with two very defined seasons—dry winters, from May to August, and wet summers, from October to March—, and an average annual temperature of 28°C.
2.2 Stand database
Information from local forest inventory for ages three and five years, along with silvicultural data (initial density, survival) were the chief constituents to make the projection of stand attributes necessary to make the prognosis per diameter class.
21 permanent rectangular plots were used, each with 480 m². The experimental procedure used in two years of measurements was simple random sampling.
Information was collected from each sampling unit concerning: diameter at breast height (DBH), total height (Ht) and height of dominant trees (Hdom), according to Assmann description (1961).
2.3 Site classification
The forest sites were classified using curves developed by Miguel et al. (2008).
2.4 Fit of Weibull density function
96 MIGUEL, E. P. et al.
The location parameter in all three fit methods is an independent term that must be known prior to obtaining the scale and shape parameters.
The 3-P Weibull distribution used is represented as follows: c c b a x b a x b c x
f( ) * *exp
1
where:
a = location parameter; b = scale parameter; c = shape parameter;
x = variable of interest (diameter class midpoint).
The method chosen to fit the Weibull function was the percentile method, considering the 30 and 90 percentile diameters, according to several authors who worked with this type of modeling for forest stands, including Scolforo (1998).
With the ‘a’ parameter defined, which represents the smallest measured diameter in the stand, the other parameters are obtained as follows:
a X a X Ln p Ln p Ln c p
p1 2
2 1 / 1 / 1 c p p Ln a X
b 1/
1 1
1
where:
Xp1 = percentile diameter 1; Xp2 = percentile diameter 2; p1= percentile 1;
p2 = percentile 2; Ln = natural logarithm.
With the Weibull distribution coefficients derived, it is possible to describe the theoretical frequency and compare it to the observed frequency in the different diameter classes. A Kolmogorov (1933) nonparametric goodness-of-fit test was used to compare observed frequency with cumulative frequency. There being divergence between these two distributions, a comparison is made between the test D-value and a tabulated D-value, allowing to check if the distribution provides goodness-of-fit.
Let F0 (X) be a theoretical cumulative distribution
and Sn(X) an observed distribution in a sample of ‘n’
observations. The maximum difference (D) between F0 (X)
and Sn(X) is given as follows:
) ( ) (
max F0 X S X
D n
2.5 Selecting models of stand attributes
Estimating stand attributes such as basal area, minimum diameter, maximum diameter, average diameter, XP1 and XP2 percentile diameter, survival, along with the Weibull distribution, is a necessary step to make a projection of the number of individuals for the reference age (seven years). According to Schneider et al. (1988) and Souza (1999), this is the average rotation age for Eucalyptus in Brazil and is also the age of choice here. A number of models were developed for each attribute and the equations providing the best fit and accuracy statistics were then selected using the coefficient of determination (R².adj) and standard error of estimate for the variable of interest (syx) and in percentage (syx%) to express each attribute. These models were also tested and applied by Abreu et al. (2002), Scolforo & Machado (1996) and Thiersch (2002), and are presented in Scolforo (2006). The models to predict minimum diameter, maximum diameter, average diameter and 30 and 90 percentile diameters were derived using the Stepwise regression analysis procedure.
2.6 Growth and yield projection
Based on estimations of the above attributes using hypsometric, volumetric and taper models, a projection of growth and yield can be made in different diameter classes, following the next steps:
a) With the estimated parameters for the Weibull distribution function, the probability of trees occurring in each diameter class was determined. The product of this probability and the estimated number of surviving trees in the reference year allowed estimating the number of trees in each diameter class.
b) Having the number of trees in each diameter class, with the selected hypsometric equation, it was possible to obtain the total height of trees according to each diameter class midpoint value.
Table 1 – Specification of multiple wood products for Eucalyptus urophylla.
Tabela 1 – Especificação dos múltiplos produtos da madeira para o Eucalyptus urophylla.
3 RESULTS AND DISCUSSION 3.1 Forest Inventory
Characteristics and statistics of the stand at age 5 years are illustrated in Table 2, based on analysis of the 21 reference permanent plots.
Table 2 – Characteristics and statistics of the Eucalyptus urophylla stand.
Tabela 2 – Características e estatísticas da povoamento de Eucalyptus urophylla.
S.U.: sampling unit; DBH: diameter at breast height (1.3m); Dmin: minimal diameter, Dmax: maximum diameter.
Results of estimated total volume with bark were found compatible with other inventories of the company in previous years, or in existing literature, according to works of Scolforo (1998) in northern Minas Gerais state, a region with similar soil types where the average annual growth (IMA) of Eucalyptus urophylla stands ranges from 25 to 50
m³. In this study, the IMA value was around 27 m³/ha. 3.2 Fit of Weibull distribution
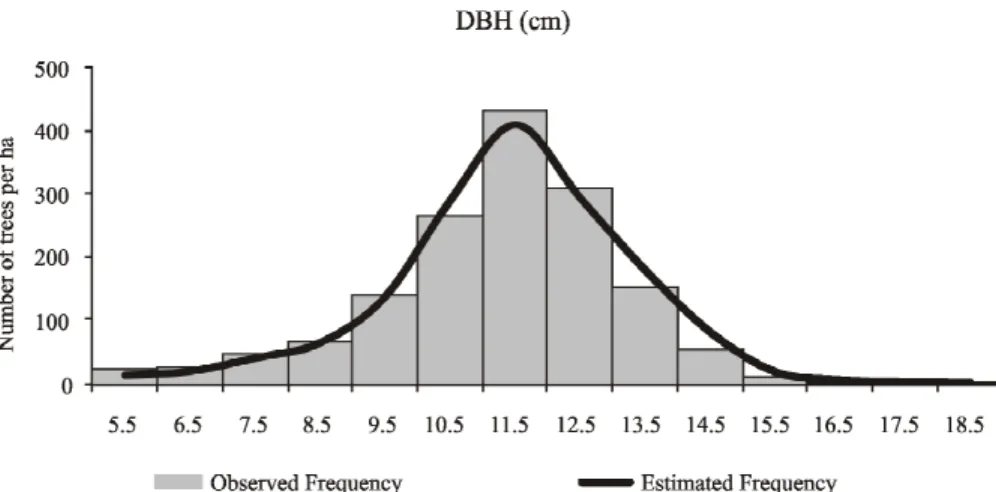
The observed and estimated frequencies by the Weibull function (estimated a, b and c of 5.03, 4.71 and 7.61 respectively) are presented in Figure 1, for age 5 years.
The fit of the Weibull function was suitable to estimate the number of trees per diameter class by the Kolmogorov-Smirnov test, having in mind that the calculated value (0.031) was less than the tabulated D-value (0.035) for = 0.05, an indication of goodness-of-fit of the model to the data.
3.3 Prognosis of growth and yield
The prognosis of growth and yield was based on the 3-P Weibull function as defined by the percentile method, and selected equations to express attributes constituting the basis of yield modeling by diameter class are illustrated in Table 3.
To estimate survival, the model proposed by Lenhart (1971) was selected. The basal area model presented satisfactory statistics, with unbiased estimation of the variable about the regression line, as with the models predicting minimum diameter, maximum diameter, average diameter, and 30 and 90 percentile diameters. All selected equations presented satisfactory statistics, with no over- or underestimation of the variables, which means they can be used without harm or implications for the estimations.
To estimate total height, the model proposed by Trorey (1932) was selected due to its better statistics. To estimate
Small-end diameter (cm) Length (m) Market
25 4.0 Sawn wood
18 2.8 Pallets
7 2.6 Pulp
< 7 - Energy
Characteristics/statistics
Inventory Area (ha) 243
S.U. size (m²) 480
Initial Density 1666
No. of Possible S.U. (N) 5062
Admissible Error (%) 10
No. of Allocated S.U. 21
Average DBH (cm) 11.30
Average Height (m) 19.86
Dmin (cm) 5.00
Dmax (cm) 18.62
Average Individuals / ha 1550
Average mortality 116
Average volume per S.U. (m³) 6.3161
Standard Deviation of Volume per S.U. (m³) 0.5681 Standard Error of Mean per S.U.(m³) 0.1230 Standard Error of Mean per S.U. (%) 1.95
Coefficient of Variation (%) 9.00
Volume per Hectare (m³) 131.5855
Sampling Error (m³) 0.2573
Sampling Error (%) 5.53
Lower Confidence Interval per ha (m3) 125.0025
98 MIGUEL, E. P. et al.
Figure 1 – Observed and estimated diameter distribution by the 3-P Weibull Function.
Figura 1 – Distribuição diamétrica observada e estimada pela Função Weibull 3 parâmetros.
Attributes Selected equations R² adj. syx syx(%)
Site 23.6772*1 exp 30.1997* 0.0140213
Id
Hdom 0.85 1.18 m 6.31
Survival 1 2 1 2 1
2 *exp 0.0602076* 0.0844695* LnId LnId Id
Id N
N 0.96 20.0 tree 1.37
Basal Area G 631.022 9.1375*Hdon 0.0770259*N 93.9344*Ln(N) 0.94 0.86 m² 5.73
Dmin
N Hdon
Id
Dmin 33.7934 6.14222* 0.3961* 9902.8* 1 0.89 0.52 m 9.09
Dmax Dmax 7.7165 0.0598148*Hdom 0.92 1.22 m 8.22
Dmed Dmed 9.25251 0.0040878*N2 0.147689*G2 0.27483*Hdon2 0.96 0.20 m 1.84
Dp30 (030.0752312.86731* max)(0.00016034(0.8156 ** 2) ) Dmed D
N Dp
0.86 0.13 cm 1.27
Dp90 (090.318755.*3748max)(0.00015079(1.0182 ** 2)) Dmed D
N Dp
0.92 0.20 cm 1.55
Hypsom. Mod. Ht 2.9604022 (1.96985*DAP) ( 0.045685*(DAP2)) 0.758 1.20 m 6.40
Takata Mod. ) * 975966 . 10 ( 2422041 . 29466 * 2 DAP Ht DAP
Vt 0.988 0.0044m³ 8.86
Taper Model 4 5
3 2 7912 . 10 * 7884 . 28 * 9369 . 28 * 0994 . 13 * 34565 . 3 118505 * Ht h Ht h t H h Ht h Ht h DAP d i i i i i
i 0.9875 0.008 m³ 8.85
Table 3 – Equations expressing attributes of the Eucalyptus urophylla stand in northern Goiás state.
Tabela 3 – Equações que expressam os atributos do povoamento de Eucalyptus urophylla para região norte do estado de Goiás.
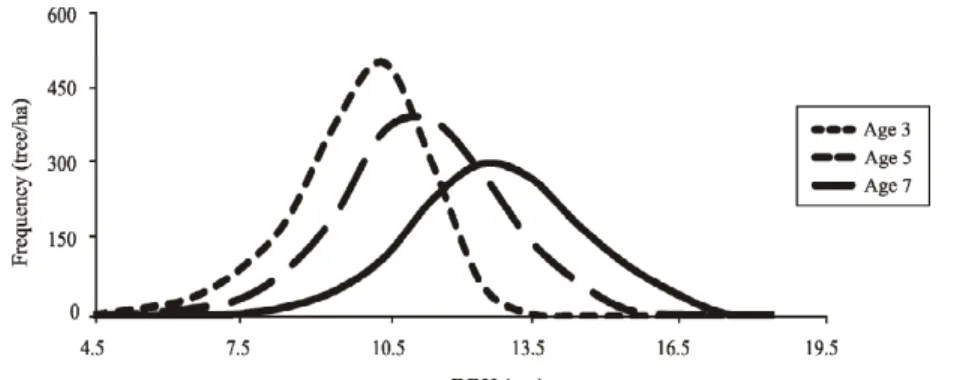
Figure 2 – Diameter evolution in the Eucalyptus urophylla stand, aspredicted by the Weibull function, from year three to year five and then to year seven.
Figura 2 – Evolução diamétrica do povoamento de Eucalyptus urophylla, predito pela Função Weibull, do ano três, para o ano cinco e posteriormente para o ano sete.
Table 4 – a, b and c coefficients of the Weibull function by site at the projected age.
Tabela 4 – Coeficientes a, b e c da Função Weibull por sítio na idade projetada.
Parameters Site I Site II Site III
a 7.39 6.34 5.52
b 8.68 5.91 6.91
c 5.86 3.21 4.00
volume, the model proposed by Takata (1959) was selected for its good statistics and unbiased dispersion of residuals. And lastly, the selected taper model was the polynomial model of degree 5 as proposed by Schöepfer (1966).
3.4 Prognosis of number of individuals per diameter class Using equations relating to stand attributes and site classification it was possible to project attributes for age 7 and, so, with the Weibull probability distribution by the percentile method the diameter structure was estimated for age three (3), then for age five (5) and then the structure for age seven (7) was projected. Figure 2 illustrates the evolution of tree frequency by diameter class over the years.
As can be observed in Figure 2, the distribution curve of individuals frequency by diameter class becomes flatter as age increases, and with it the mean shifts to the right, representing a reduction in density yet with larger diameters and thus higher volumetric yield.
To improve volumetric estimators for the projected age (age seven), the diameter distribution of the stand, as described by the Weibull function, was fitted according to site yield level. In each site (three), location (a), scale (b),
and shape (c) coefficients of the Weibull p.d.f. were derived by the percentile method for the projected age (7), whose values are illustrated in Table 4.
With the a, b and c parameters estimated, the occurrence probability of the number of individuals per diameter class was derived, which, multiplied by the number of trees (N), together with the class range in the reference age, allows obtaining the estimated frequency per site in each class based on the minimum diameter, as illustrated in Table 5.
With the number of trees per class obtained by the Weibull probability function, together with the diameter class midpoint value, and the adjusted hypsometric relationship it is possible to obtain the average height of the diameter class. The volume can be thus obtained by diameter class in different sites using a volume model, or using a taper function.
100 MIGUEL, E. P. et al.
Table 5 – Estimation of number of trees per hectare at age 7 per DBH class and per site.
Tabela 5 – Estimativa do número de árvores por hectare aos 7 anos por classes de DAP e por sítio. Number of trees per hectare DBH class midpoint value (cm)
Site I Site II Site III
6.5 - - 2
7.5 6 10 19
8.5 20 75 64
9.5 45 130 140
10.5 67 210 233
11.5 80 230 300
12.5 200 273 294
13.5 250 180 210
14.5 360 110 101
15.5 310 101 31
16.5 160 89 5
17.5 35 49 0
18.5 3 22 0
19.5 2 1 0
20.5 1 - 0
21.5 - - 0
Total 1540 1479 1400
function of DBH (diameter at breast height) and Ht (total height), multiplied by the likely number of trees in each diameter class as projected by the Weibull function.
It can be noted from Tables 6, 7 and 8 that the volumes projected for year seven by the volumetric model of Takata and by the taper model of degree 5 for different sites are very close, despite invariably larger volumes being provided by the taper model in different diameter classes in the three sites, around 3% more, not affecting model compatibility. According to the Student’s t-test, in site I the calculated t 0.05 value was 0.064 and the tabulated value was 2.160, while in site II the calculated t 0.05 value was 0.111 and the tabulated value was 2.178, and in site III the calculated t 0.05 value was 0.051 and the tabulated value was 2.228. It is thus clear that no significant difference exists in deriving volume, regardless of the model used. 3.5 Yield estimations of multiple products
Criteria for definition of multiple products are illustrated in Table 1. Results obtained with prognosis by diameter class and with the taper functions fitted for each site separately
allowed estimating possible total volume with bark to be yielded in each site for each product at age seven, as is illustrated in Figure 3.
Site I had a total volume with bark yield of 223.8996 m³/ha, at age seven, 150.1314 m³ of which can be destined for pulp production and 73.7682 m³ for energy production.
Products such as sawn wood and pallets could not be obtained due to the small-end diameter being less than the minimum requirement, reached only in later ages.
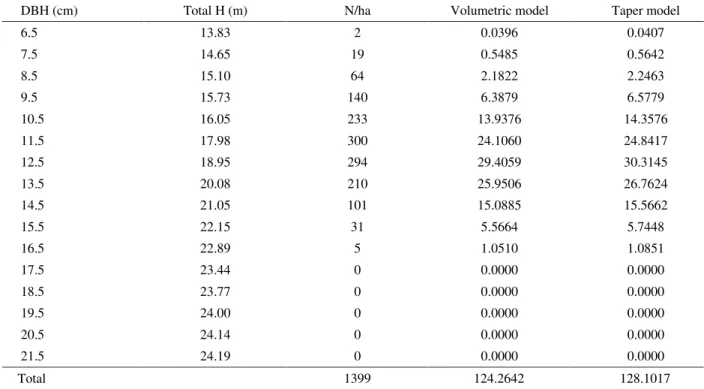
Site II had a total volume with bark yield of 165.8957 m³/ha, 111.6337m³ of which can be destined for pulp, and 54.2320m³ for energy production. And lastly, site III had a total volume with bark yield of 128.1017 m³/ha, 88.3717m³ of which can be used in pulp production and 32.7299m³ can be used in energy production.
Table 6 – Volume projected for year 7 per DBH class, using the Takata model and the polynomial of degree 5, in Site I.
Tabela 6 – Volume projetado para o ano 7 por classes de DAP, pelo modelo volumétrico de Takata e pelo polinômio do 5° grau, para o Sítio I.
N/ha: number of trees per ha
Table 7 – Volume projected for year 7 per DBH class, using the Takata volumetric model and the polynomial of degree 5, in Site II.
Tabela 7 – Volume projetado para o ano sete por classes de DAP, pelo modelo volumétrico de Takata e pelo polinômio do 5° grau, para o Sítio II.
N/ha: number of trees per ha
DBH (cm) Total H (m) N/ha Volumetric model Taper model
6.5 13.83 0 0.0000 0.0000
7.5 14.65 7 0.1732 0.2078
8.5 15.10 21 0.6819 0.7370
9.5 15.73 46 2.0533 2.1613
10.5 16.05 67 4.0078 4.1286
11.5 17.98 80 6.4283 6.6244
12.5 18.95 200 20.0040 20.6221
13.5 20.08 250 30.8936 31.8602
14.5 21.05 360 53.7807 55.4830
15.5 22.15 310 55.6639 57.4478
16.5 22.89 158 33.2112 34.2883
17.5 23.44 34 8.2300 8.4994
18.5 23.77 3 0.8225 0.849902
19.5 24.00 2 0.6150 0.6356
20.5 24.14 1 0.3417 0.3533
21.5 24.19 0.0000 0.0000
Total 1539 216.9071 223.8996
DBH (cm) Total H (m) N/ha Volumetric model Taper model
6.5 13.83 0 0.0000 0.0000
7.5 14.65 10 0.2887 0.2969
8.5 15.10 75 2.5573 2.6323
9.5 15.73 130 5.9316 6.1081
10.5 16.05 210 12.5618 12.9401
11.5 17.98 230 18.4813 19.0453
12.5 18.95 273 27.3055 28.1492
13.5 20.08 180 22.2434 22.9392
14.5 21.05 110 16.4330 16.9533
15.5 22.15 101 18.1357 18.7168
16.5 22.89 89 18.7076 19.3143
17.5 23.44 49 11.8608 12.2491
18.5 23.77 22 6.0316 6.2326
19.5 24.00 1 0.3075 0.3178
20.5 24.14 0 0.0000 0.0000
21.5 24.19 0 0.0000 0.0000
102 MIGUEL, E. P. et al.
Table 8 – Volume projected for year 7 per diameter class, using the Takata volumetric model and the polynomial of degree 5, in Site III.
Tabela 8 – Volume projetado para o ano 7 por classe diamétrica, pelo modelo volumétrico de Takata, e pelo modelo de afilamento do Polinômio do 5° Grau, para o Sítio III.
DBH (cm) Total H (m) N/ha Volumetric model Taper model
6.5 13.83 2 0.0396 0.0407
7.5 14.65 19 0.5485 0.5642
8.5 15.10 64 2.1822 2.2463
9.5 15.73 140 6.3879 6.5779
10.5 16.05 233 13.9376 14.3576
11.5 17.98 300 24.1060 24.8417
12.5 18.95 294 29.4059 30.3145
13.5 20.08 210 25.9506 26.7624
14.5 21.05 101 15.0885 15.5662
15.5 22.15 31 5.5664 5.7448
16.5 22.89 5 1.0510 1.0851
17.5 23.44 0 0.0000 0.0000
18.5 23.77 0 0.0000 0.0000
19.5 24.00 0 0.0000 0.0000
20.5 24.14 0 0.0000 0.0000
21.5 24.19 0 0.0000 0.0000
Total 1399 124.2642 128.1017
N/ha: number of trees per ha
Figure 3 – Volumetric yield of possible commercial products in a Eucalyptus urophylla stand at age seven.
order to obtain larger-sized pieces, thinning becomes a highly recommended practice.
4 CONCLUSIONS
The fit of the Weibull probability density function by the percentile method at the point of maximum difference between observed and theoretical curves provided satisfactory goodness-of-fit when submitted to the nonparametric Kolmogorov-Smirnov test for ( = 0.05).
Growth and production estimations for the Eucalyptus urophylla stand in northern Goiás are consistent with other
inventories conducted in similar areas, and with previous inventories conducted by the company subject of this study. The t 0.05 values showed no significant difference in obtaining the total volume variable regardless of the model being used, taper or volumetric.
In none of the three sites was it possible to obtain timber for sawn wood or pallets, due to larger small-end diameter requirements that the age in question was unable to meet, or perhaps because of local yield characteristics.
5 BIBLIOGRAPHICAL REFERENCES ABREU, E. C. R.; SCOLFORO, J. R. S.; OLIVEIRA, A. D.; MELLO, J. M.; KANEGAE, H. J. Modelagem para prognose precoce do volume por classe diamétrica para Eucalyptus grandis. Revista Scientia Forestalis, Piracicaba, n. 61, p. 86-102, jun. 2002.
ASSMANN, E. Waldertragskunde. Muenchen: BLV Verlagsgessellschaft, 1961. 435 p.
BAILEY, R. L.; DELL, T. R. Quantilying diameters distribuitions with the Weibull function. Forest Science, Bethesda, v. 19, n. 2, p. 27-104, June 1973.
BARTOSZECK, A. C. P. S. Evolução da relação hipsométrica e da distribuição diamétrica em função dos fatores idade, sítio e densidade inicial em Bracatingais nativos da região metropolitana de Curitiba. 2000. 83 f. Dissertação (Mestrado em Ciências Florestais) - Universidade Federal do Paraná, Curitiba, 2000.
CAMPOS, J. C. C.; LEITE, H. Mensuração florestal: perguntas e respostas. 2. ed. rev. e ampl. Viçosa, MG: UFV, 2006. 470 p.
EISFELD, R. L. Modelagem do crescimento e da produção de Pinus taeda L. por meio de função probabilística e processo de difusão. 2004. 67 f. Dissertação (Mestrado em manejo Florestal) - Universidade Federal do Paraná, Curitiba, 2004.
EMPRESA BRASILEIRA DE PESQUISA AGROPECUÁRIA. Centro Nacional de Pesquisa de Solos. Sistema brasileiro de classificação de solos. Brasília, 1999. 412 p.
KOLMOGOROV, A. N. Sulla determinazione empirica di una legge di distribuzione. Moscow: Inst. Ital. Attuari, 1933. 11 p.
LENHART, J. D. Site index curves for old-field loblolly pine plantations in the interior wets gulf coastal plain. Austin: Austin State University, 1971. (Paper, 8).
MIGUEL, E. P.; MACHADO, S. A.; FIGUEIREDO FILHO, A.; ARCE, J. E. Classificação dos sítios florestais para povoamentos de Eucalyptus urophylla na região norte do estado de Goiás. In: SIMPÓSIO LATINO-AMERICANO SOBRE MANEJO FLORESTAL: PRODUÇÃO DE BENS MATERIAIS E IMATERIAIS, 4., 2008, Santa Maria. Anais... Santa Maria: UFSM/CCR, 2008. p. 88-94.
PÉLLICO NETTO, S. Biometria, teoria de probabilidades. Curitiba: [s.n.], 1993. 278 p.
SCHNEIDER, P. R.; BRENA, D. A.; FINGER, C. A. G. Manual para a coleta de informações dendrométricas. Santa Maria: CEPEF/FATEC/UFSM, 1988. 28 p. (Série Técnica, 8).
SCHOEPFER, W. Automatisierung dês massen, sorten und wertberechung stender waldbestande schriftenreihe bad. Berlin: Wurtt-Forstl, 1966. No page.
SCOLFORO, J. R. S. Modelagem do crescimento e da produção de florestas plantadas e nativas. Lavras: UFLA/ FAEPE, 1998. v. 1, 443 p.
SCOLFORO, J. R. S. Biometria florestal: modelagem do crescimento e da produção de florestas plantadas e nativas. Lavras: UFLA/FAEPE, 2006. 393 p.
SCOLFORO, J. R. S.; MACHADO, S. A. Um sistema de crescimento e produção com simulador de desbaste. Scientia Forestalis, Piracicaba, n. 50, p. 51-64, dez. 1996.
SOUZA, A. N. Estudo econômico da reforma de povoamentos de Eucalyptus spp.: o caso do progresso tecnológico. 1999. 140
104 MIGUEL, E. P. et al.
TAKATA, K. Study of the volume estimate by basal area at breast height. Journal of the Japan Forest Society, Tokyo, v. 39, n. 7, p. 315-325, 1957.
THIERSCH, C. R. Modelagem da densidade básica, do volume e do peso seco para plantios de clones de Eucalyptus
sp. 2002. 197 p. Dissertação (Mestrado) - Universidade Federal de Lavras, Lavras, 2002.