ISSN 2179-8087 (online)
Original Article
Forest Management
Creative Commons License. All the contents of this journal, except where otherwise noted, is licensed under a Creative Commons Attribution License.
Prediction System for Diameter Distribution and Wood
Production of Eucalyptus
Rodrigo Miranda
1, Luan Fiorentin
2, Sylvio Péllico Netto
2, Ronie Juvanhol
3,
Ana Dalla Corte
21Universidade Estadual do Centro-Oeste – UNICENTRO, Irati/PR, Brasil 2Universidade Federal do Paraná – UFPR, Curitiba/PR, Brasil 3Universidade Federal do Espírito Santo – UFES, Jerônimo Monteiro/ES, Brasil
ABSTRACT
The aim of the present study was to propose a prediction system to estimate the diameter distribution and wood production in unthinned eucalyptus clone plantations. Data was obtained from permanent sample units, with ages from 28 to 78 months. The Weibull distribution was used to estimate the frequency of the number of trees per diameter class. Models were used to relate the Weibull distribution coefficients with forest stand attributes. The forest stand variables most correlated with the Weibull distribution parameters were the minimum, medium, maximum and quadratic diameters and the dominant height. The projected frequency of tree numbers and the production by diameter class obtained by the system of equations did not differ statistically from the observed values evaluated by the t-test at 95% probability.
1. INTRODUCTION
Diameter distribution is an indicator of stock growth structure and allows us to draw effective conclusions regarding forest structure (Loetsch et al., 1973), which constitutes basic knowledge for forest management and helps to monitor forest resource dynamics (Hosokawa et al., 2008). According to Binoti et al. (2014), the description of the frequency observations by diameter class is performed using probability density functions (pdf).
Among the most common probability density functions in forest management, the Weibull stands out due to its relative simplicity and flexibility when representing different distribution trends (Bailey & Dell, 1973; Duan et al., 2013). The main advantage of using it is that its parameters are easily correlated with stand variables, which makes it possible to calculate them for future ages, in addition to being useful in studies on forest growth and production (Nokoe & Okojie, 1984; Soares et al., 2010).
A pdf is the main tool to model forest stand structure in uneven-aged and heterogeneous forests (Nascimento et al., 2012). There are many methods that can be used to estimate pdf parameters (Piqué-Nicolau et al., 2011), but they depend on the required accuracy and, according to Binoti et al. (2011), the fitted distribution. The maximum likelihood estimation method is the most suitable to adjust the Weibull distribution since the computational procedures optimize the parameter estimation process (Araújo et al., 2010).
Diameter distribution estimates can be realized using prediction or projection models (Leite et al., 2013). In the first case, the parameters of the selected statistical distribution are correlated with stand parameters (Clutter et al., 1983). This method is known as the parameter prediction method (PPM) (Kangas & Maltamo, 2000). In the second case, a method known as parameter recovery method (PRM) (Kangas & Maltamo, 2000), the statistical distribution parameters are estimated based on the same parameters obtained at a previous age (Leite et al., 2005).
Regardless of the category, these models were mostly used to predict the diametric distribution in stands with species of the genus Pinus, managed for long cycles and for multiple-use woods (assortments). By contrast, these models have rarely been applied
in eucalyptus stands. Thus, the present study was developed with the hypothesis that the proposed prediction system might generate accurate estimates for a certain number of trees and volume per hectare for clonal Eucalyptus sp. stands.
Therefore, the objective of the present study was to propose a prediction system to estimate the diameter distribution and wood production in unthinned Eucalyptus sp. stands.
2. MATERIAL AND METHODS
The database was taken from permanent sample units of a continuous forest inventory from 2007 to 2010, in stands of hybrid Eucalyptus grandis W. Hill ex Maiden x Eucalyptus urophylla S. T. Blake. The stands are located in the northeastern region of the state of Bahia, Brazil, with an initial average density of 1,111 trees per hectare.
Circular plots were used, with 12.25 m radius, randomly distributed, with an average sampling intensity of one plot per 12.5 hectares. The diameters at breast height with bark of all trees (d at 1.3 m from the ground), the total height (TH) of the first 15 trees and the total height of the five dominant ones (hdom) were measured in the plot. From seventy-one sample units, 48 were used for fitting and 23 for validation of the models. The ages ranged from 28 to 78 months. The synthesis of data used is presented in Table 1.
The hypsometric model was adjusted for data pairs of total height and diameter at breast height collected in the plots, as well as to data pairs of scaled trees using the Smalian’s method to fit the volume equations. In total, 48 trees were scaled. The general equation (Equation 1) of total height per tree, as used by Ribeiro et al. (2010), resulted in an adjusted coefficient of determination – R2
adjusted = 0.94 and standard error of the estimate in percentage – Syx = 4.9%.
( ) ( 1) ( )1 ( )1
0.625592 0.846527 lnhdom 0.301131lnd dg 10.360175I d 3.323486d ht e
− −
−
+ − + −
= (1)
To estimate the total tree height in the central diameter class (hc), the parabolic model was used (Equation 2) (R2
adjusted = 0.63; Syx = 11.9%). The equation for individual volume per tree (Equation 3) was based on the Schumacher-Hall’s model, as reported by Leal et al. (2015) (R2
adjusted = 0.99; Syx = 6.9%).
2
4.1992 0.9625 0.0080
(10.1301 1.7935 lnd 1.14366 lnht)
v=e− + + (3)
The Richards biological model, adjusted by Rodríguez-Carrillo et al. (2015), was used to study the dominant height and age relationship (Syx = 13.5%). Based on this model, the expression for a definition of site classes (S) per plot was obtained (Equation 4), adopting 60 months as the age index (Ii). Three productivity site classes were defined: high (class 1: hdom > 25.9), medium (class 2: 21.3 < hdom ≤ 25.9 m) and low (class 3: hdom ≤ 21.3 m). Where: I = age (months); dc = tree diameter of the central diameter class; h, hdom, S, Ii, hc, dg and d = as previously defined, ln = Napierian logarithm; e = exponential. For all these equations, the coefficients were significant (p-value < 0.05).
( )
( )
1.169803
0.030015 0.030015
1
1
i I I
e S hdom
e
−
−
−
=
−
(4)
To project the diameter distribution, the parameter prediction method (PPM) was used (parameter estimation). In this method, the coefficients of the selected probability density function (pdf) were correlated with parameters of the forest stand, generating equations to estimate them at a future age. The pdf used was the three-parameter Weibull distribution (Wendling et al., 2011) described in Equation 5, where “a” is the location parameter, “b” the scale parameter, “c” the form parameter, and xi is the diameter at breast height (d), in which: a ≤ xi ≤ ∞, a ≥ 0, b > 0 and c Table 1. Minimum, medium and maximum values of the main variables for Eucalyptus sp. stands in northeastern Bahia, Brazil.
Variable
2007 2008 2009 2010
Site classes (m)
1 2 3 1 2 3 1 2 3 1 2 3
dmin 5.5 5.7 6.5 5.3 6.5 6.2 5.4 6.9 8.5 5.8 6.9 8.5
dmed 13.4 12.9 11.5 14.5 13.8 12.3 15.3 14.6 12.9 16.0 15.4 13.8
dmax 19.8 19.0 16.5 22.0 21.2 16.7 23.5 23.8 17.7 24.5 24.6 19.8
CV% 12.3 7.1 8.9 9.9 6.7 8.0 8.0 7.3 8.4 6.9 7.0 7.4
hmin 13.2 9.3 10.5 12.5 9.9 10.5 10.4 11.0 11.3 12.9 11.9 13.0
hmed 20.3 18.1 14.7 22.7 19.8 16.1 24.2 21.2 17.3 26.3 23.0 19.2 hmax 27.0 23.6 20.2 29.8 25.8 20.8 31.2 29.3 22.5 36.3 29.0 23.8
CV% 12.0 9.5 12.4 9.2 9.5 14.5 9.3 11.0 11.6 10.3 8.3 8.5
hdommin 18.2 15.2 12.9 20.5 17.8 13.3 21.5 18.8 14.9 24.0 21.1 17.9 hdommed 21.2 18.7 15.3 23.9 20.7 16.8 25.7 22.2 18.0 28.0 24.2 20.3 hdommax 26.7 23.0 19.9 28.8 24.3 20.1 29.8 27.3 21.9 33.8 27.8 22.5
CV% 13.0 9.6 12.2 9.5 9.0 13.1 9.9 10.4 11.8 10.2 8.2 8.4
dgmin 11.4 11.0 10.3 12.4 11.6 11.0 13.4 12.2 11.4 14.2 12.7 12.2
dgmed 13.4 13.0 11.5 14.5 13.9 12.4 15.4 14.7 13.0 16.1 15.5 13.9
dgmax 16.0 15.1 13.7 17.5 16.1 14.4 18.3 17.2 15.6 18.8 17.3 16.8
CV% 12.3 7.0 9.0 9.9 6.7 8.0 8.0 7.4 8.5 6.9 7.1 7.5
Gmin 9.6 8.7 7.7 11.5 9.1 8.8 12.7 6.1 8.9 13.5 4.7 7.4
Gmed 14.4 12.9 10.4 15.9 13.4 11.1 17.3 13.9 11.6 18.4 14.3 12.1 Gmax 23.4 18.5 15.0 25.8 18.8 15.4 27.1 20.9 16.8 27.5 21.1 17.6 CV% 25.8 20.8 18.0 22.9 22.7 15.1 17.3 26.6 17.6 17.4 29.8 21.2
Nmin 785 700 742 742 636 679 742 636 658 721 636 658
Nmed 982 952 987 928 870 942 905 841 913 888 823 882
Nmax 1,167 1,188 1,145 1,103 1,124 1,124 1,061 1,082 1,103 1,061 1,061 1,103
CV% 6.8 11.5 10.9 7.8 16.1 14.6 7.6 20.3 17.6 11.8 27.0 25.1
Where: d = diameter at breast height (cm); h = total height (m); hdom = dominant height (m); dg = quadratic diameter (m); G = basal area (m2.ha-1); N = number of trees (tree.h-1); min, med and max = minimum, average and maximum values of each variable,
> 0. The maximum likelihood estimation method (Araujo et al., 2010) was used to obtain the coefficients.
( ) 1
c i x a c
b i
x a c
f x e
b b
− − −
−
= (5)
The location parameter (a) was independently obtained. The solver adds Microsoft Excel was used to optimize the parameter “a”, whose selected value was that which minimized the sum of squares of the difference between the observed and estimated frequency. The amplitude of the diameter classes used was 2 cm. Kolmogorov-Smirnov’s test (KS test) was applied to analyze the adherence of diameter distributions in each permanent sample plot at all ages (Téo et al., 2012).
Survival estimates in forest stands were evaluated using data from the permanent sample plots. For the adjustment of the models, failures in the stands were disregarded. The models used (6, 7, 8 and 9) are presented in Table 2 and can be found in Retslaff et al. (2012).
For the selection of the variables to be used when modeling the coefficients of the Weibull distribution, a preliminary analysis was performed on the correlation matrix. The variables most correlated with the coefficients were subjected to the stepwise process, characterizing the finally adjusted models (12, 14 and 15). Furthermore, models from the literature were tested (10, 11 and 13) (Table 3).
Equations for projection of stand attributes were selected, which are the independent variables of the models for parameters “b” and “c” of the Weibull distribution. The equations were defined from linear relationships of variables based on the simple linear correlation matrix (Equations 16, 17, 18, 20, 21, 22, 24, 25, 26, 28 and 29), in addition to the application of some models found in the literature (Equations 19, 23, 27, 30 and 31) (Table 4). For evaluation and selection of models, the adjusted coefficient of determination (R2
adjusted) and the standard error of the estimate in percentage (Syx%) were used
Table 2. Survival models tested for Eucalyptus sp. stands in northeastern Bahia, Brazil.
Equation Model Model Formulation
(6) Pienaar and Shiver ( ) ( )
(
2 2)
2 1 1 2 1
ln N =ln N −β Iβ −Iβ
(7) Clutter
(
1)
1 (0 22)(2 1)2 1 1.2
S I I
N =N I I− β eβ β+ −
(8) Lenhart 1(2 1) 2(ln(2 11))
2 1
I I I I
N N eβ β
−
− +
=
(9) Clutter and Jones
(
)
13 3
1
1
2 1 2 2 1
N Nβ β Iβ Iβ β
−
= + −
Where: N2 and N1 = number of trees at future and current ages, respectively (N.sample-unit-1); I
2 and I1 = future and current age,
respectively (months); S2 = site index at future age; βi = coefficients to be estimated; ln = Napierian logarithm.
Table 3. Models tested to estimate Weibull distribution parameters (b and c) in Eucalyptus sp. stands in northeastern Bahia, Brazil.
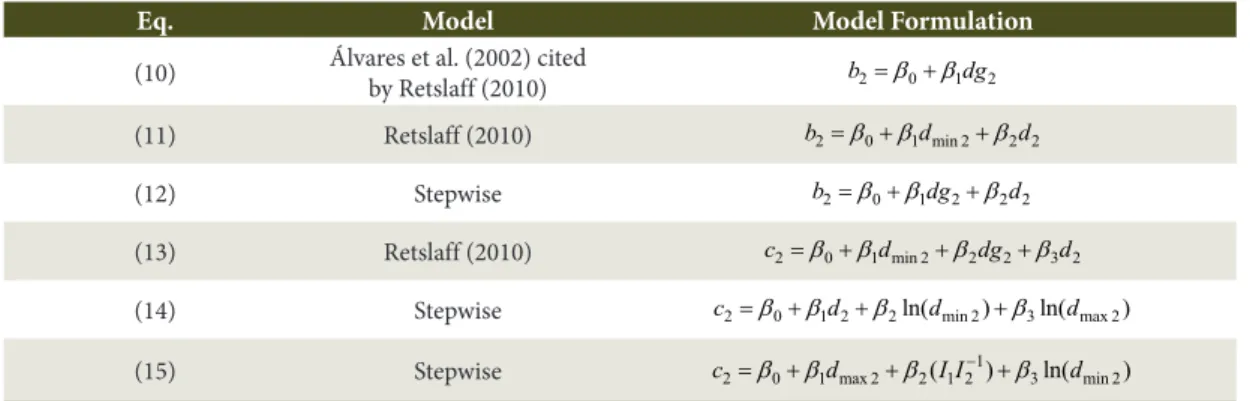
Eq. Model Model Formulation
(10) Álvares et al. (2002) cited
by Retslaff (2010) b2=β0+β1dg2
(11) Retslaff (2010) b2=β0+β1 min 2d +β2 2d
(12) Stepwise b2=β0+β1dg2+β2 2d
(13) Retslaff (2010) c2=β0+β1 min 2d +β2dg2+β3 2d
(14) Stepwise c2=β0+β1 2d +β2ln(dmin 2)+β3ln(dmax 2)
(15) Stepwise 1
2 0 1 max 2 2(1 2 ) 3ln( min 2)
c =β +βd +β I I− +β d
Where: b2 = Weibull distribution scale parameter at future age; c2 = Weibull distribution form parameter at future age; d2 = average diameter at future age (cm); dg2 = quadratic diameter at future age (cm); dmin2 = minimum diameter at future age (cm); βi = coefficients
(Tonini & Borges, 2015). The parameter estimates had their significance evaluated by p-value (p-value < 0.05). In cases where the coefficient was not significant, the variable associated with it was disregarded and the model readjusted.
The selected equation system was applied for the validation of the database. Weibull distribution coefficients and the diameter distribution were used to evaluate the effectiveness when estimating the forest stand attributes for different ages and sites. Distributions were evaluated by KS test (95% probability). According to Lei (2008), it is important that the probability density function estimates are compared to the observed values, because the estimated parameters play an important role in the stand yield model, employing the parameter prediction method (PPM).
Using the hypsometric and volumetric equations, volumes by diameter class and unit area were estimated. The statistical comparison between the projections and the corresponding values from the forest inventory was done using the t-test (95% probability).
3. RESULTS AND DISCUSSION
The results of the adjustments of the best survival models, by site class, are presented in Table 5. In general, the best statistical evaluations were obtained for sites 1 and 2, where the Clutter-Jones model presented superior performance. For site 3, the number of tree estimations at a future age was obtained with the Pienaar and Shiver model. In all models, trends in the estimates were not detected.
Table 4. Models tested to estimate variables in Eucalyptus sp. stands in northeastern Bahia, Brazil.
Eq. Model Model Formulation
(16) Stepwise dmin 2=β0+β1 min1d
(17) Stepwise dmin 2=β0+β1dg2
(18) Stepwise dmin 2=β0+β1 min 2d +β2 1d
(19) Retslaff (2010)
( )
1min 2 1 min1 2 1 2 3 2
d =βd +β I I− +βdg
(20) Stepwise dmax 2=β0+β1 max1d
(21) Stepwise dmax 2=β0+β1 max1d +β2hdom2
(22) Stepwise dmax 2=β0+β1 max1d +β2 2S
(23) Retslaff (2010)
(
1)
max 2 0 1 max1 2 1 1 2
d =β +βd +β −I I−
(24) Stepwise dg2=β0+β1dg1
(25) Stepwise dg2=β0+β1 max 2d
(26) Stepwise dg2=β0+β1dg1+β2 2S
(27) Retslaff (2010) Modified dg2 β0 β1dg1 β2
(
1 I I1 21)
−
= + + −
(28) Stepwise d2=β0+β1 1d
(29) Stepwise
(
1)
2 0 1 1 2 1 1 2
d =β +βd +β −I I−
(30) Álvares et al. (2002) citado por
Retslaff (2010) d2=β0+β1 max 2d
(31) Retslaff (2010) d2=β0+β1dg2
Where: I2 and I1 = future and current ages, respectively (months); dmin2 and dmin1 = minimum diameter at future and current age, respectively (cm); dg2 and dg1 = quadratic diameter at future and current age, respectively (cm); dmax2 and dmax1 = maximum diameter
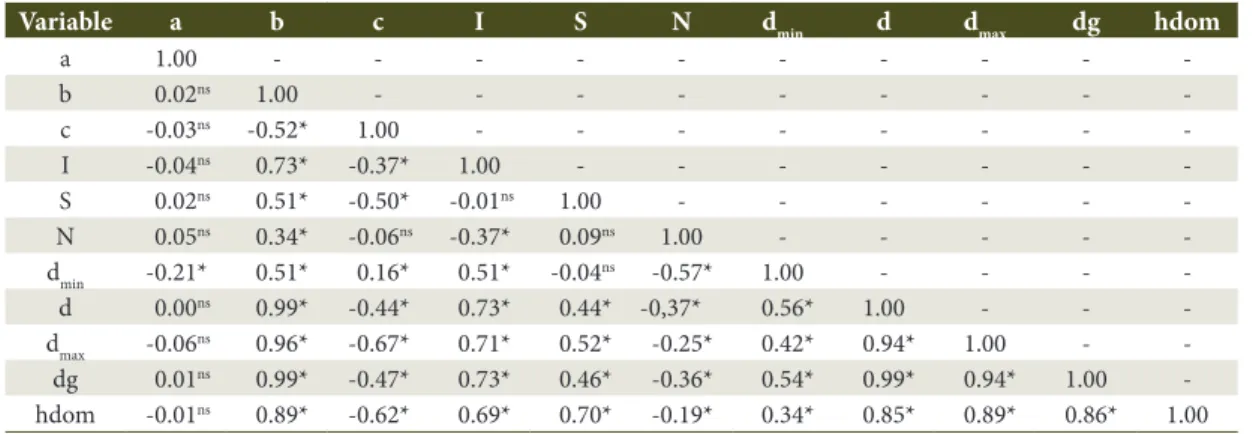
The linear correlation matrix between forest stand variables and Weibull distribution parameters are presented in Table 6. The highest correlations were observed in the variables d, dmax, dg and hdom.
The Weibull distribution location parameter (a) showed a weak correlation with the forest stand variables. The minimum diameter (dmin) showed a negative correlation, being the only statistically significant case for this parameter. This result was also found by Bailey & Dell (1973), who reported that the Weibull distribution location parameter presents a significant relationship with the smallest diameter of the forest stand. The scale (b) and form (c) parameters showed a statistically significant correlation with all forest stand variables ranging from low to moderate values, except between density (N) and the form parameter (c).
The smaller value of the sum of squares of differences between the observed and estimated frequencies was obtained when the location parameter (a) was equal to or very close to zero. Therefore, this parameter was considered equal to zero, resulting in the two-parameter
Weibull distribution. This distribution was used by Gove (2003), Zasada (2013) and Sanquetta et al. (2014).
Figura (2010) tested different percentages of minimum diameter to represent the location parameter of Weibull distribution in stands of Eucalyptus grandis, in southern Brazil. The best results were obtained using a percentage of minimum diameter equal to zero, similar to the results obtained in this study.
The other Weibull distribution parameters were obtained using selected equations and for the future scale parameter (b2), the adjustments of the accuracy statistics were satisfactory, reaching R2
adjusted values higher than 0.95 for all adjusted equations. The Syx values were very low, less than 1% for Equation 12 (Stepwise), which was selected to estimate the scale parameter for the three site classes (Table 7). Estimates of form parameters (c2) at future ages resulted in R2
adjusted and Syx% values lower than those obtained for the scale parameter, however, they remained adequate results. The models selected to estimate c2 are the Equation 13 (Retslaff, 2010), Equation 14 and Equation 15 (Stepwise), for site classes 1, 2 and 3, respectively. The estimates
Table 5. Estimated coefficients and statistics of adjustments and accuracy of the best equations to estimate survival in Eucalyptus sp. stands in northeastern Bahia, Brazil.
Site Model R2
adjustment Syx% β1 β2 β3
1 (9) Clutter and Jones 0.80 4.20 -0.60945* -0.00041* 0.83184* 2 (9) Clutter and Jones 0.89 6.46 -0.59675* -0.02027* 0.38251*
3 (6) Pienaar and Shiver 0.89 6.32 0.02242* 0.73747*
-Where: * significant at 95% probability; -: Coefficient not present in the model; R²adjustment = adjusted coefficient of determination; Syx% = relative standard error of estimate; βi = adjusted coefficients.
Table 6. Linear correlation matrix between forest stand variables and Weibull distribution parameters in
Eucalyptus sp. stands in northeastern Bahia, Brazil.
Variable a b c I S N dmin d dmax dg hdom
a 1.00 - - -
-b 0.02ns 1.00 - - - - - - - -
-c -0.03ns -0.52* 1.00 - - - - - - -
-I -0.04ns 0.73* -0.37* 1.00 - - - - - -
-S 0.02ns 0.51* -0.50* -0.01ns 1.00 - - - - -
-N 0.05ns 0.34* -0.06ns -0.37* 0.09ns 1.00 - - - -
-dmin -0.21* 0.51* 0.16* 0.51* -0.04ns -0.57* 1.00 - - -
-d 0.00ns 0.99* -0.44* 0.73* 0.44* -0,37* 0.56* 1.00 - -
-dmax -0.06ns 0.96* -0.67* 0.71* 0.52* -0.25* 0.42* 0.94* 1.00 -
-dg 0.01ns 0.99* -0.47* 0.73* 0.46* -0.36* 0.54* 0.99* 0.94* 1.00
-hdom -0.01ns 0.89* -0.62* 0.69* 0.70* -0.19* 0.34* 0.85* 0.89* 0.86* 1.00 Where: a = location parameter; b = scale parameter; c = form parameter; I = age, in months; S = site index; N = number of tress; dmin = minimum diameter; d = diameter at breast height; dmax = maximum diameter; dg = quadratic diameter; hdom = dominant height; * significant at 95% probability; ns = not significant at 95% probability; -: Values similar to those obtained at the bottom of the
showed a good performance for all models, resulting in unbiased estimates.
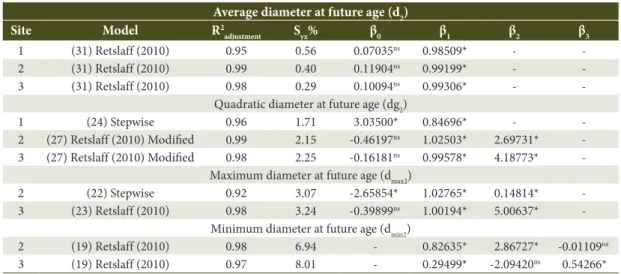
The models were selected to estimate the parameter of the Weibull distribution, at a future age, applying the variables: dmin, d, dmax and dg. These express the forest stand attributes to be estimated and to constitute the projection equation system. Table 8 presents the coefficients and statistics for evaluation of selected equations to estimate these stand attributes.
Estimates of forest stand attributes at a future age were unbiased: d2, dg2, and dmax2. However, a slight trend was observed, moving from an overestimation to an underestimation for the dmin2, even though it did not impose restrictions on the equations selected.
When considering d2, Equation 31 (Retslaff, 2010) showed better performance for its estimation in all site classes, in which R2
adjusted was equal to or greater than 0.95, and the Syx% was close to zero. These results are due to the high correlation between d and dg variables, observed in the previously presented correlation matrix. For dg2, Equation 24 (Stepwise) showed the best performance for its estimation in site class 1, while for site classes 2 and 3, Equation 27 (Retslaff, 2010 – modified) was superior.
The estimate of dmax2 presented a high R2 adjusted and low Syx%. The Equation 23 (Retslaff, 2010) resulted in better statistics to represent site class 3. For site class 2, the best result was obtained with the Equation 22 (Stepwise). For the estimation of dmin2,
Table 7. Estimated coefficients, fitting and accuracy statistics of the best equations to estimate the parameters of the Weibull distribution (b and c) at the future age of the Eucalyptus sp. stands in northeastern Bahia, Brazil.
Site Model R2
adjustment Syx% β0 β1 β2 β3
Scale parameter (b)
1 (12) Stepwise 0.99 0.86 0.2326ns 4.1974* -3.1752*
-2 (12) Stepwise 0.99 0.45 0.2236* 3.4620* -2.4505*
-3 (12) Stepwise 0.99 0.44 0.1120ns 4.5371* -3.5159*
-Form parameter (c)
1 (13) Retslaff (2010) 0.79 7.93 18.686* 0.263* -10.64* 9.951*
2 (14) Stepwise 0.81 9.52 73.725* 1.988* 3.996* -35.21*
3 (15) Stepwise 0.75 9.14 12.893* -2.616* 2.5413* 3.163*
Where: * = significant at 95% probability; ns = not significant at 95% probability; -: Coefficient not present in the model;
R²adjustment = adjusted coefficient of determination; Syx% = relative standard error of estimate; βi = adjusted coefficients.
Table 8. Coefficients, adjustment attributes and accuracy statistics of the best equations to estimate forest stand variables of the prediction system in diameter classes in Eucalyptus sp. stands in northeastern Bahia, Brazil.
Average diameter at future age (d2)
Site Model R2
adjustment Syx% β0 β1 β2 β3
1 (31) Retslaff (2010) 0.95 0.56 0.07035ns 0.98509* -
-2 (31) Retslaff (2010) 0.99 0.40 0.11904ns 0.99199* -
-3 (31) Retslaff (2010) 0.98 0.29 0.10094ns 0.99306* -
-Quadratic diameter at future age (dg2)
1 (24) Stepwise 0.96 1.71 3.03500* 0.84696* -
-2 (27) Retslaff (2010) Modified 0.99 2.15 -0.46197ns 1.02503* 2.69731*
-3 (27) Retslaff (2010) Modified 0.98 2.25 -0.16181ns 0.99578* 4.18773*
-Maximum diameter at future age (dmax2)
2 (22) Stepwise 0.92 3.07 -2.65854* 1.02765* 0.14814*
-3 (23) Retslaff (2010) 0.98 3.24 -0.39899ns 1.00194* 5.00637*
-Minimum diameter at future age (dmin2)
2 (19) Retslaff (2010) 0.98 6.94 - 0.82635* 2.86727* -0.01109ns
3 (19) Retslaff (2010) 0.97 8.01 - 0.29499* -2.09420ns 0.54266* Where: * = significant at 95% probability; ns = not significant at 95% probability; -: Coefficient not present in the model;
Equation 19 (Retslaff, 2010) also resulted in better performance for site classes 2 and 3.
In general, the results were considered satisfactory. Therefore, the models can be used for future estimates of forest stand attributes with precision and, consequently, to estimate Weibull distribution parameters at a future age. Once the equations were selected to estimate the Weibull distribution parameters, in addition to the forest stand attributes at a future age, they were also applied to data of 23 surplus plots for validation purposes. Table 9 presents the statistics for the selected models to estimate the forest stand attributes, in which the R2
adjusted ranged from 0.81 to 0.99, and Syx from 0.96 to 5.95%. The results were obtained for the equation to estimate d2, indicating a high correlation of this variable with dg2, depending on the model selected to estimate this variable.
The Weibull distribution parameters were estimated from selected equations and estimated frequencies for the number of trees in each sample plot were obtained. The observed and estimated frequencies were subjected to evaluation by Kolmogorov-Smirnov’s test (95%). Of the 23 sample plots selected for validation, 20 showed statistic “D” less than the respective table
value, which indicates the adherence of the distributions. The remainder did not present adherence. In one sample plot, positive asymmetry occurred and in the others, a large number of trees appeared in the initial diameter classes, which provoked difficulties when adjusting the Weibull distribution in such circumstances.
The number of trees per hectare and diameter class was obtained for each site class and year of measurement to evaluate the accuracy of these estimates (Figure 1).
Figure 1. Observed (bars) and estimated (full lines) distributions by site class and year of measurement, in
Eucalyptus sp. stands in northeastern Bahia, Brazil.
Table 9. Statistics for the estimated forest stand attributes obtained for the validation dataset, by site class, in
Eucalyptus sp. stands in northeastern Bahia, Brazil.
Model Site 1 Site 2 Site 3 R2
adjusted Syx% R2adjusted Syx% R2adjusted Syx%
N2 0.93 2.71 0.97 2.41 0.95 4.61 d2 0.97 1.62 0.98 0.99 0.99 0.96 dg2 0.90 2.98 0.93 2.16 0.94 2.60 dmax2 0.93 2.95 0.83 3.56 0.84 4.20 dmin2 0.89 5.95 0.88 4.06 0.81 4.98
Where: N2 = number of trees at future age; d2 = diameter at breast height at future age (cm); dg2 = quadratic diameter
at future age (cm); dmax2 = maximum diameter at future age (cm); dmin2 = minimum diameter at future age (cm);
Palahí et al. (2006) obtained similar results in modeling the diameter distribution in Pinus spp. stands using the Weibull distribution. There, the parameter optimization method, when minimizing the differences between observed and estimated accumulated frequencies, provided the best estimates in relation to regression methods.
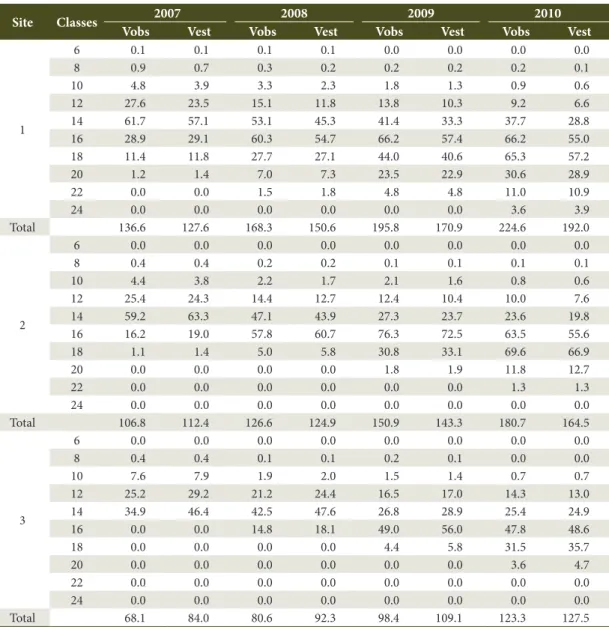
The hypsometric and volumetric equations were applied to the central value of each diameter class, in accordance with the frequency estimated by Weibull distribution. The product of the number of trees in
each class by the volume of the central tree made it possible to obtain the volume per class. The sum of the volume of each class resulted in the volume of the sample plot and, by extrapolation, the results per hectare were obtained. The results of observed and estimated production values are presented in Table 10.
The production estimates followed the same trend in the various site classes. Site 1 was the only one that presented production values in the upper diameter classes. For sites with high and medium yield, there was a tendency to underestimate the production values,
Table 10. Observed and estimated volumetric production by site class and year of measurement, in Eucalyptus sp. stands in northeastern Bahia, Brazil.
Site Classes 2007 2008 2009 2010
Vobs Vest Vobs Vest Vobs Vest Vobs Vest
1
6 0.1 0.1 0.1 0.1 0.0 0.0 0.0 0.0
8 0.9 0.7 0.3 0.2 0.2 0.2 0.2 0.1
10 4.8 3.9 3.3 2.3 1.8 1.3 0.9 0.6
12 27.6 23.5 15.1 11.8 13.8 10.3 9.2 6.6
14 61.7 57.1 53.1 45.3 41.4 33.3 37.7 28.8
16 28.9 29.1 60.3 54.7 66.2 57.4 66.2 55.0
18 11.4 11.8 27.7 27.1 44.0 40.6 65.3 57.2
20 1.2 1.4 7.0 7.3 23.5 22.9 30.6 28.9
22 0.0 0.0 1.5 1.8 4.8 4.8 11.0 10.9
24 0.0 0.0 0.0 0.0 0.0 0.0 3.6 3.9
Total 136.6 127.6 168.3 150.6 195.8 170.9 224.6 192.0
2
6 0.0 0.0 0.0 0.0 0.0 0.0 0.0 0.0
8 0.4 0.4 0.2 0.2 0.1 0.1 0.1 0.1
10 4.4 3.8 2.2 1.7 2.1 1.6 0.8 0.6
12 25.4 24.3 14.4 12.7 12.4 10.4 10.0 7.6
14 59.2 63.3 47.1 43.9 27.3 23.7 23.6 19.8
16 16.2 19.0 57.8 60.7 76.3 72.5 63.5 55.6
18 1.1 1.4 5.0 5.8 30.8 33.1 69.6 66.9
20 0.0 0.0 0.0 0.0 1.8 1.9 11.8 12.7
22 0.0 0.0 0.0 0.0 0.0 0.0 1.3 1.3
24 0.0 0.0 0.0 0.0 0.0 0.0 0.0 0.0
Total 106.8 112.4 126.6 124.9 150.9 143.3 180.7 164.5
3
6 0.0 0.0 0.0 0.0 0.0 0.0 0.0 0.0
8 0.4 0.4 0.1 0.1 0.2 0.1 0.0 0.0
10 7.6 7.9 1.9 2.0 1.5 1.4 0.7 0.7
12 25.2 29.2 21.2 24.4 16.5 17.0 14.3 13.0
14 34.9 46.4 42.5 47.6 26.8 28.9 25.4 24.9
16 0.0 0.0 14.8 18.1 49.0 56.0 47.8 48.6
18 0.0 0.0 0.0 0.0 4.4 5.8 31.5 35.7
20 0.0 0.0 0.0 0.0 0.0 0.0 3.6 4.7
22 0.0 0.0 0.0 0.0 0.0 0.0 0.0 0.0
24 0.0 0.0 0.0 0.0 0.0 0.0 0.0 0.0
Total 68.1 84.0 80.6 92.3 98.4 109.1 123.3 127.5
while in lower productivity sites, the estimated values were above the respective values observed for all years of measurement. For all cases, there has been progress in the diameter class production with increasing age, as expected.
The “F” test was carried out to verify the homogeneity of the variances between the total observed and estimated outputs, by site class and year of measurement. The results for this test were: 1.86 (p-value = 0.31), 1.97 (p-value = 0.30) and 1.55 (p-value = 0.36), for site 1, 2 and 3, respectively, indicating homoscedasticity. Consequently, the t-test was applied for two independent samples, assuming equal variances. The “t” value was 0.90 (p-value = 0.40), 0.26 (p-value = 0.81) and 0.69 (p-value = 0.52), for sites 1, 2 and 3, respectively, indicating that the total outputs observed and estimated by site class did not differ statistically at 95% probability.
All systems provided consistent results, however, differences in the yield estimates at some ages were observed. This was also observed by Abreu et al. (2002) for Eucalyptus grandis, in the state of São Paulo, Brazil, and Nogueira et al. (2005) for thinned Eucalyptus sp. stands, in northeastern Bahia, Brazil.
Based on these results, the system was considered suitable for projection of diameter distribution and production in Eucalyptus sp. stands in northeastern Bahia, Brazil. The synthesis of the equations system stratified by site classes is as follows:
Site 1:
(
)
0.60945 10.60945 0.83184 0.83184
2 1 0, 00041 2 1
N N I I
− −
−
= − − (9)
2 4.19736 2 3.17517 2
b = dg − d (12)
2 18.68596 0.26331 min 2 10.64181 2 9.95050 2
c = + d − dg + d (13)
2 3.0350 0.84696 1
dg = + dg (24)
2 0.98509 2
d = dg (31)
Site 2:
(
)
0.59675 10.59675 0.38251 0.38251
2 1 0.02027 2 1
N N I I
− −
−
= − − (9)
2 0.22358 3.46197 2 2.45053 2
b = + dg − d (12)
( ) ( )
2 73.72538 1.98814 2 3.99562 ln min 2 35.20931ln max 2
c = + d + d − d (14)
( )
1min 2 0.82635 min1 2.86727 1 2
d = d + I I− (19)
max 2 2.65854 1.02765 max1 0.14814 2
d = − + d + S (22)
(
1)
2 1.02503 1 2.69731 1 1 2
dg = dg + −I I− (27)
2 0.99199 2
d = dg (31)
Site 3:
( ) ( )
(
0.73747 0.73747)
2 1 2 1
ln N =ln N −0.02242 I −I (6)
2 4.53714 2 3.51586 2
b = dg − d (12)
( )
1 ( )2 12.89342 2.61566 max 2 2.54128 1 2 3.1627 ln min 2
c = − d + I I− + d (15)
min 2 0.29499 min1 0.54266 2
d = d + dg (19)
(
1)
max 2 1.00194 max1 5.00637 1 1 2
d = d + −I I− (23)
(
1)
2 0.99578 1 4.18773 1 1 2
dg = dg + −I I− (27)
2 0.99306 2
d = dg (31)
4. CONCLUSIONS
According to the results, the proposed system of equations is efficient to project the frequencies of the number of trees as well as the wood production by diameter class for Eucalyptus sp. stands, and may be used as a tool to aid in planning forest production.
SUBMISSION STATUS
Received: 10 mar., 2017 Accepted: 26 oct., 2017
CORRESPONDENCE TO
Rodrigo Miranda
Departamento de Engenharia Florestal, Universidade Estadual do Centro-Oeste – UNICENTRO, PR 153, Km 7, CEP 84500-000, Irati, PR, Brasil
e-mail: rov_miranda@yahoo.com.br
REFERENCES
Abreu ECR, Scolforo JRS, Oliveira AD, Mello JM, Kanegae H Jr. Modelagem para prognose precoce do volume por classe diamétrica para Eucalyptus grandis.Scientia Forestalis 2002; 61: 86-102.
2010; 45(11): 1275-1281. http://dx.doi.org/10.1590/ S0100-204X2010001100007.
Bailey TRL, Dell R. Quantifying diameter distribution with the Weibull distribution. Forest Science 1973; 19(2): 97-104.
Binoti DHB, Binoti MLMS, Leite HG, Garcia SLR, Cruz JP. Modelos de distribuição diamétrica para povoamentos desbastados de eucalipto utilizando a função hiperbólica.
Árvore 2011; 35(5): 1069-1076. http://dx.doi.org/10.1590/ S0100-67622011000600013.
Binoti DHB, Binoti MLMS, Leite HG. Projeção da distribuição diamétrica de povoamentos equiâneos utilizando a função Nakagami e Weibull. Ciência da Madeira 2014; 5(2): 103-110. http://dx.doi.org/10.12953/2177-6830.v05n02a04.
Clutter JL, Fortson JC, Pienaar LV, Brister GH, Bailey RL.
Timber management: a quantitative approach. New York: John Wiley & Sons; 1983. 333 p.
Duan AG, Zhang JG, Zhang XQ, He CY. Stand diameter distribution modelling and prediction based on Richards function. PLoS One 2013; 8(4): 1-12. http://dx.doi. org/10.1371/journal.pone.0062605. PMid:23638124.
Figura MA. A distribuição de Weibull na descrição da estrutura diamétrica de Eucalyptus grandis: um enfoque sobre o método dos momentos [dissertação]. Curitiba: Setor de Ciências Agrárias, Universidade Federal do Paraná; 2010.
Gove JH. Moment and maximum likelihood estimators for Weibull distributions under length- and area-biased sampling. Environmental and Ecological Statistics 2003; 10(4): 455-467. http://dx.doi.org/10.1023/A:1026000505636.
Hosokawa RT, Moura JB, Cunha US. Introdução ao manejo e economia de florestas. Curitiba: UFPR; 2008. 164 p.
Kangas A, Maltamo M. Calibrating predicted diameter distribution with additional information. Forest Science
2000; 46(3): 390-396.
Leal FA, Cabacinha CD, Castro RVO, Matricardi EAT. Amostragem de árvores de Eucalyptus na cubagem rigorosa para estimativa de modelos volumétricos. Revista Brasileira de Biometria 2015; 33(1): 91-103.
Lei Y. Evaluation of three methods for estimating the Weibull distribution parameters of Chinese pine (Pinus tabulaeformis). Journal of Forest Science 2008; 54(12): 566-571. http://dx.doi.org/10.17221/68/2008-JFS. Leite HG, Alcântara AEM, Binoti DHB, Oliveira RR No, Silva MLM. Comparação entre predição e projeção da distribuição de diâmetros de povoamentos de eucalipto submetidos a desbastes. Árvore 2013; 37(2): 321-328. http://dx.doi.org/10.1590/S0100-67622013000200013.
Leite HG, Nogueira GS, Campos JCC, Souza AL, Carvalho A. Avaliação de um modelo de distribuição diamétrica ajustado para povoamentos de Eucalytus sp. submetidos a desbaste. Árvore 2005; 29(2): 271-280. http://dx.doi. org/10.1590/S0100-67622005000200010.
Loetsch F, Zöhrer F, Haller KE. Forest inventory. München: BLV Verlagsgesellschaft mbH; 1973. 469 p.
Nascimento RGM, Machado SA, Figueiredo A Fo, Higuchi N. Modelo de projeção por classe diamétrica para florestas nativas: enfoque na função probabilística de Weibull.
Pesquisa Florestal Brasileira 2012; 32(70): 209-219. http:// dx.doi.org/10.4336/2012.pfb.32.70.93.
Nogueira GS, Leite HG, Campos JCC, Carvalho AF, Souza AL. Modelo de distribuição diamétrica para povoamentos de Eucalyptus sp. submetidos a desbastes.
Árvore 2005; 29(4): 579-589. http://dx.doi.org/10.1590/ S0100-67622005000400010.
Nokoe S, Okojie JA. Relationship of stand attributes of some plantation mahoganies with estimated Weibull parameters. Ecological Modelling 1984; 24(3-4): 231-240. http://dx.doi.org/10.1016/0304-3800(84)90043-7.
Palahí M, Pukkala T, Trasobares A. Modeling the diameter distribution of Pinus sylvestris, Pinus nigra and Pinus halepensis forest stands in Catalonia using the truncated Weibull distribution. Forestry 2006; 79(5): 553-562. http:// dx.doi.org/10.1093/forestry/cpl037.
Piqué-Nicolau M, Del Río M, Calama R, Montero G. Modelling siviculture alternatives for managing Pinus pinea L. forest in North-East Spain. Forest Systems 2011; 20(1): 3-20. http://dx.doi.org/10.5424/fs/2011201-8464.
Retslaff FAS. Modelagem de crescimento e produção em classes de diâmetro para plantios de Eucalyptus grandis
[dissertação]. Irati: Setor de Ciências Agrárias, Universidade Estadual do Centro-Oeste do Paraná; 2010.
Retslaff FAS, Figueiredo A Fo, Dias AN, Bernett LG, Figura MA. Prognose do crescimento e da produção em classes de diâmetro para povoamentos desbastados de Eucalyptus grandis no sul do Brasil. Árvore 2012; 36(4): 719-732. http://dx.doi.org/10.1590/S0100-67622012000400013.
Ribeiro A, Ferraz AC Fo, Mello JM, Ferreira MZ, Lisboa PMM, Scolforo JRS. Estratégias e metodologias de ajuste de modelos hipsométricos em plantios de Eucalyptus
sp. Cerne 2010; 16(1): 22-31. http://dx.doi.org/10.1590/ S0104-77602010000100003.
Rodríguez-Carrillo A, Cruz-Cobos F, Vargas-Larreta B, Hernández FJ. Compatible dominant height: site index model for juniper (Juniperus deppeana Steud.).
Chapingo 2015; 21(1): 97-108. http://dx.doi.org/10.5154/r. rchscfa.2014.09.041.
Sanquetta CR, Behling A, Dalla Corte AP, Péllico S No, Rodrigues AL, Simon AA. A model based on environmental factors for diameter distribution in black wattle in Brazil.
PLoS One 2014; 9(6): e100093. http://dx.doi.org/10.1371/ journal.pone.0100093. PMid:24932909.
diamétrica. Floresta 2010; 40(4): 731-738. http://dx.doi. org/10.5380/rf.v40i4.20325.
Téo SJ, Bianchi JC, Peloso A, Nava PR, Marcon A, Ehlers T et al. Desempenho de funções de densidade probabilísticas para descrever a distribuição diamétrica de Pinus taeda, na região de Caçador, SC. Floresta 2012; 42(4): 741-754. http://dx.doi.org/10.5380/rf.v42i4.25976.
Tonini H, Borges RA. Equação de volume para espécies comerciais em Floresta Ombrófila Densa no sul de Roraima.
Pesquisa Florestal Brasileira 2015; 35(82): 111-117. http:// dx.doi.org/10.4336/2015.pfb.35.82.738.
Wendling WT, Emerenciano DB, Hosokawa RT. Ajuste da função de distribuição diamétrica Weibull por planilha eletrônica. Floresta 2011; 41(2). http://dx.doi.org/10.5380/ rf.v41i2.21869.