Antonio Carlos Ferraz Filho(1), José Roberto Soares Scolforo(1), Antonio Donizette de Oliveira(1) and José Márcio de Mello(1)
(1)Universidade Federal de Lavras, Departamento de Ciências Florestais, Caixa Postal 3037, Campus Universitário, CEP 37200‑000 Lavras, MG, Brazil. E‑mail: antoniocarlos.ferraz@dcf.ufla.br, jscolforo@dcf.ufla.br, donizete@dcf.ufla.br, josemarcio@dcf.ufla.br
Abstract – The objective of this work was to develop and validate a prognosis system for volume yield and basal area of intensively managedloblolly pine (Pinus taeda) stands, using stand and diameter class models compatible in basal area estimates. The data used in the study were obtained from plantations located in northern Uruguay. For model validation without data loss, a three‑phase validation scheme was applied: first, the equations were fitted without the validation database; then, model validation was carried out; and, finally, the database was regrouped to recalibrate the parameter values. After the validation and final parameterization of the models, a simulation of the first commercial thinning was carried out. The developed prognosis system was precise and accurate in estimating basal area production per hectare or per diameter classes. There was compatibility in basal area estimates between diameter class and whole stand models, with a mean difference of -0.01 m2 ha-1. The validation scheme applied is logic and consistent, since information on the accuracy and precision of the models is obtained without the loss of any information in the estimation of the models’ parameters.
Index terms: Pinus taeda, model validation, prognosis system, pruning, sawtimber, thinning.
Modelagem do crescimento e da produção de povoamento
de
Pinus taeda
sob manejo intensivo
Resumo – O objetivo deste trabalho foi desenvolver e validar um sistema de prognose para produção em volume e área basal de povoamento de Pinus taeda manejado intensamente, com uso de modelos de povoamento e de classes diamétricas compatíveis em estimativas de área basal. Os dados utilizados no estudo foram obtidos de plantios localizados no norte do Uruguai. Para a validação dos modelos sem perda de informação, foi aplicado um esquema de validação em três fases: primeiro, as equações foram ajustadas sem a base de dados de validação; depois, a validação do modelo foi realizada; e, por fim, a base de dados foi reagrupada para recalibrar os valores dos parâmetros. Após a validação e a parametrização final dos modelos, foi realizada uma simulação do primeiro desbaste comercial. O sistema de prognose desenvolvido foi preciso e acurado na estimativa de produção em área basal por hectare ou por classes diamétricas. Houve compatibilidade nas estimativas de área basal entre os modelos de classes diamétricas e do talhão como um todo, com diferença média de -0,01 m2 ha-1.
O esquema de validação aplicado é lógico e consistente, uma vez que informações sobre a acurácia e a precisão dos modelos são obtidas sem perda de informação nas estimativas dos parâmetros dos modelos.
Termos para indexação: Pinus taeda, validação de modelos, sistema de prognose, poda, madeira de serraria, desbaste.
Introduction
Natural forest formations in Uruguay are few and consist mostly of treeless pampas, known as the Campos grasslands of South America, concentrated primarily along river beds (Six et al., 2013). According to White & Pou (1980), due to the degradation of native forests, by 1980 about 130 thousand hectares
Pesq. agropec. bras., Brasília, v.50, n.8, p.707-717, ago. 2015 DOI: 10.1590/S0100-204X2015000800009
from free-ranging cattle husbandry towards industrial fast-growing plantations, especially in the central and northern parts of the country (Vihervaara et al., 2012). This change was brought about by the implementation of forestry incentive laws (law 15939 in 1987 and law 16906 in 1998), which encouraged large‑scale forestry plantations through the use of subsidies, tax relief, and targeted loans to investors (Mendell et al., 2007; Redo et al., 2012). Following these laws, there was a significant increase in the planted forest area of Uruguay, reaching 991 thousand hectares by 2013 (Uruguay, 2014).
Of the forest plantations in Uruguay, the majority is destined for pulp mills and domestic supply, and the main planted species are Eucalyptus grandis,
E. globulus, and E. dunnii. The other major planted species in Uruguay are Pinus elliottii, P. pinaster, and P. taeda (Uruguay, 2014). Olmos & Siry (2009)
estimated that 70% of Eucalyptus plantations in the country are managed for pulping and the rest for sawtimber production, whereas 100% of Pinus
plantations are destined for sawtimber and plywood production. Many of the plantations managed for solid wood production are located in northern Uruguay, in the departments of Rivera, Paysandú, and Tacuarembó (Mendell et al., 2007; Six et al., 2014). In northern Uruguay, of the planted species, 52% are
Pinus and 48% are Eucalyptus, differing from the species distribution in the rest of the country, which is of about 8% Pinus and 92% Eucalyptus (Uruguay, 2014).
The type of management applied in the plantations for solid wood production can be considered as intensive. Intensive forest management is defined as the production of high-quality timber in a short time frame, accomplished through the improvement of the stand’s growth environment. This improvement is done mainly through soil preparation, fertilization, weeding, and thinning practices, among others. Intensive forest management has been proven to increase the quality and quantity of timber production in southern United States (Fox et al., 2007; Jokela et al., 2010), and is also a profitable investment option in other parts of the world. Rubilar et al. (2008) reported production gains of 20 to 50% and reductions in final rotation age of 2 to 5 years, for intensively managed Pinus and Eucalyptus
plantations in Chile and Argentina. Bussoni & Cabris (2011) compared a 24-year rotation for mixed sawlog
diameters to a 12-year rotation for small-log production of Pinus taeda stands in northeast Uruguay, and found that the land expectation value was about 50% higher for the longer rotation than for the shorter one. These authors also concluded that the investment in forest plantations without the adequate early silvicultural treatments, such as pruning and pre-commercial thinning, which characterize intensive management, result in a high risk of financial loss.
Given the long rotations of 22 years for Pinus and 16 years for Eucalyptus, associated with solid-wood production management regimes in Uruguay (Cubbage et al., 2014), growth models that predict future wood production are needed. The choice of a prognosis system to portray forest growth and yield depends on the level of desired detail, as well as on the management practices to be evaluated. Stand-level models are more suitable for forests destined for cellulose and energy wood production. However, when more detailed answers are required, as for forests for sawlog production, diameter class models are more indicated (Burkhart et al., 1981). Some of the most sought‑after tools in forest management are mathematical models capable of estimating the impacts of different management alternatives, such as thinning regimes, applied to forest stands (Scolforo, 1993).
Examples of prognosis systems that depict Pinus taeda thinned-stand growth can be found in Eisfeld et al. (2005) and Costas et al. (2006, 2007) for Argentinian and for Brazilian plantations, respectively. For Uruguay, some studies on model sets for P. taeda
have been published, which include volume and taper equations (Rachid et al., 2014), diametric frequency distribution functions (Hirigoyen & Rachid, 2014), and several mensurational relationships, such as height to diameter at breast height (DBH), crown diameter to DBH, crown volume to DBH, bark thickness to DBH, and bark thickness to tree height (Leites et al., 2013).
The objective of this work was to develop and validate a prognosis system for volume yield and basal area of intensively managedloblolly pine (Pinus taeda) stands, using stand and diameter class models compatible in basal area estimates.
Materials and Methods
Rivera, Tacuarembó, and Paysandú, situated between 60 and 230 m above sea level (31°22’S, 55°44’W). The data was obtained from plots of the Continuous Forest Inventory, which are circular in shape and vary in size from 300 and 500 m2. A total of 1,360 permanent plots were used, of which 163 were reversed for validation, comprising 7,164 measurement pairs. The characterization of the model parameterization and validation data was done (Table 1). The mean height of the 100 largest trees in DBH per hectare was used to represent the dominant height of the sample plots.
The majority of the plots (about 90%) used in the present study were less than 8 years old. This is an obstacle for the development of the prognosis system, since very few plots had been subjected to the first commercial thinning operation. The silvicultural operations planned for the stands are presented in Table 2.
Different models were used to estimate the following characteristics (Table 3): site index classification by the Chapman‑Richards model in anamorphic form; stand volume by the Sullivan & Clutter (1972) model; stand tree survival; mean diameter variance by the adaptation of the Chapman‑Richards model; and diameter class height model.
The last model needed to finish the prognosis system is a taper function, which allows estimates of the different product sizes that each diameter class can provide. Since a scaling database was not available in the present study, a taper model was not fitted. The models presented in Table 3 were chosen after exhaustive testing of several models. Additional information about the different tested models can be obtained in Ferraz Filho (2009).
A two parameter Weibull probability density function was used to estimate tree density in the different diameter classes. Due to its ability to simulate different distributions, such as the exponential and normal distributions, the Weibull distribution is widely used in many forestry studies, as those carried out by: Cao (2004), Merganic & Sterba (2006), Qin et al. (2007), Miguel et al. (2010), Petráš et al. (2010), and Soares et al. (2010). The probability density function of the Weibull distribution is obtained by the equation,
f(x)= c b . x b
( ) (
)
c-1.exp - x b(
)
c,in which: b>0 and c>0; b and c represent scale and form parameters, respectively; and x is the variable of interest, in this case DBH.
For the compatibilization between stand models (Table 3) and the diameter class model, the method of moments was applied to estimate the parameters of the Weibull function. The method of moments uses the first two non-central moments of the diameter distribution – mean diameter and quadratic diameter, respectively – to estimate the parameters of the Weibull function.
The shape parameter c is firstly recovered using the following equation:
CVDBH= Sd DBH =
{
Γ. 1+ 2 c -(
)
Γ2. 1+1 c(
)
0.5 Γ. 1+1 c ,(
)
}
in which CVDBH is the coefficient of variation of DBH. Using parameter c, the scale parameter b can be recovered by the equation: DBH=b. . 1+1 c ,Γ
(
)
in which Γ is the gamma function.As shown by these two equations, only the DBH and its variance are needed when the method of moments is used to recover the shape and scale parameters of the Weibull distribution. The key to archive the
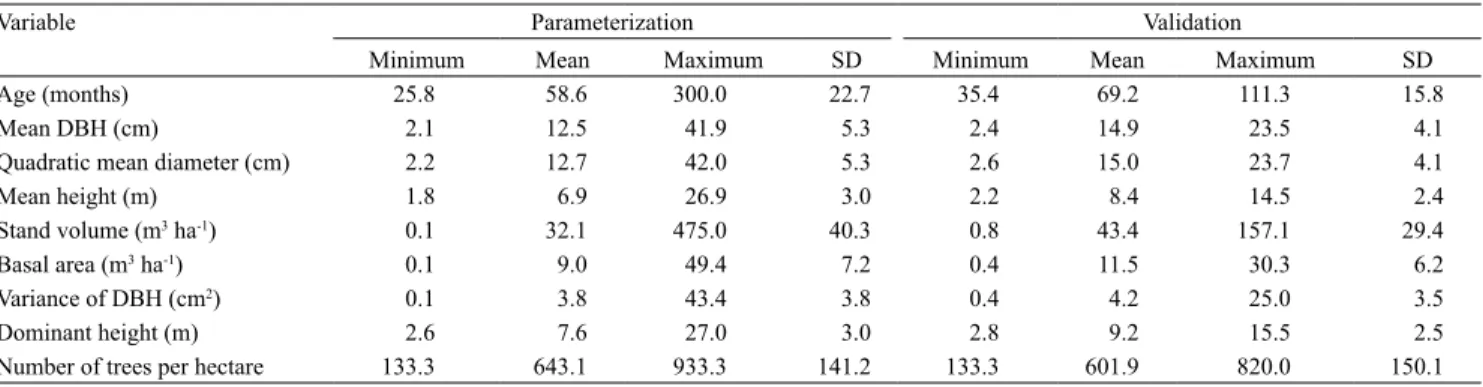
Table 1. Descriptive statistics of the dendrometric characteristics of the permanent plots of loblolly pine (Pinus taeda) evaluated(1).
Variable Parameterization Validation
Minimum Mean Maximum SD Minimum Mean Maximum SD
Age (months) 25.8 58.6 300.0 22.7 35.4 69.2 111.3 15.8
Mean DBH (cm) 2.1 12.5 41.9 5.3 2.4 14.9 23.5 4.1
Quadratic mean diameter (cm) 2.2 12.7 42.0 5.3 2.6 15.0 23.7 4.1
Mean height (m) 1.8 6.9 26.9 3.0 2.2 8.4 14.5 2.4
Stand volume (m3 ha-1) 0.1 32.1 475.0 40.3 0.8 43.4 157.1 29.4
Basal area (m3 ha-1) 0.1 9.0 49.4 7.2 0.4 11.5 30.3 6.2
Variance of DBH (cm2) 0.1 3.8 43.4 3.8 0.4 4.2 25.0 3.5
Dominant height (m) 2.6 7.6 27.0 3.0 2.8 9.2 15.5 2.5
Number of trees per hectare 133.3 643.1 933.3 141.2 133.3 601.9 820.0 150.1
Pesq. agropec. bras., Brasília, v.50, n.8, p.707‑717, ago. 2015 DOI: 10.1590/S0100‑204X2015000800009
compatibility between modeling resolutions is to obtain the DBH from the stand models. To achieve this, the future stand basal area should be estimated using the modified stand volume equation (Table 3):
log( ) .log( ) . .
. log(
G t t G t t
t t S e
2 1 2 1 4 3 1 2 5 3
1 2 1 1 =
(
)
+(
−)
+ −(
)
+β β β β
ii).
The future stand quadratic mean diameter can be estimated using the results from the basal area and survival projection models, using the equation below: Dg2 = G/0.0000785398N.
Since the variables mean diameter, quadratic mean diameter, and diameter variance follow the same logic as a Pythagorean equation, the mean diameter at breast height can be estimated using the following equation: DBH = (Dg2 –Sd2)0,5.
With the stand’s future DBH and diameter variance values, it is possible to estimate the shape and scale parameters of the Weibull distribution.
The validation of the prognosis system was made by separating an entire sub‑region from the parameterization database. This guarantied spatial independence between the parameterization and validation databases (Vanclay & Skovsgaard, 1997). The equations
y−y n and y y y n
(
)
(
[
−]
)
∑
100∑
were used to assess the accuracy of the models, expressed as the mean residual; whereas
y−y n and
(
y−y y)
n∑
100∑
were used to assess the precision, expressed as the mean absolute residual.
Validation was distinguished between young and mature input data. The young data was comprised of the first measurement available after the pre‑commercial thinning, whereas the mature data was the penultimate measurement available. This was done to evaluate the behavior of the prognosis system when different projection lengths are used. Both the young and mature
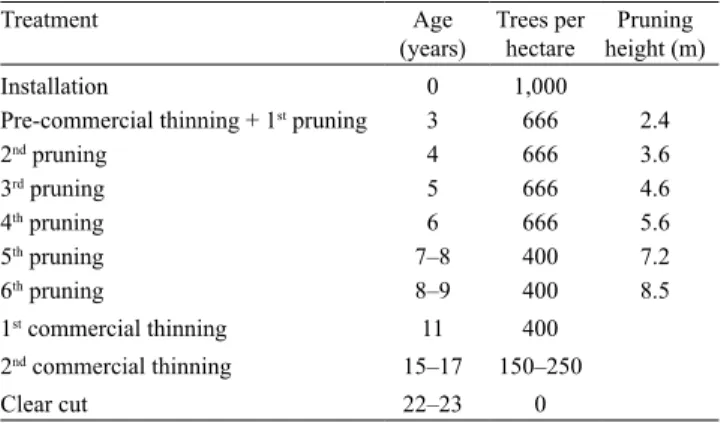
Table 2. Silvicultural operations planned for the evaluated stands of loblolly pine (Pinus taeda).
Treatment Age (years) Trees per hectare Pruning height (m)
Installation 0 1,000
Pre‑commercial thinning + 1st pruning 3 666 2.4
2nd pruning 4 666 3.6
3rd pruning 5 666 4.6
4th pruning 6 666 5.6
5th pruning 7–8 400 7.2
6th pruning 8–9 400 8.5
1st commercial thinning 11 400
2nd commercial thinning 15–17 150–250
Clear cut 22–23 0
Table 3. Models used in the prognosis system for loblolly pine (Pinus taeda).
Characteristic Model(1)
Site index
Hd=β ⋅
(
−e(β⋅t))
β +εi 0 11 2
Stand volume log V log
S t t t G t t 2 0 1 2 2 3 1 2 1 4 1 2 1
( )
= + + + ⋅ ⋅( )
+ ⋅ − +β β β β β ββ5 1 ε
2 1 ⋅ − ⋅ +
( )
tt S log i
Survival N N t t S t t
i
2 1 2 1 1 1 2
0
=
(
)
β ⋅exp(
β ⋅ ⋅ ⋅)
+εVariance of DBH S d S d
t t 2 2 0 2 1 0
1 1 2 1 1 1
= ⋅ − ( ⋅ ) − ( ⋅ ) β β β β
log exp log exp
++ εi
Diameter class height log H log Hd log
DC
Dg
DC t D
( )
= + ⋅( )
+ ⋅ + ⋅ + ⋅ ⋅β0 β1 β2 1 β3 β4 1
C C i
(
)
+log
( )
ε(1)Hd, dominant height; t, age; V, volume per hectare; S, site index; G, basal area; N, number of trees per hectare; S2d, variance of diameter at breast height
input data were projected to the last measurement date, and the observed values were compared with the estimated ones.
After validation, the two databases were united and the models were reparametrized. This allows for any model inconsistencies to be detected in the validation process and for the resulting models to be fitted using all available data. The site index model was the only one fitted initially with the complete data set.
In order to evaluate the adherence of the estimated diameter distribution to the observed data, the Kolmogorov-Smirnov test was used in the 163 validation plots.
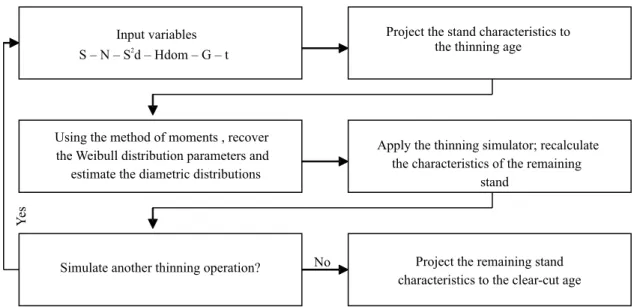
After the parameterization of the final models of the prognosis system, a thinning simulation was carried out (Figure 1). The simulation was done considering a thinning operation at 11 years of age, and the remaining forest data was projected to 17 years of age, i.e., the age of the second thinning operation (Table 2).
Since the used database did not have information on thinned plots, a thinning simulator was used (Arcebi Junior et al., 2002). This simulator estimates the proportion of trees to be removed in each diameter class, using the following equation,
P=exp 1. DCi2 Dg2 +e ,
i
2
β
(
)
β
in which: P is the proportion of trees to be removed from the diameter class (DC) i; and β1 and β2 are the
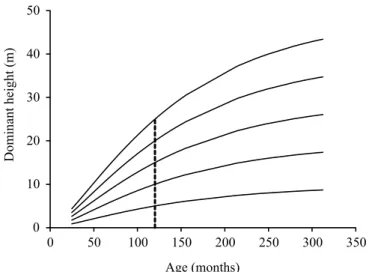
estimated regression parameters (β1 = ‑0.49935 and β2 = 1.815105). A reference age of 10 years was used for site classification due to the young nature of the database. The sample plots were stratified into four different productivity classes with 5-m amplitude (Figure 2).
The thinning simulator was fitted by Arcebi Junior et al. (2002) with data from the second thinning operation for P. taeda stands planted in the state of Paraná, Brazil. This simulator describes selective thinning from below in stands with less than 600 trees per hectare, and was chosen since it is the one that most resembles the thinning operations that are to be applied in Uruguay. To use this simulator, it is necessary to calculate the proportion of trees to be removed in the first diameter class of the stand, which should be done for each following diameter class until the desired number of trees to be removed is reached.
Results and Discussion
The dominant height values that distinguish the different productivities at the reference age are: 5 to 10 m (site index, SI=7.5); 10 to 15 m (SI=12.5); 15 to 20 m (SI=17.5); and 20 to 25 m (SI=22.5). These values classify these plantations as being very productive. In southern United States, the dominant height range of planted loblolly pine varies between 4.7 and 10 m at 10 years of age (Diéguez‑Aranda et al., 2006), which
Pesq. agropec. bras., Brasília, v.50, n.8, p.707‑717, ago. 2015 DOI: 10.1590/S0100‑204X2015000800009
are values similar to the lowest productivity class found in the present study. The four site classes obtained in the present study are coherent with values reported for areas near the study location, in the states of Paraná and Santa Catarina, in southern Brazil. Scolforo & Machado (1988) recorded mean dominant height at the age of 10 years ranging from 7.7 to 22.2 m for P. taeda
stands located in these same areas.
The initial parameters and goodness of fit statistics for the models that compose the prognosis system are shown in Table 4. All the parameters were statistically significant at a 99% confidence level, except for the β2 parameter of the diameter class height model, which was significant at a 90% confidence level.
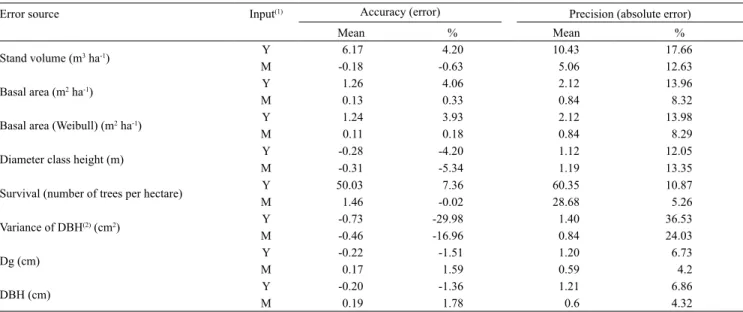
The accuracy and precision of the prognosis system for young and mature input plot values are presented
in Table 5. The mean age for the young input data was 4.4 years, whereas for the mature plots it was 5.8 years. The mean projection age, the last measurement of the permanent plots, was 6.9 years. The accuracy of the models was satisfactory, with all models presenting mean residuals tending to zero and below 10% deviation, with the exception of the variance of DBH model. Precision was also considered satisfactory and presented values below 20% deviation, with the exception of the variance of DBH model. These values are in sync with the ones presented by Soares et al. (1995), who observed accuracy and precision estimates below 11% when modeling P. pinaster
growth in Portugal.
The young input data had a tendency to result in less precise projection estimates, when compared to the mature input data. This behavior was expected since input data that is closer to the projection age is generally more correlated to the stand’s future data (Coble et al., 2012). For instance, errors up to 6.17 m3 ha-1 were found when projecting volume from young plots under 4.4 years of age. This error was reduced in ‑0.18 m3 ha-1 when the input data was obtained from older plots with 5.8 years.
The less precise projection values of the young input data had an effect on the estimation of diameter distribution. Of the 163 validation plots, 11 did not present adherence to the observed values when using the mature input data, according to the Kolmogorov-Smirnov test, at 1% probability. For the young input data, the number of plots that did not present adherence rose to a total of 41. Hirigoyen & Rachid (2014), while evaluating Uruguayan P. taeda, also applied the Weibull probability density function using the method of moments and reported that 5.3% of the plots did not present adherence to the observed
Figure 2. Upper and lower limits of four site index classes at different ages for loblolly pine (Pinus taeda). The dashed line represents the reference age of 10 years.
Table 4. Initial parameters and goodness of fit for the models of the prognosis system for loblolly pine (Pinus taeda)(1).
Parameters Site index Stand volume Survival Variance of DBH Diameter class height
β0 30.1739 2.0036653 -0.2777 19.98731 ‑0.31589
β1 ‑0.00821315 ‑63.6139614 0.0000001216 ‑0.009227 1.09592
β2 1.426830 -3.3570741 - - 0.06222
β3 - 1.1502406 - - ‑0.50990
β4 - 2.3114315 - - 4.09679
β5 - 0.1421099 - -
-Syx 1.28 15.16 69.92 2.64 0.7
Syx (%) 16.04 23.31 11.43 47.25 9.43
R2 87.69 93.74 73.71 72.76 94.55
data. This value was very similar to the one of 6.7% found for the mature plots in the present study. The ability of the system to predict diameter distribution was largely affected by mortality estimates. For example, in the mature projections, 9 out of the 11 plots that did not present adherence to the observed data had a high mortality rate, above 360 trees per hectare in some plots.
The final model parameterization was carried out using the combined parameterization and validation database. The final parameters and goodness of prediction statistics of the models used in prognosis system are shown in Table 6. All the parameters were statistically significant at a 99% confidence level,
except for the β2 parameter of the stand volume model, which was significant at a 95% confidence level.
The parameterizations of the initial and final models were considered adequate, according to the statistical values of goodness of fit (Tables 4 and 6). The variance of DBH model presented the highest residual standard error (Syx=47.12%). Considering that the variance of DBH is a difficult characteristic to predict, the Chapman & Richards projection type model was considered satisfactory for this end. Eisfeld et al. (2005) also found that projection models outperform prediction models, when working with diameter variance models. The clutter volume model, or some modification of it, has been successfully used to model growth in
Table 5. Accuracy and precision of the prognosis system for loblolly pine (Pinus taeda).
Error source Input(1) Accuracy (error) Precision (absolute error)
Mean % Mean %
Stand volume (m3 ha-1) Y 6.17 4.20 10.43 17.66
M ‑0.18 -0.63 5.06 12.63
Basal area (m2 ha-1) Y 1.26 4.06 2.12 13.96
M 0.13 0.33 0.84 8.32
Basal area (Weibull) (m2 ha-1) Y 1.24 3.93 2.12 13.98
M 0.11 0.18 0.84 8.29
Diameter class height (m) Y ‑0.28 -4.20 1.12 12.05
M -0.31 -5.34 1.19 13.35
Survival (number of trees per hectare) Y 50.03 7.36 60.35 10.87
M 1.46 -0.02 28.68 5.26
Variance of DBH(2) (cm2) Y -0.73 ‑29.98 1.40 36.53
M -0.46 ‑16.96 0.84 24.03
Dg (cm) Y -0.22 -1.51 1.20 6.73
M 0.17 1.59 0.59 4.2
DBH (cm) Y -0.20 -1.36 1.21 6.86
M 0.19 1.78 0.6 4.32
(1)Y, young data; and M, mature data. (2)DBH, diameter at breast height.
Table 6. Final parameters and goodness of fit for the models of the prognosis system for loblolly pine (Pinus taeda)(1).
Parameters Stand volume Survival Variance of DBH Diameter class height
β0 2.093922 ‑0.2869 20.5853208 -0.3212711
β1 ‑68.8183 0.0000001619 ‑0.0087792 1.0990868
β2 ‑1.2393 - - ‑0.0768188
β3 1.090967 - - -0.5070334
β4 1.8263 - - 10.4498104
β5 0.158605 - -
-Syx 14.85 71.1 2.6 0.7
Syx (%) 23.76 11.59 47.12 9.43
R2 92.66 72.71 68.92 94.73
Pesq. agropec. bras., Brasília, v.50, n.8, p.707‑717, ago. 2015 DOI: 10.1590/S0100‑204X2015000800009
several studies, such as those of Oliveira et al. (2009) and Salles et al. (2012). All the models (Tables 4 and 6) presented fit statistic values, i.e. residual standard error and coefficient of determination, similar to those obtained by Arcebi Junior et al. (2002) and Eisfeld et al. (2005), when studying thinned P. taeda stands in the state of Paraná, in southern Brazil.
Although slight, most of the statistical values of model quality presented a change for the worst from the initial to the final model parameterization. This occurred because more data was added to the parameterization database, increasing the distribution range of all the tree characteristics and, therefore, resulting in a greater variability. None of the fitted models presented any residual tendencies, evaluated by residual graphs (not presented), which might affect the quality of the predicted data.
As stated by Zhang et al. (2010), an important aspect of a prognosis system is the compatibility between estimates from different levels of resolution, in this case, between stand estimates and diameter class estimates. To check this, the difference in basal area estimates was tabulated using the validation database. The mean difference between basal area estimates using the stand model (Table 6) and the Weibull data was of -0.01 m2 ha-1, with values ranging from -0.05 to 0.16 m2 ha-1, confirming the compatibility between the different modeling approaches.
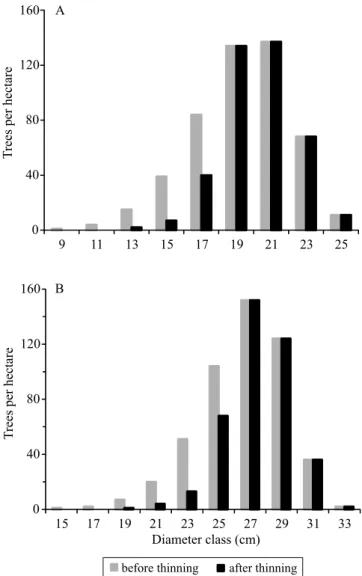
The thinning simulation was conducted using the parameters of the models related to the final parameterization (Table 6). The first step taken was to select four plots, with mean age of 5.7 years, that represented the mean characteristics of each site class. The thinning operation was conducted until a final number of 400 trees per hectare was obtained. The diameter distribution before and after the first commercial thinning operation at 11 years of age was determined for the two intermediate sites (Figure 3), which were chosen for being the most representative of the study area, comprising 94% total plots.
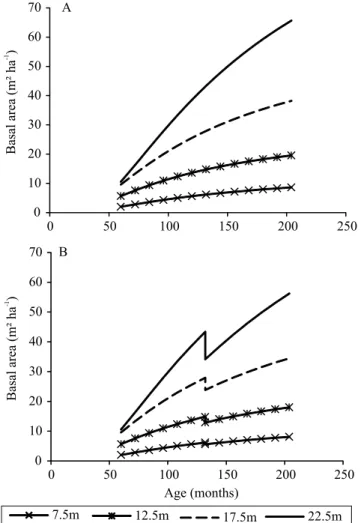
As can be expected in selection thinning from below, the greatest tree removal occurred in the smaller diameter classes, whereas the larger classes remained practically unaltered. There was an evolution of the basal area with and without thinning, observed through the four selected plots for the thinning simulation (Figure 4). This prognosis was made starting from 60
to 204 months of age, which corresponds to the age of the second commercial thinning.
The basal area values for the age of the second commercial thinning operation, for thinned and unthinned areas, are of similar magnitude (Figure 4), with the greatest difference occurring in the higher productivity sites. By 18 years of age, site 22.5 m presented a difference of about 10 m2 ha-1 between thinned and unthinned areas, whereas site 7.5 m presented a difference of about 1.0 m2 ha-1. This can be explained by the fact that, in order to obtain a remaining stand of 400 trees per hectare, a greater amount of basal area must be removed from the higher productivity stands due to the larger size of the trees.
Even though the basal area values for the thinned areas are close to those for the unthinned ones, the former most likely will not pass the latter, confirming the results obtained in several thinning studies carried out by Hasenauer et al. (1997), Simard et al. (2004), Río et al. (2008), and Skovsgaard (2009). This statement can only be confirmed after the study plots undergo the first commercial thinning operation, allowing the modeling of post-thinning growth.
Although thinning reduces the basal area of the stand, individual tree growth is benefitted. The mean DBH value for site 22.5 m at 18 years of age in unthinned stands was of 40 cm, whereas in thinned stands it was of 43 cm. This result is in alignment with Zeide (2001), who found that thinning increases the growth of individual trees, despite reducing their number and the volume growth of the entire stand.
Conclusions
1. The prognosis system developed is precise and accurate in estimating loblolly pine (Pinus taeda) basal area production per hectare or per diameter classes.
2. There is compatibility in basal area estimates between diameter classes and whole stand models, with a mean difference of -0.01 m2 ha-1.
3. The validation scheme applied is logic and consistent, since information on the accuracy and precision of the models is obtained without the loss of any information in the estimation of the models’ parameters.
Acknowledgments
To Coordenação de Aperfeiçoamento de Pessoal de Nível Superior (Capes), for financial support; to Colonvade S.A. and all the personnel involved in the data collection, for support.
References
ARCEBI JUNIOR, F.W.; SCOLFORO, J.R.S.; OLIVEIRA, A.D. de; MAESTRI, R. Modelo para prognose do crescimento e da
produção e análise econômica de regimes de manejo para Pinus taeda L. Revista Árvore, v.26, p.699‑713, 2002. DOI: 10.1590/ S0100-67622002000600007.
BURKHART, H.E.; CAO, Q.V.; WARE, K.D. A comparison of
growth and yield prediction models for loblolly pine. Virginia:
Virginia Polytechnic Institute and State University, 1981. 59p. BUSSONI, A.; CABRIS, J. A financial evaluation of two
contrasting silvicultural systems applicable to Pinus taeda grown in north-east Uruguay. Southern Forests, v.72, p.163-171, 2011.
DOI: 10.2989/20702620.2010.547268.
CAO, Q.V. Predicting parameters of a Weibull function for modeling
diameter distribution. Forest Science, v.50, p.682‑685, 2004.
COBLE, D.W.; CAO, Q.V.; JORDAN, L. An annual tree survival
and diameter growth model for loblolly and slash pine plantations in East Texas. Southern Journal of Applied Forestry, v.36,
p.79‑84, 2012. DOI: 10.5849/sjaf.10‑032.
COSTAS, R.; DONAGH, P.M.; WEBER, E.; FIGUEREDO, S.; GÓMEZ, C.; IRSCHICK, P. Modelos predictivos de la
producción de Pinus taeda empleando variables vinculadas con las podas. Bosque, v.27, p.98‑107, 2006. DOI: 10.4067/
S0717‑92002006000200004.
COSTAS, R.; KORTH, S.; FIGUEREDO, S.; WEBER, E.; DONAGH, P.M.; FRIEDL, A.; HECK, J.; PORTO, M.A. Sistema
de ecuaciones de producción y crecimiento de Pinus taeda L. con variables asociadas a las podas. Investigación Agraria: Sistemas
y Recursos Forestales, v.16, p.136‑144, 2007. DOI: 10.5424/ srf/2007162‑01004.
Pesq. agropec. bras., Brasília, v.50, n.8, p.707‑717, ago. 2015 DOI: 10.1590/S0100‑204X2015000800009
CUBBAGE, F.; DONAGH, P.M.; BALMELLI, G.; OLMOS, V.M.; BUSSONI, A.; RUBILAR, R.; DE LA TORRE, R.; LORD, R.; HUANG, J.; HOEFLICH, V.A.; MURARA, M.; KANIESKI, B.; HALL, P.; YAO, R.; ADAMS, P.; KOTZE, H.; MONGES, E.; PÉREZ, C.H.; WIKLE, J.; ABT, R.; GONZALEZ, R.; CARRERO,
O. Global timber investments and trends, 2005-2011. New
Zealand Journal of Forestry Science, v.44, p.1-12, 2014. DOI:
10.1186/1179‑5395‑44‑S1‑S7.
DIÉGUEZ‑ARANDA, U.; BURKHART, H.E.; AMATEIS, R.L.
Dynamic site model for loblolly pine (Pinus taeda L.) plantations in the United States. Forest Science, v.52, p.262-272, 2006.
EISFELD, R. de L.; SANQUETTA, C.R.; ARCE, J.E.; MAESTRI, R.; WEBER, K.S. Modelagem do crescimento e da produção de
Pinus taeda L. por meio de função probabilística. Floresta, v.35,
p.317‑328, 2005.
FERRAZ FILHO, A.C. Sistema de prognose do crescimento e
produção para Pinus taeda L. sujeito a regimes de desbastes e
podas. 2009. 147p. Dissertação (Mestrado) – Universidade Federal
de Lavras, Lavras.
FOX, T.R.; JOKELA, J.E.; ALLEN, H.L. The development of pine
plantation silviculture in the southern United States. Journal of
Forestry, v.105, p.337-347, 2007.
HASENAUER, H.; BURKHART, H.E.; AMATEIS, R.L. Basal area
development in thinned and unthinned loblolly pine plantations.
Canadian Journal of Forest Research, v.27, p.265‑271, 1997. DOI: 10.1139/x96‑163.
HIRIGOYEN, A.; RACHID, C. Selección de funciones de
distribución de frecuencias diamétricas, para Pinus taeda,
Eucalyptus globulus y Eucalyptus dunnii en Uruguay. Bosque,
v.35, p.369‑376, 2014. DOI: 10.4067/S0717‑92002014000300011. JOKELA, E.J.; MARTIN, T.A.; VOGEL, J.G. Twenty‑five years
of intensive forest management with southern pines: important lessons learned. Journal of Forestry, v.108, p.338‑347, 2010. LEITES, L.P.; ZUBIZARRETA‑GERENDIAIN, A.; ROBINSON, A.P. Modeling mensurational relationships of plantation‑grown loblolly
pine (Pinus taeda L.) in Uruguay. Forest Ecology and Management,
v.289, p.455‑462, 2013. DOI: 10.1016/j.foreco.2012.10.016.
MENDELL, B.; MORALES, V.; BENNADJI, Z.; MORENO, A.; SIRY, J. Financing Uruguay’s forestry sector: survey and case
study. Journal of Forestry, v.105, p.125-130, 2007.
MERGANIC, J.; STERBA, H. Characterisation of diameter
distribution using the Weibull function: method of moments.
European Journal of Forest Research, v.125, p.427‑439, 2006. DOI: 10.1007/s10342‑006‑0138‑2.
MIGUEL, E.P.; MACHADO, S. do A.; FIGUEIREDO FILHO, A.; ARCE, J.E. Using the Weibull function for prognosis of yield
by diameter class in Eucalyptus urophylla stands. Cerne, v.16,
p.94‑104, 2010. DOI: 10.1590/S0104‑77602010000100011. OLIVEIRA, M.L.R. de; LEITE, H.G.; NOGUEIRA, G.S.; CAMPOS, J.C.C. Modelagem e prognose em povoamentos
não desbastados de clones de eucalipto. Revista Árvore, v.33,
p.841‑852, 2009. DOI: 10.1590/S0100‑67622009000500007. OLMOS, V.M.; SIRY, J.P. Economic impact evaluation of Uruguay
forest sector development policy. Journal of Forestry, v.107,
p.63‑68, 2009.
PETRÁŠ, R.; MECKO, J.; NOCIAR, V. Diameter structure of
the stands of poplar clones. Journal of Forest Science, v.56, p.165-170, 2010.
QIN, J.; CAO, Q.V.; BLOUIN, D.C. Projection of a diameter
distribution through time. Canadian Journal of Forest Research,
v.37, p.188‑193, 2007. DOI: 10.1139/x06‑216.
RACHID, C.C.; MASON, E.G.; WOOLLONS, R.; RESQUIN, F.
Volume and taper equations for P. taeda (L.) and E. grandis (Hill ex. Maiden). Agrociencia Uruguay, v.18, p.47‑60, 2014.
REDO, D.J.; AIDE, T.M.; CLARK, M.L.; ANDRADE‑NÚÑEZ, M.J. Impacts of internal and external policies on land change
in Uruguay, 2001‑2009. Environmental Conservation, v.39,
p.122‑131, 2012. DOI: 10.1017/S0376892911000658.
RÍO, M. del; CALAMA, R.; CAÑELLAS, I.; ROIG, S.;
MONTERO, G. Thinning intensity and growth response in SW-European Scots pine stands. Annals of Forest Science, v.65,
p.308p1‑308p10, 2008. DOI: 10.1051/forest:2008009.
RUBILAR, R.; FOX, T.; ALLEN, H.; ALBAUGH, T.; CARLSON,
C. Manejo intensivo al establecimiento de plantaciones forestales de Pinus sp. y Eucalyptus sp. en Chile y Argentina. Informaciones Agronómicas del Cono Sur, v.40, p.1‑7, 2008.
SALLES, T.T.; LEITE, H.G.; OLIVEIRA NETO, S.N. de; SOARES, C.P.B.; PAIVA, H.N. de; SANTOS, F.L. dos. Modelo
de Clutter na modelagem de crescimento e produção de eucalipto
em sistemas de integração lavoura‑pecuária‑floresta. Pesquisa
Agropecuária Brasileira, v.47, p.253‑260, 2012. DOI: 10.1590/
S0100‑204X2012000200014.
SCOLFORO, J.R.S. Um modelo para simulação de desbastes
seletivos. Floresta, v.23, p.3‑13, 1993.
SCOLFORO, J.R.S.; MACHADO, S.A. Curvas de índice de sítio
para plantações de Pinus taeda nos estados do Paraná e Santa
Catarina. Revista Floresta, v.18, p.140‑158, 1988.
SIMARD, S.W.; BLENNER‑HASSETT, T.; CAMERON, I.R. Pre‑commercial thinning effects on growth, yield and mortality in
even-aged paper birch stands in British Columbia. Forest Ecology and Management, v.190, p.163‑178, 2004. DOI: 10.1016/j. foreco.2003.09.010.
SIX, L.J.; BAKKER, J.D.; BILBY, R.E. Loblolly pine germination
and establishment in plantations and grasslands of northern Uruguay. Forest Ecology and Management, v.302, p.1-6, 2013.
DOI: 10.1016/j.foreco.2013.02.032.
SIX, L.J.; BAKKER, J.D.; BILBY, R.E. Vegetation dynamics in
a novel ecosystem: agroforestry effects on grassland vegetation in Uruguay. Ecosphere, v.5, p.1‑15, 2014. DOI: 10.1890/ES13‑
00347.1.
SKOVSGAARD, J.P. Analysing effects of thinning on stand
volume growth in relation to site conditions: a case study for even-aged Sitka spruce (Picea sitchensis (Bong.) Carr.). Forestry,
v.82, p.87‑104, 2009. DOI: 10.1093/forestry/cpn047.
SOARES, P.; TOMÉ, M.; SKOVSGAARD, J.P.; VANCLAY, J.K.
Evaluating a growth model for forest management using continuous forest inventory data. Forest Ecology and Management, v.71,
SOARES, T.S.; LEITE, H.G.; SOARES, C.P.B.; VALE, A.B. Procedures for theoretical redistribution of diameters in
eucalyptus stands. Cerne, v.16, p.68‑76, 2010. DOI: 10.1590/ S0104‑77602010000100008.
SULLIVAN, A.D.; CLUTTER, J.L. A simultaneous growth and
yield model for loblolly pine. Forest Science, v.18, p.76‑86, 1972.
URUGUAY. Ministerio de Ganadería, Agricultura y Pesca. Anuario
estadístico agropecuário. 2014. Disponible en: <http://www. mgap.gub.uy/portal/page.aspx?2,diea,diea‑anuario‑2014,O,es,0,>.
Accedido el: 10 jun. 2015.
VANCLAY, J.K.; SKOVSGAARD, J.P. Evaluating forest growth
models. Ecological Modelling, v.98, p.1‑12, 1997. DOI: 10.1016/ S0304‑3800(96)01932‑1.
VIHERVAARA, P.; MARJOKORPI, A.; KUMPULA, T.; WALLS, M.; KAMPPINEN, M. Ecosystem services of fast‑growing tree
plantations: a case study on integrating social valuations with land-use changes in Uruguay. Forest Policy and Economics, v.14,
p.58‑68, 2012. DOI: 10.1016/j.forpol.2011.08.008.
WHITE, E.H.; POU, R. World forestry: overview of forestry in
Uruguay. Journal of Forestry, v.78, p.746‑747, 1980.
ZEIDE, B. Thinning and growth: a full turnaround. Journal of Forestry, v.99, p.20‑25, 2001.
ZHANG, X.; LEI, Y.; CAO, Q.V. Compatibility of stand basal area
predictions based on forecast combination. Forest Science, v.56, p.552-557, 2010.