Revista Brasileira de
Engenharia Agrícola e Ambiental
Campina Grande, PB, UAEA/UFCG – http://www.agriambi.com.br
v.20, n.10, p.918-924, 2016
Determination of homogeneous zones for liming recommendations
of black pepper using geostatistics
Ivoney Gontijo
1, Eduardo O. de J. Santos
2, Fábio L. Partelli
1, Andreia B. P. L. Gontijo
1& Fábio R. Pires
1DOI: http://dx.doi.org/10.1590/1807-1929/agriambi.v20n10p918-924
A B S T R A C T
Studies aimed at determining homogeneous zones and the spatial variability of soil characteristics may improve the efficiency of agricultural input applications. The purpose of this study was to determine homogeneous zones for liming applications and to characterize the spatial variability of characteristics related to soil acidity and productivity in an Oxisol cultivated with black pepper (Piper nigrum L.). This study was carried out in São Mateus, state of Espírito Santo, Brazil. The experimental site was 100 x 120 m. A grid with 126 sampling points was established. Three soil sub-samples were collected at each sampling point in the black pepper canopy areas, at a 0-0.20 m depth. Crop productivity was estimated by harvesting the three plants neighboring each sampling point. Descriptive statistics and geostatistical analyses were performed. Homogeneous management zones were defined based on map of liming needs. Mathematical models adjusted to semivariograms indicated that all of the studied variables exhibited spatial dependency. An analysis of the spatial variability together with the definition of homogeneous zones can be used to increase the efficiency of soil liming.
Zonas homogêneas para recomendação de calagem
para pimenta-do-reino utilizando a geoestatística
R E S U M O
Objetivou-se, no presente estudo, caracterizar a variabilidade espacial dos atributos relacionados à acidez do solo, a necessidade de calagem e a produtividade de reino sob um Latossolo Amarelo. O estudo foi realizado em uma lavoura de pimenta-do-reino, no município de São Mateus, ES. A área experimental possui dimensões de 100 x 120 m na qual demarcou-se uma malha com 126 pontos. Em cada ponto amostral foram coletadas três subamostras de solo na projeção da copa da pimenteira-do-reino compondo uma amostra na profundidade de 0-0,20 m. A produtividade da lavoura foi estimada por meio da colheita das três plantas circunvizinhas a cada ponto amostral. Os resultados obtidos foram submetidos à análise da estatística descritiva e à análise geoestatística. O mapa da necessidade de calagem possibilitou a delimitação das zonas homogêneas de taxas de calcário a serem aplicadas ao solo. Os modelos matemáticos ajustados aos semivariogramas demonstraram que todas as variáveis em estudo apresentaram estrutura de dependência espacial. O conhecimento da variabilidade espacial associada à definição de zonas homogêneas pode ser usado para aumentar a eficiência de aplicação de calcário.
Key words: Piper nigrum L. spatial variability fertilization management
Palavras-chave: Piper nigrum L. variabilidade espacial manejo da adubação
1 Universidade Federal do Espírito Santo/Departamento de Ciências Agrárias e Biológicas. São Mateus, ES. E-mail: ivoney.gontijo@ufes.br (Corresponding
author); partelli@yahoo.com.br; albarcelos@hotmail.com; fabiopires@pq.cnpq.br
2 Instituto de Defesa Agropecuária e Florestal do Espírito Santo. São Mateus, ES. E-mail: eduardoliviera@hotmail.com
Introduction
Black pepper (Piper nigrum L.) is grown in environments with high soil and climate variability. Low soil fertility and acidity limit crop productivity. Therefore, liming and fertilization can greatly increase crop productivity.
When crops are managed homogeneously, lime and fertilizer applications do not take into consideration the variability of an area. This can result in excess or insufficient inputs in some zones of the sampled area, resulting in lower average productivity and higher expenditures compared with systems using differentiated management based on precision agriculture (Bottega et al., 2013). Precision agriculture is widely implemented, particularly for soil fertility management. The correlation between productivity maps and soil attributes has allowed for more precise and strategic crop management decisions (Zucoloto et al., 2011) and may decrease the environmental impacts (Gontijo et al., 2012). Therefore, geostatistics is an important tool for analyzing the spatial distribution of soil characteristics. It also allows for the quantification of the magnitude and degree of spatial dependency and for a detailed description of the spatial variability of the studied variables using an accurate and precise interpolator (Lima et al., 2013).
Liming increases productivity in soils with high acidity and low Ca and Mg concentrations. However, improvements are not immediate, only occurring after a few years. Pauletti et al. (2014) described how, during the first three years, the effect of liming was restricted to the surface 10 cm, but over six years, it reached to a depth of 20 cm.
Although previous studies obtained promising results for the characterization of the liming needs, in this paper a geostatistical approach is adopted to verify the hypothesis that there is a spatial variability of liming needs in an area that is usually considered homogeneous; causing nutritional imbalance in crops. Within this context, the purpose of this study was to establish homogeneous areas for liming application and to characterize the spatial variability of characteristics related to soil acidity and productivity in a Latosol cultivated with black pepper, using geostatistics.
Material and Methods
The experiment was conducted in a black pepper crop of the Bragantina variety; it was established in March 2008 with 3.0 x 1.8 m spacing (1,852 plants ha-1) and micro-sprinkler irrigation. The study area was located in São Mateus, in northern Espírito Santo (ES), Brazil, at 18° 41’ 55’’ S and 40° 3’ 10’’ W, at 30 m mean altitude. The relief was predominantly gently undulating, with average slopes varying between 3 and 8%. The soil was classified as dystrophic Yellow-Red Latosol (Oxisol), with a sandy loam texture and 344, 113 and 543 g kg-1 of clay, silt and sand contents, respectively (EMBRAPA, 2013).
When the crop was established, the soil was amended with 2.0 Mg ha-1 of dolomitic limestone. For each meter of furrow, 5 kg of compost mix consisting of conilon coffee straw and chicken manure (3:2) and 300 g of single superphosphate (18% P2O5) were applied at transplanting. During crop
formation over the first year following transplanting, monthly fertilizations with NPK 25-00-25 were performed. The applied doses increased over the first six months (20, 25, 30, 35, 40 and 45 g plant-1) and were held constant at 50 g plant-1 over the following six months, for a total of 230 kg ha-1 year-1 of K
2O and N. The annual fertilization during production, starting with the second year following planting, consisted of four NPK 25-00-25 applications, based on technical recommendations (Prezotti et al., 2007) using soil analyses.
In January 2010, a 100 x 120 (12,000 m2) rectangular grid with 126 sampling points and 5 m minimum spacing was set up (Figure 1). Georeferencing was performed using a pair of TechGeo® GTR G2 geodetic GPS receptors. Following processing by the Brazilian Network for Continuous Monitoring (Rede Brasileira de Monitoramento Contínuo - RBMC) of the Brazilian Institute of Geography and Statistics (Instituto Brasileiro de Geografia e Estatística - IBGE), the data exhibited 10 mm + 1 ppm precision. For chemical characterization of soil, three sub-samples were collected from a 0-0.20 m depth at each sampling point at the black pepper crown projection areas using a stainless steel probe. Sub-samples from each sampling point were combined into single samples. The potential acidity (H + Al), aluminum (Al), potential CEC (T), pH in water and base saturation (V) were measured based on methods from Silva (2009).
The liming needs (LN) were determined based on the Manual of Liming and Fertilization Recommendations for the state of Espírito Santo (Manual de Recomendação de Calagem e Adubação para o Estado do Espírito Santo) (Prezotti et al., 2007) using the base saturation method and increasing the base saturation level to 70%. A 100% lime TNP (Total Neutralizing Power) was considered. Productivity was estimated by harvesting the three plants neighboring each sampling point and multiplying their average by the number of plants per hectare (1,852 plants ha-1).
The obtained data were subjected to a descriptive statistical analysis. The mean, median, coefficient of variation, asymmetry and kurtosis were calculated. Normality was tested using the Shapiro-Wilk test at p < 0.05. All analyses were performed using the Action V. 2.3 software (Action Development Core Team, 2012).
Figure 1. Digital representation of the terrain with the spatial distribution of the sampling points
Height (m)
South - North (m)
A geostatistical analysis was performed and semivariograms were built to determine the structure of spatial dependency of the soil chemical and productivity parameters studied, namely, to determine whether the variations were systematic or random. Analysis of the spatial dependency was performed using GS+ 7® software (Gamma Design Software, 2004), which calculates a sample semivariance. A semivariogram is a graphical representation that relates the semivariance γ(h), which is plotted on the Y-axis, and its proximity to the distance between data points (h), which are plotted on the X-axis. Data were analyzed by geostatistical methods according Vieira (2000), based on hypothetical intrinsic stationarity assumptions to study the spatial variability of soil properties. Semivariance γ(h) was applied to calculate the partial autocorrelation among local neighbors, as shown in Eq. 1:
by Vieira (2000) using Surfer 7.0 software (Golden Software Inc., 1999).
Isoline maps of liming needs allowed the delineation of homogeneous zones of management. The number of studied zones was defined based on "feeling", where the researcher specified the number of zones on which he/she wished to work, based on easily interpreted criteria (Silva Júnior et al., 2012). Three homogeneous management zones were defined based on the ease of agricultural planning and input management performance (Silva Júnior et al., 2012; Nascimento et al., 2014). Based on the definition of homogeneous zones, the arithmetic mean liming needs were calculated, considering all sampling points for each delimited region on the liming need map.
Results and Discussion
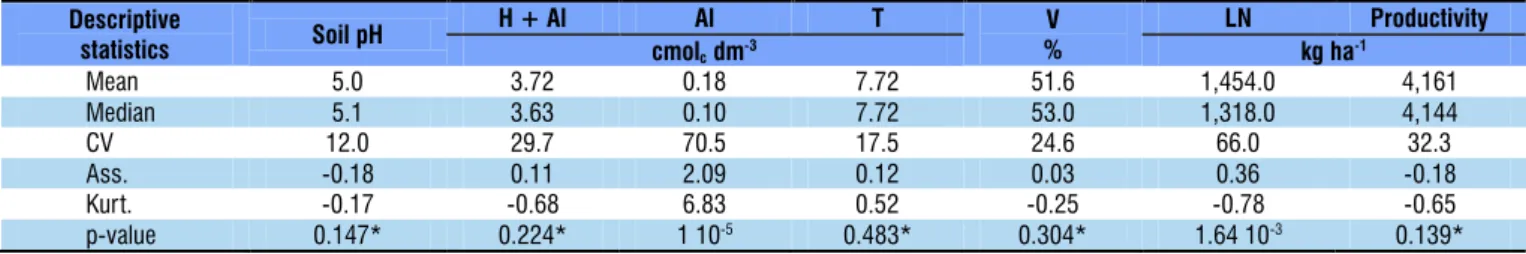
Descriptive statistics was applied to assess the central tendency and dispersion moments. It is useful for summarizing data, quality control, identifying meaningful populations and identifying outliers or extreme values (Outeiro et al., 2008). The obtained means and medians (measures of central tendency) were similar for more than 85% of the tested parameters, indicating symmetric data distribution. This was confirmed by lower asymmetry coefficient and kurtosis values, which were close to zero (Table 1). All of the measured parameters, except Al and LN, had normal distributions according to the Shapiro-Wilk test at p < 0.05.
The parameter means related to soil acidity were low (Al) and intermediate (soil pH, H+Al, T and V) based on the soil fertility index for the state of Espírito Santo, proposed by Prezotti et al. (2007) (Table 1).
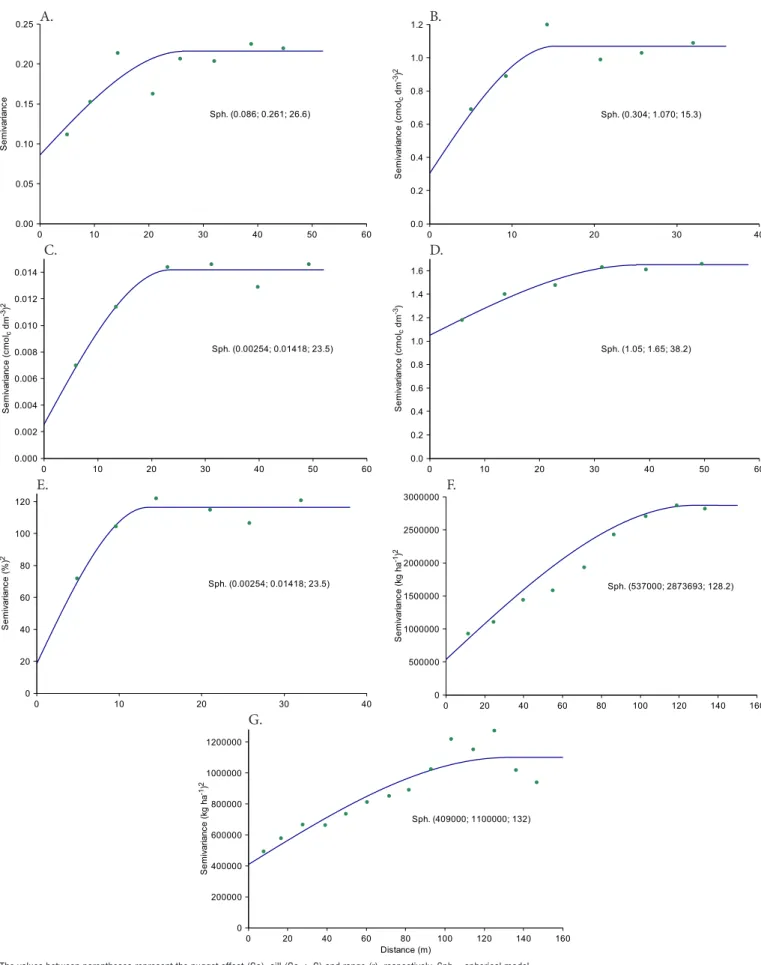
All of the studied variables exhibited spatial dependency, expressed through model fitting to the semivariograms (Figure 2; Table 2). The spherical model best fitted the experimental semivariograms for all of the soil chemistry parameters measured. Similar results were found by Barbieri et al. (2008), for V and LN in a eutrophic Yellow-Red Ultisol and by Lima et al. (2010), for pH, H + Al, T and V in a Yellow-Red Ultisol.
The pH exhibited an intermediate coefficient of variation (CV) based on the classification proposed by Warrick & Nielsen (1980). The soil pH measured in water usually presented a low CV (Hurtado et al., 2009). However, this result reflects the variation at the study site, which can be observed for the pH on the isoline map (Figure 3) and was probably influenced by the slope and soil management variations. Intermediate CVs
( )
(
) ( )
( )
( )
n h2
i i
i 1
z x h z x h
2n h
=
+ −
γ =
∑
where:
n(h) - number of sampling pairs [z(xi); z(xi + h)] separated by each distance h and z(xi); and,
z(xi + h) - observed values of the analyzed parameter, at points xi and xi + h, which are separated by distance h.
To fit theoretical models to the experimental semivario-grams, the nugget effect (Co), sill (Co + C) and range (R) were determined. Spherical, exponential and Gaussian models were tested. In cases where more than one model of the same semivariogram fit, the one with highest cross-validated correlation coefficient and lowest RSS (residual sum of squares) was selected, in this order (Amado et al., 2007). The spatial dependence index (SDI), which is the proportion of the nugget effect (Co) relative to the sill (Co + C1), as a percentage, was calculated according to Eq. 2:
o
o 1 C
SDI 100
C C
= +
CV - Coefficient of variation (%); Ass. - Coefficient of asymmetry; Kurt. - Kurtosis; T - Potential CEC; V - Base saturation; LN - Liming need; * - Normal distribution at p < 0.05 according to the Shapiro-Wilk test
Descriptive
statistics Soil pH
H + Al Al T V
%
LN Productivity
cmolcdm-3 kg ha-1
Mean 5.0 3.72 0.18 7.72 51.6 1,454.0 4,161
Median 5.1 3.63 0.10 7.72 53.0 1,318.0 4,144
CV 12.0 29.7 70.5 17.5 24.6 66.0 32.3
Ass. -0.18 0.11 2.09 0.12 0.03 0.36 -0.18
Kurt. -0.17 -0.68 6.83 0.52 -0.25 -0.78 -0.65
p-value 0.147* 0.224* 1 10-5 0.483* 0.304* 1.64 10-3 0.139*
Table 1. Descriptive statistics of soil pH, potential acidity, aluminum, potential cation exchange capacity (CEC), base saturation, liming need and black pepper productivity (n = 126)
The spatial dependence index was classified based on Cambardella et al. (1994) as strong (SDI < 25%), moderate (25% < SDI < 75%) and weak (SDI > 75%).
After the spatial autocorrelation among samples had been demonstrated by semivariogram analysis, values with no tendencies and minimal variation were interpolated for non-sampled sites by the ordinary kriging method described (1)
0.00 0.05 0.10 0.15 0.20 0.25
0 10 20 30 40 50 60
Sph. (0.086; 0.261; 26.6)
Semi
varianc
e
0.0 0.2 0.4 0.6 0.8 1.0 1.2
0 10 20 30 40
Sph. (0.304; 1.070; 15.3)
Semi
varianc
e(
cmo
lc
dm
-3)
2
0.000 0.002 0.004 0.006 0.008 0.010 0.012 0.014
0 10 20 30 40 50 60
Sph. (0.00254; 0.01418; 23.5)
Semi
varianc
e(
cmo
lc
dm
-3)
2
0.0 0.2 0.4 0.6 0.8 1.0 1.2 1.4 1.6
0 10 20 30 40 50 60
Sph. (1.05; 1.65; 38.2)
Semi
varianc
e(
cmo
lc
dm
-3)
0 20 40 60 80 100 120
0 10 20 30 40
Sph. (0.00254; 0.01418; 23.5)
Semi
varianc
e(
%)
2
0 500000 1000000 1500000 2000000 2500000 3000000
0 20 40 60 80 100 120 140 160
Sph. (537000; 2873693; 128.2)
Semi
varianc
e(
kg
ha
-1)
2
0 200000 400000 600000 800000 1000000 1200000
0 20 40 60 80 100 120 140 160
Sph. (409000; 1100000; 132)
Semi
varianc
e(
kg
ha
-1)
2
Distance (m)
A. B.
C. D.
E. F.
G.
The values between parentheses represent the nugget effect (Co), sill (Co + C) and range (r), respectively. Sph. - spherical model
Figure 2.Semivariograms for pH (A), potential acidity (B), aluminum (C), potential CEC (D), base saturation (E), productivity of a black pepper crop (F) and liming need (G)
were observed for H + Al, T, V and black pepper productivity, and high CVs were observed for Al and LN. The high CVs observed for aluminum can be explained by the non-normal distribution of the data. Similar results were found for H + Al
Table 2.Model and estimated parameters of experimental semivariograms of the studied variables
Parameters pH H+Al Al T V
%
LN Productivity
cmolcdm-3 kg ha-1
SDI 39.8 28.4 17.9 63.6 15.9 37.2 18.7
R2 0.700 0.800 0.963 0.966 0.923 0.846 0.940
CVRC 0.913 0.642 0.713 0.565 0.691 0.923 0.939
pH - Potential of hydrogen; H + Al - Potential acidity; Al - Aluminum; T - Potential CEC; V - Base saturation; LN - Liming need; SDI - Spatial dependence index; R2 - Coefficient of determination; CVRC - Cross-validation regression coefficient
Height (m)
South - North (m)
East - West (m)
A.
Height (m)
South - North (m)
East - West (m)
B.
Height (m)
South - North (m)
East - West (m)
Height (m)
South - North (m)
East - West (m)
C. D.
E. F.
Height (m)
South - North (m)
East - West (m)
Height (m)
South - North (m)
East - West (m)
Figure 3.Isoline maps of pH (A), potential acidity (B), aluminum (C), potential CEC (D), base saturation (E) and productivity (F), at a black pepper plantation
The spatial dependence index was classified as moderate (SDI between 25 and 75%) for the pH, H + Al, T and LN parameters and was classified as strong (SDI < 25%) for Al, V and black pepper productivity. The lower the ratio of the nugget effect relative to the semivariogram sill was, the higher the spatial dependence presented by the studied parameters. Therefore, the kriging method results in better estimates on non-sampled sites and higher phenomenon continuity, lower estimated variance and higher confidence in the estimated value (Lima et al., 2010).
The range indicates the distance at which the sampling points were correlated. The range values varied between 13.5 and 132 m for V and LN, respectively. Souza et al. (2007) studied spatial variability in a eutroferric Red Latosol and observed the lowest range in V, indicating lower structural continuity for this parameter. In this study, a minimum 5 m distance between samples was adopted, which enabled the detection of variations over short distances. Cherubin et al. (2014) adopted a 100 m minimum distance between sampling points in a Red Latosol managed using precision agriculture and concluded that the grids were not efficient for the detection of spatial variability of soil pH measured in water, base saturation and Ca and Mg concentrations, which may have compromised the precision of the corrective soil application.
The area of the study site with more pronounced declivity, facing east, presented soil fertility that was less favorable to crop development (Figure 3). In this area, the soil was more acidic, as indicated by the lower pH values and base saturation, and consequently needed higher doses of soil acidity corrective (Figure 4). This is probably due to the higher erosion rates because the cultivation of black pepper results in high soil exposure, favoring erosion. The present experimental results supported the hypothesis of this study. Therefore, is important to know the spatial variability of liming needs to avoid any eventual nutritional imbalance in the black pepper plantation.
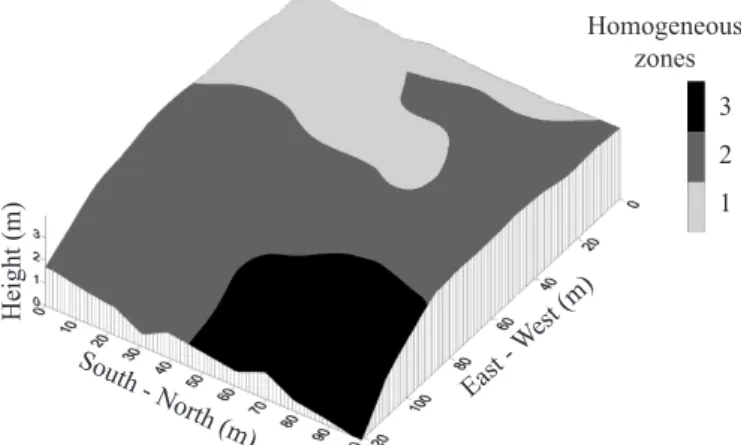
Three homogeneous LN zones were established at the study site (Figure 4), making lime application easier for farmers. This is in accordance with previous studies, such as that of Rodrigues Júnior et al. (2011), who studied an Arabica coffee plantation and divided the experimental site of 2.1 ha into three classes. Silva Júnior et al. (2012) studied a typical dystrophic Red Latosol cultivated with sugar cane and divided the study site of 158 ha into three zones based on soil chemical parameters.
Differences in the LN were observed between the two tested methods: homogeneous zones based on precision agriculture and traditional methods with a single recommendation for the whole area (Table 3). Using traditional methods, the liming recommendation was 1,454 kg ha-1. The adoption of the conventional method would result in corrective application higher than needed for a portion of the studied site in homogeneous zone 1 (Figure 4). This would result in
over-liming and a consequent nutritional imbalance due to excess of Ca and Mg and the unavailability of cation micronutrients and phosphorus, compromising black pepper crop productivity. For management zone 3, comprising areas with lower altitudes (dark color), lime application would be lower than needed and insufficient for raising the pH to adequate levels for more efficient use of applied fertilizers. Lime application according to the traditional method would only be adequate for management zone 2 (grey color).
Oliveira et al. (2008) compared sampling method recommendations of liming needs for a conilon coffee crop and highlighted that spatial data analysis using geostatistics enabled the identification of areas with deficient or excess liming and fertilization, which could not be defined using the traditional sampling method.
Conclusions
1. All of the studied variables exhibited spatial dependence. 2. The spherical model represented the best fit for all of the analyzed variables.
3. Characterization of the spatial variability of soil characte-ristics was effective for the definition of homogeneous zones in the application of lime in a black pepper plantation.
4. Knowledge on spatial variability and the definition of homogeneous zones can be used to increase the efficiency of soil lime applications.
Acknowledgments
The authors thank the farmer Mr. Eliseu Bonomo, for allowing the implementation of the experimental area and to the Agronomic Engineer Ítalo Bonomo, for the technical advisory during the research. To FAPES for the financial support.
Literature Cited
Action Development Core Team. Action 2.3. São Carlos: ESTATCAMP, 2012. <http://www.portalaction.com.br/content/download-action>. 16 Nov. 2015.
Amado, T. J. C.; Pontelli, C. B.; Santi, A. L.; Viana, J. H. M.; Sulzbach, L. A. S. Variabilidade espacial e temporal da produtividade de culturas sob sistema de plantio direto. Pesquisa Agropecuária Brasileira, v.42, p.1101-1110, 2007. http://dx.doi.org/10.1590/ S0100-204X2007000800006
Barbieri, D. M.; Marques Júnior, J.; Pereira, G. T. Variabilidade espacial de atributos químicos de um Argissolo para aplicação de insumos à taxa variável em diferentes formas de relevo. Engenharia Agrícola, v.28, p.645-653, 2008. http://dx.doi.org/10.1590/S0100-69162008000400004
Figure 4.Map of liming need homogeneous zones on a black pepper plantation
Homogeneous zones
3
2
1
Height (m)
South - North (m)
East - West (m)
Table 3. Difference in the liming need (LN) between homogeneous zones and traditional methods (kg ha-1)
Homogeneous management zones
Traditional method
1 2 3
Bottega, E. L.; Queiroz, D. M. de; Pinto, F. de A. C.; Souza, C. M. A. Variabilidade espacial de atributos do solo em sistema de semeadura direta com rotação de culturas no cerrado brasileiro. Revista Ciência Agronômica, v.44, p.1-9, 2013. http://dx.doi. org/10.1590/S1806-66902013000100001
Cambardella, C. A.; Mooman, T. B.; Novak, J. M.; Parkin, T. B.; Karlem, D. L.; Turvo, R. F.; Konopa, A. E. Field-scale variability of soil properties in Central Iowa Soils. Soil Science Society of America, v.58, p.1501-1511, 1994. http://dx.doi.org/10.2136/ sssaj1994.03615995005800050033x
Cherubin, M. R.; Santi, A. L.; Eitelwein, M. T.; Ros, C. O. da; Bisognin, M. B. Sampling grids used to characterise the spatial variability of pH, Ca, Mg and V% in Oxisols. Revista Ciências Agronômicas, v.45, p.659-672, 2014. http://dx.doi.org/10.1590/ S1806-66902014000400004
EMBRAPA - Empresa Brasileira de Pesquisa Agropecuária. Sistema brasileiro de classificação de solos.3.ed. Rio de Janeiro: Embrapa Solos, 2013. 353p.
Gamma Design Software. Geoestatistics for the environmental sciences. Version 7.0. Plainwell: Gamma Design Software, 2004. CD-Rom
Golden Software Inc. Surfer for Windows: Release 7.0, contouring and 3D surface mapping for scientist’s engineers User’s Guide. New York: Golden Software Inc., 1999. 619p.
Gontijo, I.; Nicole, L. R.; Partelli, F. L.; Bonomo, R.; Santos, E. O. J. Variabilidade e correlação espacial de micronutrientes e matéria orgânica do solo com a produtividade da pimenta-do-reino. Revista Brasileira de Ciência do Solo, v.36, p.1093-1102, 2012. http://dx.doi.org/10.1590/S0100-06832012000400004
Hurtado, S. M. C.; Silva, C. A.; Resende, Á. V.; Pinho, R. G. V.; Inácio, E. S. B.; Higashikawa, F. S. Spatial variability of soil acidity attributes and the spatialization of liming requirement for corn. Ciência e Agrotecnologia, v.33, p.1351-1359, 2009. http://dx.doi. org/10.1590/S1413-70542009000500022
Lima, J. S. S.; Souza, G. S.; Silva, S. A. Amostragem e variabilidade espacial de atributos químicos do solo em área de vegetação natural em regeneração. Revista Árvore, v.34, p.127-136, 2010. http://dx.doi.org/10.1590/S0100-67622010000100014
Lima, J. S. S.; Souza, G. S.; Silva, S. A. Distribuição espacial da matéria orgânica, grau de floculação e argila dispersa em água em área de vegetação natural em regeneração e pastagem. Revista Árvore, v.37, p.539-546, 2013. http://dx.doi.org/10.1590/S0100-67622013000300017
Nascimento, P. S.; Silva, J. A.; Costa, B. R. S.; Bassoi, L. H. Zonas homogêneas de atributos do solo para o manejo de irrigação
em pomar de videira. Revista Brasileira de Ciência do Solo,
v.38, p.1101-1113, 2014. http://dx.doi.org/10.1590/S0100-06832014000400006
Oliveira, R. B.; Lima, J. S. S.; Xavier, A. C.; Passos, R. R.; Silva, S. A.; Silva, A. F. Comparação entre métodos de amostragem do solo para recomendação de calagem e adubação do cafeeiro conilon. Engenharia Agrícola, v.28, p.176-186, 2008. http://dx.doi. org/10.1590/S0100-69162008000100018
Outeiro, L.; Áspero, F.; Úbeda, X. Geostatistical methods to study spatial variability of soil cations after a prescribed fire and rainfall. Catena, v.74, p.310-320, 2008. http://dx.doi.org/10.1016/j. catena.2008.03.019
Pauletti, V.; Pierri, L.; Ranzan, T.; Barth, G.; Motta, A. C. V. Efeitos em longo prazo da aplicação de gesso e calcário no sistema de plantio direto. Revista Brasileira de Ciência do Solo, v.38, p.495-505, 2014. http://dx.doi.org/10.1590/S0100-06832014000200014 Prezotti, L. C.; Gomes, J. A.; Dadalto, G. G.; Oliveira, J. A.Manual de
recomendação de calagem e adubação para o estado do Espírito Santo - 5ª aproximação. Vitória: SEEA/INCAPER/CEDAGRO, 2007. 305p. Rodrigues Júnior, F. A.; Vieira, L. B.; Queiroz, D. M. de; Santos, N.
T. Geração de zonas de manejo para cafeicultura empregando-se sensor SPAD e análise foliar. Revista Brasileira de Engenharia Agrícola e Ambiental, v.15, p.778-787, 2011. http://dx.doi. org/10.1590/S1415-43662011000800003
Santos, E. O. J.; Gontijo, I.; Nicole, L. R. Variabilidade espacial de cálcio, magnésio, fósforo, potássio no solo e produtividade da pimenta-do-reino. Revista Brasileira de Engenharia Agrícola e Ambiental, v.16, p.1062-1068, 2012. http://dx.doi.org/10.1590/ S1415-43662012001000005
Santos, E. O. J.; Gontijo, I.; Silva, M. B. Spatial variability of soil acidity attributes and liming requirement for conilon coffee. Coffee Science, v.9, p.275-278, 2014.
Silva, F. C. da. Manual de análises químicas de solos, plantas e fertilizantes. 2.ed. rev. ampl. Brasília: Embrapa Informação Tecnológica; Rio de Janeiro: Embrapa Solos, 2009. 627p. Silva, S. A.; Lima, J. S. S.; Xavier, A. C.; Teixeira, M. M. Variabilidade
espacial de atributos químicos de um Latossolo Vermelho-Amarelo húmico cultivado com café. Revista Brasileira de Ciência do Solo, v.34, p.15-22, 2010. http://dx.doi.org/10.1590/S0100-06832010000100002
Silva Júnior, J. F.; Siqueira, D. S.; Marques Júnior, J.; Pereira, G. T. Classificação numérica e modelo digital de elevação na caracterização espacial de atributos dos solos. Revista Brasileira de Engenharia Agrícola e Ambiental, v.16, p.415-424, 2012. http:// dx.doi.org/10.1590/S1415-43662012000400012
Souza, Z. M.; Barbieri, D. M.; Marques Júnior, J.; Pereira, G. T.; Campos, M. C. C. Influência da variabilidade espacial de atributos químicos de um Latossolo na aplicação de insumos para cultura de cana-de-açúcar. Ciência e Agrotecnologia, v.31, p.371-377, 2007. http://dx.doi.org/10.1590/S1413-70542007000200016
Vieira, S. R. Geostatística em estudos de variabilidade espacial do solo. In: Novais, R. F.; Alvarez V., V. H.; Schaefer, G. R. (ed.). Tópicos em ciência do solo. Viçosa: SBCS, 2000, v.1, p.1-54.
Warrick, A. W.; Nielsen, D. R. Spatial variability of soil physical properties in the field. In: Hillel, D. (ed.) Applications of soil physics. New York: Academic, 1980. p.319-344. http://dx.doi. org/10.1016/B978-0-12-348580-9.50018-3