Ivandro Bertan(1), Fernando Irajá Félix de Carvalho(1), Antonio Costa de Oliveira(1), Giovani Benin(2), Eduardo Alano Vieira(3) and Igor Pirez Valério(1)
(1)Universidade Federal de Pelotas, Campus Universitário, s/no, CEP 96010-900 Pelotas, RS, Brazil. E-mail: [email protected],
[email protected], [email protected], [email protected] (2)Universidade Tecnológica Federal do Paraná, Via do Conhecimento,
Km 01, CEP 85501-970 Pato Branco, PR, Brazil. E-mail: [email protected] (3)Embrapa Cerrados, Caixa Postal 08223, CEP 73310-970
Planaltina, DF, Brazil. E-mail: [email protected]
Abstract – The objectives of this work were to estimate the genetic distance among wheat genotypes using morphological, pedigree, molecular, and combined morphological and molecular measures, to determine the correlations between these measures, and to evaluate the combining ability of the genotypes. Three generations and two planting designs were studied. Six wheat genotypes were crossed using a diallel design. The F1, F2 and F3 generations were evaluated in the ! eld, in the crop seasons of 2003, 2004 and 2005, under spaced plant and full-row planting designs. The estimated general and speci! c combining abilities of tested hybrids were in" uenced both by the generation and the planting design. The correlation coef! cients among the distance measures and between these measures and genotype performances of different generations for the two planting designs were low to moderate. In order to obtain a more precise estimate of the genetic distance among cultivars and its association with the hybrid performance, more than one generation, planting design, and genetic distance estimation technique should be employed.
Index terms: Triticum aestivum, combining ability, genetic variability, parental selection.
Distâncias morfológicas, genealógicas e moleculares e suas associações
com o desempenho de híbridos em trigo
Resumo – O objetivo deste trabalho foi estimar a distância genética entre genótipos de trigo, por meio de dados morfológicos, genealógicos, marcadores moleculares AFLP (“ampli! ed fragment length polymorphism”), usados individualmente ou simultaneamente, e calcular a correlação entre essas medidas de distância e a capacidade de combinação dos genótipos. Foram estudadas três gerações e dois sistemas de semeadura. Seis genótipos de trigo foram cruzados de forma dialélica. Os híbridos F1 e as populações F2 e F3 foram avaliados em campo, nos anos agrícolas de 2003, 2004 e 2005, com os esquemas de semeadura de planta espaçada e em linha cheia. As capacidades gerais e especí! cas de combinação dos híbridos testados foram in" uenciadas tanto pela geração quanto pelo esquema de semeadura. Os coe! cientes de correlação foram de baixo a moderado entre as medidas de distância e entre estas e o desempenho dos genótipos, nos dois esquemas de semeadura. Para a obtenção de uma estimativa ! el da distância genética entre cultivares e da sua associação com o desempenho dos híbridos, devem ser empregados mais de uma geração, sistema de semeadura e técnica de estimativa da distância genética.
Termos para indexação: Triticum aestivum, capacidade de combinação, variabilidade genética, seleção de genitores.
Introduction
Wheat is cultivated worldwide and despite its importance, the genetic information about wheat is less than the information available for rice and maize. In plant breeding, the correct selection of parents can maximize gains through breeding, using fewer resources. Genetic distance estimates help the breeder to better understand the germplasm organization, to
increase the ef! ciency of genotype sampling, and to indicate the best parental combinations to be used.
the best parental combinations and for a more rational use of germplasm. However, many studies indicate that the usefulness of such distance measures in selecting parental genotypes may be related to the genotype pool and the number of traits evaluated, as well as to the cultivation environment, and genotype x environment (GXE) interactions (Corbellini et al., 2002; Bertan et al., 2007; Vieira et al., 2007).
Roy et al. (2004) reported that the correlation between genetic distances estimated for wheat, using ampli! ed fragment length polymorphism (AFLP) markers and 14 morphological characters, was 0.072, indicating an association close to null. Máric et al. (2004) reported a small correlation (r = 0.12) between distances estimated using random ampli! ed polymorphic DNA (RAPD) markers and 12 morphological characters.
Studies using the inbreeding coef! cient in wheat did not reveal an association between genetic dissimilarity based on pedigree and morphological data (Reis et al., 1999). Likewise, Autrique et al. (1996) assessed the dissimilarity of 113 local genotypes of durum wheat
usingrestriction fragment length polymorphism (RFLP),
morphological characters, and inbreeding coef! cients and did not ! nd any signi! cant correlation between these techniques. However, Vieira et al. (2007) evaluated 19 wheat genotypes using AFLP and morphological markers and found a moderate correlation between morphological and molecular matrices, a high correlation between the matrices of the joint analysis (molecular and morphological markers) with the morphological matrix, and a moderate correlation between the matrices of the joint analysis with the morphological matrix.
The objectives of this work were to estimate the genetic distance between wheat genotypes based on morphological, pedigree, molecular, and combined morphological plus molecular data, and to determine the correlation among the genetic distance estimates and the combining abilities of wheat parental genotypes, using major agronomical important traits, under spaced plant and full-row planting designs.
Materials and Methods
Arti! cial crosses were performed between six wheat genotypes (Table 1) in the 2004 crop season, in a greenhouse of the Centro de Genômica e Fitomelhoramento, at the Faculdade de Agronomia Eliseu Maciel of Universidade Federal de Pelotas, RS, Brazil. A complete diallel design, without reciprocals,
was used. In the same year, a sample of F1 seeds from
each cross was sown in greenhouse for generation advance. In 2005, a sample of F2 seeds was used to
obtain the F3 generation.
In the fall of 2005, F1, F2, F3 and the parental genotype
seeds were sown in the ! eld as spaced plants and full-rows. In the ! rst, F1, F2 and parental populations were
set up in a complete randomized blocks design, with
three replicates. For F1 and parents, the plot consisted
of 10 plants, cultivated in a single 3-m row, with 0.3 m spacing between plants and between rows. For F2 and F3 populations, the plot consisted of 50 plants,
cultivated in ! ve rows with the same spacing as mentioned above. The following traits were evaluated: grain yield per plant (GYP), obtained from grain yield of individually threshed plants and measured in grams; number of fertile tillers per plant (NFTP), by counting the number of tillers of each plant individually; number of grains per ear (NGE), by counting the main ear of each plant; and weight of one thousand grains (WTG), obtained by measuring the weight of grains from the main ear converted to the weight of one thousand units in grams.
For full-row seeding, the plots were composed of ! ve 2-m long rows with 0.20 m spacing between rows. Seeding density was between 250 and 350 viable seeds per square meter. The following traits were evaluated: grain yield (GY in kg ha-1), number of fertile tillers per
square meter (NFT), number of grains per ear (NGE), and weight of one thousand grains (WTG in grams). The data obtained from spaced plant and full-row planting methods were subjected to a diallel analysis of variance, according to the model proposed by Grif! ng (1956).
Genotype Pedigree Owner(1)/location
ICA 5 EMBRAPA 16 / EMBRAPA 22 // ICA 2 ICA Melhoramento Genético/Paraná, Brazil
ICA 7 ICA 2 *2 / IPF 49870 // ICA 2 *2 / IPF 49561 ICA Melhoramento Genético/Paraná, Brazil
BRS 177 PF 83899 / PF 813 // F 27141 Embrapa Trigo/Rio Grande do Sul, Brazil
BRS 208 CPAC 89118 /3/ BR 23 // CEP 19/PF 85490 Embrapa Trigo/Rio Grande do Sul, Brazil
IPR 110 PF 85202 /3/ PAT 19 // Alondra SIB / PF 72707 Iapar/Paraná, Brazil
CD 111 OCEPAR 18 / EMBRAPA 27 // ANAHUAC 75 Coodetec/Paraná, Brazil
Table 1. Wheat genotypes considered in this study and their pedigree.
The six parents used in the crosses (Table 1) were evaluated in ! eld experiments carried out in 2003, 2004 and 2005, in a randomized complete blocks design, with three replicates. The plots consisted of 5-m long rows with 0.20 m spacing between rows with ! ve rows per plot and three rows harvested for evaluations. The parents were scored for 17 morphological traits, according to Scheeren (1984): days from emergence to " owering, days from emergence to maturation, days from " owering to maturation, plant height, number of fertile tillers per linear meter, weight of one thousand grains, hectoliter weight (test weight), grain yield, " ag leaf blade width, " ag leaf blade length, sheath length, peduncle length, ear length, number of spikelets per ear, ear weight, number of grains per ear, and number of grains per spikelet. The morphological data was used in the analysis of variance, considering the genotype and year effects as ! xed. Based on the average of the evaluated traits in the three years, the generalized
distance of Mahalanobis (D2) was estimated among all
parental genotypes, using the GENES software (Cruz, 2001).
For obtaining the AFLP markers, six primer combinations were used (M-CTA/E-ACT; M-CAA/ E-AGC; M-CAG/E-AGC; M-CAC/E-ACA; M-CAA/ E-ACA; M-CAG/E-ACT, in which E is EcoRI and M is MseI). The analysis was performed according to the protocol described by Vos et al. (1995). The ampli! ed fragments were separated in a 6% denaturing polyacrylamide gel and stained using a silver staining protocol (Creste et al., 2001). The AFLP data were scored as absence/presence of bands and used to estimate the genetic dissimilarity between parents, using the complement of the Dice similarity coef! cient (Dice, 1945), with the aid of the NTSYS pc 2.1 software (Rohlf, 2000).
The analysis of genetic distance between parents assessed with combined morphological and molecular marker data was performed using the complement of Gower’s similarity index (Gower, 1971), using the software MULTIV v. 2.3 (Pillar, 1997).
The estimate of the Malécot’s inbreeding coef! cient (Ferreira & Zambalde, 1997) was obtained using the pedigree data shown on Table 1 and those available in previous reports (Zeven & Zeven-Hissink, 1976; Zeven & Reiner, 1991). The software used was the SAS package (SAS Institute, 2002).
Four dendrograms were built using the Unweighted Pair Group Method with Arithmetic Mean (UPGMA)
clustering procedure, based on the dissimilarity matrices obtained from morphological traits, AFLP markers, combined analysis (morphological and molecular markers) and the inbreeding coef! cient complement. The ! tting between dissimilarity matrices and dendrograms was estimated using the cophenetic correlation coef! cient (r), according to Sokal & Rohlf (1962). For testing the correlation signi! cance among the four matrices, the matrix comparison test of Mantel was used, with 1,000 permutations (Mantel, 1967). These analyses were made using the NTSYS pc 2.1 software (Rohlf, 2000).
The association between genetic distance measures and the combining ability of parental genotypes for different characters, generations, and planting designs studied in the present work were estimated by Pearson’s simple correlation coef! cient.
Results and Discussion
In the combined analysis of F1 and F2 generations,
planted in the spaced plant method, all tested traits showed treatment differences (Table 2), indicating that all parents and their hybrid combinations were contrasting, and that differences were present in both generations. The generations showed signi! cant differences for vegetative cycle, weight of grains of the main ear, and weight of one thousand grains. Considering the combined analysis of two generations, the general combining ability (GCA) indicated that at least one parent had a different performance, except for weight of grains of the main ear. However, for speci! c combining ability (SCA) there was no signi! cant difference, which indicates the existence of reduced dominance and epistatic genic effects (speci! c complementarity) between the genotypes used. For the individual analysis of both generations (F1 and F2),
differences were observed for most of the traits, except for weight of grains of the main ear and number of fertile tillers per plant, in the F1 generation (Table 2). Also, in
the F1 generation, there were signi! cant differences
for all traits, except for weight of grains of the main ear (GCA) and number of fertile tillers (SCA). In the
F2 generation, the GCA showed signi! cant differences
for all traits. Despite that, signi! cant values of SCA were obtained only for vegetative cycle and weight of one thousand grains. A higher number of traits showed superior mean square values of GCA and SCA in the F1, when compared to the F2 generation, consistent with
similar to those obtained by Joshi et al. (2004), in which
signi! cant heterosis was detected in twelve agronomic
traits of 45 wheat hybrids, in the F1 and F2 generations.
In the full-row planting, the joint analysis of variance
for the F2 and F3 generations detected differences among
the treatments for all evaluated traits (Table 3). For the
Source of variation DF VC PS GYP GWPE NGE WTG NFT
Joint analysis F1and F2
Treatment 20 69.4* 72.7* 29.6* 0.12* 144.7* 152.1* 27.7*
GCA 5 208.7* 216.7* 68.5* 0.24 426.3* 415.8* 69.5*
SCA 15 22.9 24.7 16.6 0.08 50.8 64.2 13.8
Generation 1 255.5* 388.0 35.1 0.56* 11.6 723.0* 45.9
Treatment x Generation 20 13.3* 19.1* 19.3* 0.05* 67.7* 50.1* 9.6*
GCA x Generation 5 7.5 7.2 8.2* 0.04 96.4* 48.5* 5.6
SCA x Generation 15 15.2* 23.1* 23.0* 0.06* 58.1* 50.7* 10.9*
Error 80 3.3 6.0 3.2 0.06 1.0 0.9 3.2
Individual analysis of F1generation
Treatment 20 48.1* 50.2* 21.3 0.09* 154.9* 149.2* 21.7
GCA 5 128.7* 109.3* 31.0 0.17* 425.3* 358.1* 46.7*
SCA 15 21.2* 30.6* 18.1 0.07* 64.8* 79.6* 13.4
Error 40 7.8 11.6 14.2 0.02 17.0 13.9 13.2
Individual analysis of F2generation
Treatment 20 34.6* 41.6* 27.5* 0.07* 57.4* 53.0* 15.6*
GCA 5 87.4* 114.6* 45.5* 0.10* 97.5* 106.3* 28.4*
SCA 15 17.0* 17.3 21.5 0.06 44.0 35.2* 11.3
Error 40 8.0 14.7 12.5 0.03 24.2 11.8 8.0
CV (%) 2.8 4.8 20.8 12.9 11.4 10.9 16.4
Table 2. Mean squares obtained from joint and individual diallelic variance of F1 and F2 generations, in the spaced plant design, for seven wheat traits(1).
(1)GCA, general combining ability; SCA, speci! c combining ability; DF, degrees of freedom; VC, vegetative cycle; PS, plant stature; GYP, grain yield per
plant; GWPE, weight of grains of the main ear; NGE, number of grains per ear; WTG, weight of one thousand grains; NFT, number of fertile tillers. *Signi! cant at 5% probability by the F test.
Table 3. Mean squares obtained from joint and individual diallelic variance of F2 and F3 generations in full-row plant design, for seven wheat traits(1).
(1)GCA, general combining ability; SCA, speci! c combining ability; DF, degrees of freedom; VC, vegetative cycle; CR, reproductive cycle; TC, total cycle;
PS, plant stature; GYP, grain yield; HW, hectoliter weight; WTG, weight of one thousand grains. *Signi! cant at 5% probability by the F test.
Source of variation DF VC RC TC PS GY HW WTG
Joint analysis F1and F2
Treatment 20 98.9* 40.3* 30.4* 82.7* 80,242.9* 14.5* 31.1*
GCA 5 226.5* 30.6 99.2* 234.7 132,742.8 34.1 91.0*
SCA 15 56.42* 43.6* 7.5 32.1 62,743.9 8.0 11.2
Generation 1 737.0 2,543.2 6,019.3 184.1 83,690.4 123.4 263.6
Treatment x generation 20 16.2* 15.7* 7.6* 47.8* 102,731.7* 11.9* 18.9*
GCA x generation 5 21.1* 22.9* 12.9* 109.2* 345,557.1* 28.5* 20.5*
SCA x generation 15 14.6 13.3* 5.8 27.4* 21,789.3* 6.4* 18.5*
Error 80 4.7 1.4 3.4 0.9 254.3 0.5 0.7
Individual analysis of F2 generation
Treatment 20 46.6* 28.9* 25.6* 89.4* 12,623.1* 6.4* 35.2*
GCA 5 88.0* 5.5 78.3* 280.4* 39,202.9* 11.3* 82.5*
SCA 15 32.9* 36.6* 8.0 25.7 3,763.6* 4.7* 19.4
Error 40 6.7 3.9 2.8 1.3 243.5 0.4 0.5
Individual analysis of F3 generation
Treatment 20 68.5* 27.1* 12.4* 41.2* 56,741.5* 20.1* 14.9*
GCA 5 159.6* 47.9* 33.8* 63.5* 86,272.0* 51.4* 28.9*
SCA 15 38.1* 20.21* 5.3* 33.8* 46,897.6* 9.6* 10.3*
Error 40 2.8 1.2 4.0 0.69 265.2 0.6 1.0
GCA and SCA parameters, however, differences between ! xed and segregating populations were only observed for the traits vegetative cycle, total cycle, and weight of one thousand grains in GCA and for vegetative cycle and reproductive cycle in SCA. Also there were signi! cant interactions detected between the parameters treatment x generation, GCA x generation, and between SCA x generation for all traits, indicating the need for decomposing the interaction effects and analyzing its simple effects, e.g., the individual analysis of GCA and SCA for each generation studied in the present work. Therefore, in the individual analysis of both generations (F2 and F3), the only traits that showed no
signi! cant differences were reproductive cycle in GCA and total cycle and plant stature in SCA in the F2.
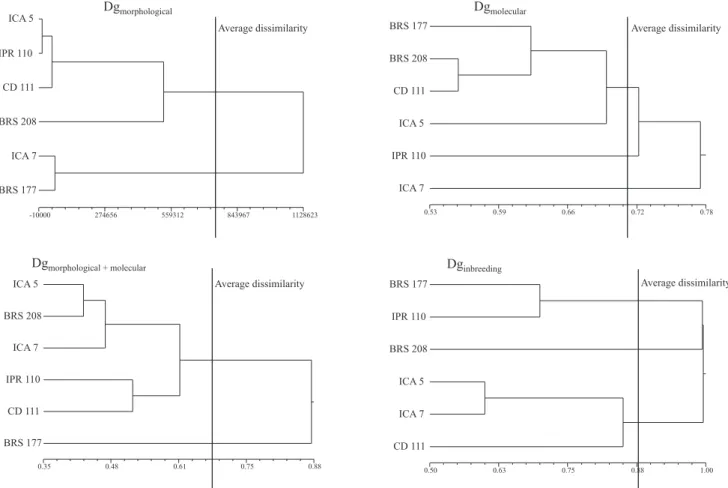
The estimate of genetic distance (Figure 1) detected
variability among the six parental genotypes used
in the crosses for morphological, AFLP, combined (morphological and AFLP) markers, and pedigree (Figure 1). For the morphological distance, with a cutoff point equal to the average dissimilarity between all genotype pairs, it was possible to separate the genotypes into two main clusters (Figure 1, Dgmorphological).
The genotypes ICA 7 and BRS 177 formed a cluster very distant from the remaining ones. Considering the genetic distance estimated by AFLP markers (Figure 1, Dgmolecular), three clusters were formed and, in contrast
to the observed with morphological data, the genotypes that most differed from the remaining genotypes were ICA 5 and IPR 110. Only a small correlation was detected between these two distance estimates (Table 3), showing that they probably assessed different portions of the genome.
Figure 1. Dendrograms resulting from the clustering analyses of six wheat genotypes, obtained by the UPGMA method using measures of genetic distances: Dgmorphological, distance of Mahalanobis based on 17 morphological traits; Dgmolecular, AFLP complement of similarity index of Dice (1945), estimated using 206 polymorphic bands; Dgmorphological + molecular), based on the complement of the genetic similarity index of Gower (1971); and Dginbreeding, using the equation of Malécot (Ferreira & Zambalde, 1997). The cophenetic correlation coef! cients were 0.70, 0.76, 0.75, and 0.90 for the four dendrograms, respectively.
-10000 274656 559312 843967 1128623 BRS 177
ICA 5
IPR 110
CD 111
BRS 208
ICA 7
BRS 177
Dgmorphological
0.53 0.59 0.66 0.72 0.78
BRS 177
BRS 177
BRS 208
CD 111
ICA 5
IPR 110
ICA 7
Dgmolecular
0.35 0.48 0.61 0.75 0.88
BRS 177
ICA 5
BRS 208
ICA 7
IPR 110
CD 111
BRS 177
Dgmorphological + molecular
0.50 0.63 0.75 0.88 1.00
BRS 177
BRS 177
IPR 110
BRS 208
ICA 5
ICA 7
CD 111
Dginbreeding
Average dissimilarity Average dissimilarity
The dendrograms presented in Figure 1 show a good ! t between the graphical representation of distances and their original matrices, where medium to high cophenetic correlation coef! cients were obtained (0.70, 0.76, 0.75, and 0.90 for morphological, molecular, combined morphological plus molecular, and pedigree data, respectively). In general, cophenetic correlation coef! cients above 0.70 are considered ef! cient for the graphical representation of contrasts between genotypes (Vieira et al., 2007).
Six AFLP primer combinations were used, and a total
of 162 bands were obtained, among which 142(87.65%)
were polymorphic. A study based on 200 polymorphic bands obtained from ! ve AFLP primer combinations was reported (Corbellini et al., 2002). However, polymorphism levels as low as 47% have also been detected in wheat (Roy et al., 2004). These reports con! rm that AFLP markers can be ef! ciently used to detect genetic variability in wheat.
The estimate of genetic distance based on combining morphological and molecular data (Figure 1, Dgmorphological + molecular) showed two major
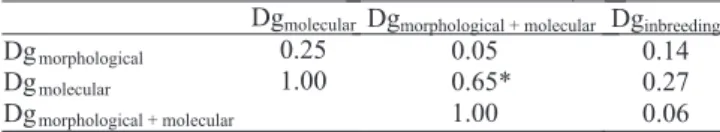
clusters. Considering the dendrogram, only BRS 177 showed divergence from the remaining genotypes. However, due to the fact that distance estimates from morphological and molecular markers were not consistent with the combined data results, it is clear that these analyses probably assessed distinct genome regions or features. This lack of agreement is explained by the low correlation value (r = 0.25) found between the individual genetic distance matrices from morphological and molecular markers (Table 4). Also, the higher number of molecular data points (142 polymorphic bands) in comparison to morphological traits (17) generated a biased combined analysis toward the result of the molecular data. This bias can be observed from the correlation between combined and molecular distances (0.65), compared to combined and morphological distances (0.05). Other studies have reported that such techniques employed individually produce results distinct from the combined analyses (Franco et al., 2001). This can be explained by the different properties of each analysis and the way each one assessed genome variability.
The dendrogram resulting from the genetic distance using the inbreeding coef! cient divided the genotypes in three clusters. The novelty here is that genotype BRS 208 had little relationship with the remaining genotypes (Figure 1, Dginbreeding). Likewise, the two
remaining clusters (BRS 177 and IPR 110 and ICA 5, ICA 7, and CD 111) also showed no relationship with each other and with BRS 208.
The correlation values between the matrix originated from the pedigree data with the other matrices were reduced and nonsigni! cant: r = 0.14, 0.27, and 0.06 with morphological, molecular, and combined (morphological plus molecular) matrices, respectively (Table 3). The reduced correlation coef! cients observed were similar to those found by Bered et al. (2001), who evaluated morphological and RAPD markers.
The distance between parents assessed with morphological traits had signi! cant but moderate correlation with SCA in the F1 generation, for three
traits considered as grain yield components: grain weight of the main ear (r = -0.30), number of grains per ear (r = -0.43), and number of fertile tillers (r = 0.35) (Table 5). Likewise, signi! cant values were found for traits related to grain yield, in the F2 generation planted
in full-row, indicating that, in both situations, higher genetic distance based on morphological markers can lead to a better hybrid performance. Other studies in wheat also show similar results regarding this group of traits (Joshi et al., 2004). This can be explained by a large number of genes controlling the trait (quantitative), which generates a high probability of distinct alleles being distributed between the parents and results in high hybrid vigor when combined in the progeny (Falconer & Mackay, 1996).
The use of AFLP data to predict the hybrid heterosis in F1 showed a positive association between heterosis and
parental distance only for number of grains per ear (0.35) and weight of a thousand grains (0.35). The same can
be observed for the F2 generation, where only the traits
grain weight of the main ear (-0.41) in spaced plants, and reproductive cycle (0.32) and total cycle (0.47) in full-row showed signi! cative correlations. In F3, the traits
Dgmolecular Dgmorphological + molecular Dginbreeding
Dgmorphological 0.25 0.05 0.14
Dgmolecular 1.00 0.65* 0.27
Dgmorphological + molecular 1.00 0.06
Table 4. Correlations between genetic distance estimates assessed with morphological (Dgmorphological), molecular (Dgmolecular), combined morphological and molecular (Dgmorphological + molecular) and with the inbreeding coef! cient (Dginbreeding) among six parental genotypes of a wheat diallel cross.
grain yield per hectare (0.30) and weight of a thousand grains (0.39) also showed signi! cant association between the parental genetic distance and the SCA.
The correlation between SCA and the genetic distance obtained from combined morphological and molecular data showed no expressive values, and no
signi! cant association was found in the F1 generation.
In F2 generation, signi! cance was found for the traits
grain weight of the main ear (0.40) in spaced plants, and total cycle (-0.41) and hectoliter weight (0.37) in full-row plantings. In the F3, signi! cance was found
for the character grain yield per hectare (-0.31), when plants were planted in full-row plantings. These results indicate that the distance based on combined markers (morphological plus molecular) does not seem to improve the predictions based on the techniques used
individually, suggesting that its use does not improve the ability of predicting high heterosis hybrids.
The distance estimated by the inbreeding coef! cient indicated an association with SCA for cycle related traits, especially when the estimates were made in
plants grown in a competitive environment. Both in F2
and F3, the vegetative cycle (F2 = -0.49 and F3 = 0.47)
and the reproductive cycle (F2 = -0.33 and F3 = 0.37)
presented signi! cant associations with the degree of inbreeding between parents. However, for the grain yield related traits, only the weight of grains of the main ear (-0.39) and the number of grains per ear (-0.32) in F1 and the weight of a thousand grains in F2 (-0.36) in
full-row had correlations with the distance between the parents.
The lack of association between the pedigree based distance and the SCA, observed in this study for many
Table 5. Correlation coef! cients between the genetic distances assessed by morphological (Dgmorphological), molecular (Dgmolecular), combined morphological and molecular (Dgmorphological + molecular), and with the inbreeding coef! cient (Dginbreeding) with the speci! c combining ability of six parental wheat (Triticum aestivum) genotypes evaluated in different generations and planting designs. Seven agronomically important traits were evaluated in a diallel crossing design.
*Signi! cant correlation at 5% probability by the test of Mantel with 1,000 permutations.
Distance measures Trait
Dgmorphological Dgmolecular Dgmorphological + molecular Dginbreeding
F1generation conducted as spaced plant
Vegetative cycle 0.10 0.19 -0.27 -0.16
Plant stature -0.02 0.17 -0.28 -0.12
Grain yield per plant 0.19 0.08 -0.29 -0.17
Weight of grains of the main ear -0.30* 0.18 0.06 -0.39*
Number of grains per ear -0.43* 0.35* 0.04 -0.32*
Weight of a thousand grains 0.19 0.35* -0.01 0.07
Number of fertile tillers per plant 0.35* -0.15 0.03 -0.05
F2generation conducted as spaced plant
Vegetative cycle 0.30* -0.09 -0.17 -0.11
Plant stature -0.06 -0.20 0.12 -0.16
Grain yield per plant 0.07 -0.19 0.19 0.18
Weight of grains of the main ear 0.16 -0.41* 0.40* 0.05
Number of grains per ear -0.06 -0.26 0.29 0.01
Weight of a thousand grains 0.21 0.24 0.23 0.09
Number of fertile tillers per plant -0.02 0.01 -0.02 0.19
F2generation conducted as full-row
Vegetative cycle -0.01 -0.13 0.05 -0.49*
Reproductive cycle -0.25 0.32* 0.04 0.47*
Total cycle -0.53* 0.47* -0.41* 0.14
Plant stature 0.09 0.12 -0.10 -0.17
Grain yield ha-1 0.41* 0.16 -0.18 -0.21
Hectoliter weight 0.43* -0.27 0.37* -0.19
Weight of a thousand grains 0.46* -0.15 0.29 -0.36*
F3generation conducted as full-row
Vegetative cycle -0.17 0.12 0.06 -0.33*
Reproductive cycle 0.17 -0.07 -0.23 0.37*
Total cycle -0.12 0.14 0.21 -0.18
Plant stature -0.01 0.25 -0.11 -0.12
Grain yield ha-1 0.22 0.30* -0.31* 0.19
Hectoliter weight -0.01 0.14 -0.04 0.25
traits, was also reported by Almanza-Pinzón et al. (2003). This lack of association can be a consequence of two major ! aws in the inbreeding coef" cient estimates. First, precise pedigree information can be lacking for some of the genotypes used in the crosses. Second, the lack of pedigree relatedness between two genotypes does not imply that the genotypes will have distinct alleles, and that, when they are to be combined, this can result in a higher combining ability.
The correlation coef" cients, in its majority, were between 30 and 53% (r between 0.30 and 0.53), considered of medium order (Carvalho et al., 2004). To have reliability, a distance estimate has to have a higher precision, i.e., associations above 60%. Only improved wheat lines subjected to a strong selective pressure towards adaptation to southern Brazil were used in this study. This choice of gemplasm could have caused a conversion towards a similar gene pool. Thus, despite the morphological distance detected between genotypes, it is possible that at the molecular and pedigree levels, the differences have not been properly assessed, requiring a sampling that includes genotypes with larger phenotypic differences. This hypothesis was considered in rice, for which signi" cant differences were found only between molecular (RFLP) distances and the performance of grain yield, while hybrids were established with parents of high genetic divergence, i.e., indica x japonica crosses (Zhang et al., 1994).
Conclusions
1. The measures of genetic distance assessed by morphological, molecular, combined morphological plus molecular, and pedigree methods showed low to moderate association with speci" c combining ability, and the magnitude is character, generation, and planting design dependent.
2. In order to obtain a more precise genetic distance estimate between cultivars and its association with hybrid performance, more than one technique, generation, and planting design should be combined.
Acknowledgements
To Fundação de Apoio à Pesquisa do Estado do Rio Grande do Sul, Conselho Nacional de Desenvolvimento Cientí" co e Tecnológico, and Coordenação de Aperfeiçoamento de Pessoal de Nível Superior, for grants and graduate and research productivity fellowships.
References
ALMANZA-PINZÓN, M.I.; KHAIRALLAH, M.; FOX, P.N.; WARBURTON, M.L. Comparison of molecular markers and coef" cients of parentage for the analysis of genetic diversity among
spring bread wheat accessions. Euphytica, v.130, p.77-86, 2003.
AUTRIQUE, E.; NACHIT, M.M.; MONNEVEUX, P. Genetic diversity in durum wheat based on RFLPs, morphophysiological
traits and coef" cient of parentage. Crop Science, v.36, p.735-742,
1996.
BERED, F.; CARVALHO, F.I.F.; BARBOSA NETO, J.F.; ROCHA, B.M. Genetic variability in common wheat based on morphological
traits, coef" cients of parentage and RAPDs. Journal of New Seeds,
v.3, p.73-87, 2001.
BERTAN, I.; CARVALHO, F.I.F.; OLIVEIRA, A.C. de. Parental
selection strategies in plant breeding programs. Journal ofCrop
Science andBiotechnology, v.10, p.211-222, 2007.
CARVALHO, F.I.F.; LORENCETTI, C.; BENIN, G. Estimativas
e implicações da correlação no melhoramento vegetal.Pelotas: UFPel, 2004. 142p.
CORBELLINI, M.; PERENZIN, M.; ACCERBI, M.; VACCINO, P.; BORGHI B. Genetic diversity in bread wheat, as revealed by coef" cient of parentage and molecular markers, and its relationship
to hybrid performance. Euphytica, v.123, p.273-285, 2002.
CRESTE, S.; TULMANN-NETO, A.; FIGUEIRA, A. Detection of single sequence repeat polymorphisms in denaturing polyacrylamide
sequencing gels by silver staining. Plant Molecular Biology
Reporter, v.19, p.299-306, 2001.
CRUZ, C.D. Programa genes: aplicativo computacional em
genética e estatística. Viçosa: UFV, 2001. 648p.
CRUZ, P.J.; CARVALHO, F.I.F.; OLIVEIRA, A.C.; BENIN, G.; VIEIRA, E.A.; SILVA, J.A.G.; VALÉRIO, I.P.; HARTWIG, I.; BUSATO, S.C. Genetic dissimilarity among wheat genotypes
for lodging associated traits. Crop Breeding and Applied
Biotechnology, v.4, p.427-433, 2004.
DICE, L.R. Measures of the amount of ecologic association
between species. Ecology, n.26, p.297-302, 1945.
FALCONER, D.S.; MACKAY, T.F.C. Introduction to quantitative
genetics. 4th ed. Edinburgh: Longman, 1996. 462p.
FERREIRA, D.F.; ZAMBALDE, A.L. Simpli" cação das análises de algumas técnicas especiais da experimentação agropecuária no Mapgen e softwares correlatos. In: CONGRESSO DA SBI-AGRO WORKSHOP SUPLY CHAIN MANAGEMENT
IN AGRIBUSINESS, 1., 1997, Belo Horizonte. Anais. Belo
Horizonte: Agrosaft/ CTSOFT/ SBI-AGRO, 1997. p.215-291.
FRANCO, J.; CROSSA, J.; RIBAUT, J.M.; BETRAN, J.; WARBURTON, M.L.; KHAIRALLAH, M. A method for combining molecular markers and phenotypic attributes for classifying plant
genotypes. Theoretical and Applied Genetics, v.103, p.944-952,
2001.
GOWER, J.C. A general coef" cient of similarity and some of its
properties. Biometrics, v.27, p.857-874, 1971.
GRIFFING, B. Concept of general and speci" c combining ability
in relation to diallel crossing systems. Australian Journal of
JOSHI, S.K.; SHARMA, S.N.; SINGHANIA, D.L.; SAIN, R.S.
Combining ability in the F1 and F2 generations of diallel cross in
hexaploid wheat (Triticum aestivum L. em. Thell). Hereditas,
v.141, p.115-121, 2004.
MANTEL, N. The detection of disease clustering and a generalized
regression approach. Cancer Research, v.27, p.209-220, 1967.
MÁRIC, S.; BOLARÍC, S.; MARTINCIC, J.; PEJÍC, I.; KOZUMPLINK, V. Genetic diversity of hexaploid wheat cultivars
estimated by RAPD markers, morphological traits and coef! cients of parentage. Plant Breeding, v.123, p.366-369, 2004.
PILLAR, V.P. Multivariate exploratory analysis and randomization testing using Multiv. Colnoses, v.12, p.145-148, 1997.
REIS, W.P.; VELLO, N.A.; FERREIRA, D.F.; RAMALHO, M.A.P. Associação entre coe! ciente de parentesco e técnicas multivariadas como medidas de divergência genética de cultivares de trigo.
Ciência e Agrotecnologia, v.23, p.258-269, 1999.
ROHLF, F.J. NTSYS-pc: numerical taxonomy and multivariate analysis system. Version 2.1. New York: Exeter Software, 2000. 83p. ROY, J.K.; LAKSHMIKUMARAN, M.S.; BALYAN, H.S.; GUPTA, P.K. AFLP-based genetic diversity and its comparison with diversity based on SSR, SAMPL, and phenotypic traits in bread wheat. Biochemical Genetics, v.42, p.43-59, 2004.
SAS INSTITUTE. Getting started with the SAS learning edition. Cary: SAS Institute, 2002.
SCHEEREN, P.L. Instruções para utilização de descritores de trigo (Triticum aestivum) e triticale (Triticosecale sp.).Passo Fundo: Embrapa-CNPT, 1984. 32p. (Embrapa-CNPT. Documentos, 9). SOKAL, R.R.; ROHLF, F.J. The comparison of dendrograms by objective methods. Taxon, v.11, p.30-40, 1962.
VIEIRA, E.A.; CARVALHO, F.I.F. de; BERTAN, I.; KOOP, M.M.; ZIMMER, P.D.; BENIN, G.; SILVA, J.A.G. da; HARTWIG, I.; MALONE, G.; OLIVEIRA, A.C. de. Association between genetic distances in wheat (Triticum aestivum L.) as estimated by AFLP and morphological markers. Genetics and Molecular Biology, v.30, p.392-399, 2007.
VOS, P.; HOGERS, R.; BLEEKER, M.; REIJANS, M.; LEE, T. van de; HORNES, M.; FRITERS, A.; POT, J.; PALEMAN, J.; KUIPER, M.; ZABEAU, M. AFLP: a new technique for DNA ! ngerprinting. Nucleic Acids Research, v.23, p.4407-4414, 1995.
ZEVEN, A.C.; REINER, L. Genealogies of 3200 wheat varieties. Wageningen: Technical University Munich, 1991. 79p.
ZEVEN, A.C.; ZEVEN-HISSINK, N.C. Genealogies of 14000 wheat varieties. Wageningen: International Maize and Wheat Improvement Center, 1976. 121p.
ZHANG, Q.; GAO , Y.J.; YANG, S.H.; RAGAB R.A.; MAROOF, M.A.S.; LI Z.B. A diallel analysis of heterosis in elite hybrid rice-based on RFLPs and microsatellites. Theoretical and Applied G
v.89, p.185-192, 1994.