Agro-morphological characterization and
genetic divergence assessment in bush snap bean genotypes
1Daniela da Costa Vaz2, Odilon Peixoto de Morais Júnior3, Nei Peixoto4
INTRODUCTION
Snap bean (Phaseolus vulgaris L.) is an
important horticultural crop throughout the world. It is consumed in the form of immature seeds and pods and is a source of essential vitamins (A, B12
ABSTRACT
RESUMO
and C), minerals and dietary fiber, which make
it an excellent component of the human nutrition (Filgueira 2013).
The primary center of origin and diversity for snap beans is believed to be the Americas, where various studies have suggested that most groups are
1. Manuscript received in Oct./2016 and accepted for publication in May/2017 (http://dx.doi.org/10.1590/1983-40632016v4743525). 2. Universidade do Estado de Mato Grosso, Departamento de Agronomia, Nova Mutum, MT, Brazil.
E-mail: [email protected].
3. Universidade Federal de Goiás, Escola de Agronomia, Departamento de Melhoramento de Plantas, Goiânia, GO, Brazil.
E-mail: [email protected].
The characterization and identification of genetically divergent parents for crosses are important tasks in snap bean
breeding programs, for a greater availability of cultivars to growers. This study aimed at characterizing bush snap bean
genotypes originating from different countries; assessing the
genetic divergence between the genotypes and the genetic
variability extent, concerning 12 agro-morphological traits;
and determining the relative importance of these traits for the genetic divergence. The experiment was conducted in a
randomized complete block design, with 29 genotypes and four
replications. The UPGMA and Tocher optimization methods, both based on the generalized distance of Mahalanobis, and the canonical variables method were used to analyze the genetic divergence. The genotypes exhibited a wide range of genetic variability for the agro-morphological traits evaluated, mainly for 100-seed weight, aspect and yield of commercial pods, plant height at harvest and pod weight. A high genetic divergence was detected between the genotypes, in which the 100-seed weight and aspect of commercial pods were the most important traits for clustering. Some genotypes own desirable characteristics for these and other traits, given the favorable genetic associations between traits. The snap bean
genotypes originated from different countries tended to cluster
together, indicating that similar germplasm is shared among
different countries, thus suggesting a strong trans-national
seed exchange.
KEYWORDS: Phaseolus vulgaris; yield and aspect of
commercial pods; genetic variability.
Caracterização agromorfológica e avaliação de divergência genética em genótipos de feijão-vagem arbustivo
A caracterização e a identificação de genitores geneticamente
divergentes para cruzamentos são tarefas importantes em programas de melhoramento de feijão-vagem, para maior disponibilidade de cultivares aos produtores. Objetivou-se caracterizar genótipos de
feijão-vagem arbustivo de diferentes países de origem; avaliar a
divergência genética entre os genótipos e a extensão da variabilidade
genética, em relação a 12 caracteres agro-morfológicos; e determinar
a importância relativa desses caracteres para a divergência genética. O experimento foi conduzido em delineamento de blocos completos ao acaso, com 29 genótipos e quatro repetições. Para a análise de diversidade genética, foram empregados os métodos de otimização de Tocher e UPGMA, com base em distância generalizada de Mahalanobis, e o método de variáveis canônicas. Os genótipos apresentaram ampla variabilidade genética para os caracteres avaliados, principalmente para peso de 100 sementes, aspecto e rendimento de vagens comerciáveis, altura da planta na colheita e peso das vagens. Alta divergência genética foi detectada entre os genótipos, nos quais o peso de 100 sementes e o aspecto de vagens comerciáveis foram os caracteres mais importantes para o agrupamento. Alguns genótipos possuem características desejáveis para estes e outros caracteres, tendo-se em conta as associações genéticas favoráveis entre os mesmos. Os genótipos de feijão-vagem de diferentes países de origem tenderam a se agrupar, indicando que germoplasma semelhante é compartilhado entre diferentes países, sugerindo, assim, uma forte troca transnacional de sementes. PALAVRAS-CHAVE: Phaseolus vulgaris; produtividade e
derived from the Andean common bean genepool (Gepts et al. 1986). However, snap beans are widely distributed and very diverse around the world, especially in Europe and Asia (Blair et al. 2010).
While dry bean market classes are based on
seed characteristics and horticultural traits, snap
bean market classes are based on pod characteristics
and plant type (Myers & Baggett 1999). Snap beans comprise a group of common beans selected for
succulent pods, with reduced fiber content (< 20 %),
and have a great economic and social importance
in Brazil, being marketed throughout the year and
produced almost exclusively in small family farms (Peixoto & Cardoso 2016).
The selection pressure for snap bean pod characteristics has been intense, generating large
phenotypic differences in snap bean types. Snap
beans are also very diverse in growth habit and plant ideotype, ranging from type I (determinate) erect bush beans to type IV (indeterminate) climbing beans (Myers & Baggett 1999). The majority of tropical cultivars are indeterminate climbing snap beans, while determinate erect bush beans prevail in temperate zones (Blair et al. 2010). In Brazil, for example, the main recommended snap bean cultivars are indeterminate-type crops, grown on trellises. However, cultivars with determined or bush growth
not only dispense staking, but also grow earlier,
so that the harvest can be concentrated in a short period of time. There are cultivars that allow a single harvest, lowering the exposure to biotic factors and allowing a mechanized production. Mechanization results in more rational land and labor use, thus reducing production costs and increasing the farmer income (Filgueira 2013, Peixoto & Cardoso 2016).
For a greater availability and release of new bush snap bean cultivars that meet the demands of
growers and consumers, efficient actions in breeding
programs are necessary, including the introduction and evaluation of new germplasms, crosses among the best available parents, accurate selection of
plants and progenies and, finally, the release of the superior lines as cultivars. The first steps in a snap
bean breeding program are the characterization and genetic divergence assessment of candidate parents.
This procedure allows an efficient management of the breeding germplasm and the definition of best
crosses. Crosses between genetically divergent and complementary parents for multiple traits are an important strategy to achieve higher selection gains,
given the larger genetic variability released by these crosses (Krause et al. 2009, Araújo et al. 2012).
When the phenotypic data of the parents is available, without any crosses information, the application of multivariate analysis techniques based on some measures of dissimilarity is recommended (Johnson & Wichern 1992, Cruz et al. 2012). This procedure allows the evaluation of the genetic divergence among various genotypes, across several agro-morphological traits. There are several useful multivariate analysis techniques for predicting genetic divergence, such as clustering methods, either optimization or hierarchical, and canonical variable analysis. There are also some dissimilarity measurements, such as the average Euclidean distance and the Mahalanobis distance (Johnson & Wichern 1992). These techniques allow the allocation of genotypes in groups, so that there is a maximum homogeneity within groups and maximum heterogeneity among groups. Therefore,
this procedure allows the identification of divergent
genotypes, i.e., those with contrasting allele
frequency for different traits. Divergent genotypes
can be recombined via crosses, thus increasing
the likelihood of recovering superior genotypes in
segregating populations (Maluf & Ferreira 1983, Cruz et al. 2012).
To subsidize snap bean breeding programs, given the importance of this crop in Brazil, this study aimed at characterizing 29 bush snap bean genotypes from different countries of origin, assessing the genetic divergence among the genotypes evaluated and the extent of phenotypic and genetic variability regarding 12 agro-morphological traits, as well as determining and discriminating the relative importance of these traits for genetic divergence.
MATERIAL AND METHODS
The experiment was conducted in the field, at
the Universidade Estadual de Goiás, in Ipameri, Goiás State, Brazil (17º41’S, 48º11’W and 800 m of altitude),
in 2013. According to the Köppen classification, the
climate is Aw, with an average temperature of 21.9 ºC,
average relative humidity of 58-81 % and annual rainfall of 1,447 mm. Approximately 80 % of the
information on average temperatures and monthly water balance are described by Morais Júnior et
al. (2012). The soil is classified as a clayey texture
Oxisol (“Latossolo Amarelo”) (Embrapa 2013).
A randomized complete block design with
29 treatments and four replications was used. The treatments consisted of bush snap bean genotypes from different countries of origin and different
qualitative morphological traits, regarding flower
color, pod color and pod type (Table 1). The experimental plot had four 2.40 m rows, with plants arranged in a 0.40 m x 0.15 m spacing. Green pod data were obtained from the two side rows and seed data from the two central rows.
Sowing took place on May 24 (2013), after
the soil had been corrected with dolomitic limestone, considering the acidity, calcium and magnesium levels in the chemical analysis. The soil was fertilized with 1.0 t ha-1 of NPK (5-25-15) at planting and, for
cover, 200 kg ha-1 of urea were applied at 20 days
after sowing (Sousa & Lobato 2004). The water needs of the crop were met through a drip irrigation system and weeds were controlled manually. Due to the high incidence of Diabrotica speciosa (Germar), pyrethroid was sprayed at about 200 ml ha-1.
Twelve agro-morphological quantitative traits were assessed, which are related to the agronomic performance of the crop, yield components, pod morphology and quality (Table 2). Data related to the commercial pod yield, characterized by the typical shape and color of each genotype at the point of harvest, were obtained in two harvests, with an interval
of one week. More details on the measurements of
each trait are presented by Peixoto et al. (2002). Analysis of variance (Anova) was performed
to obtain adjusted means, Fisher least significant differences between means, quadratic and variance
components. The following tests were performed
(1) CIAT: International Center for Tropical Agriculture, Colombia.
Code Genotype Flower color Pod color Pod type Origin(1)
1 Amarelo Japonês White Green Cylindrical Japan
2 Blue Lake 274 White Green Cylindrical USA
3 Branco Japonês White Green Cylindrical Japan
4 Cherokee Wax Purple Yellow Flat USA
5 Commodore Improved White Green Cylindrical USA
6 Contender Purple Green Cylindrical USA
7 Delinel White Green Cylindrical USA
8 Derby White Green Cylindrical USA
9 Espada White Green Cylindrical USA
10 Festina White Green Cylindrical USA
11 Gold Rush White Yellow Cylindrical USA
12 Improved Gold Wash Yellow Yellow Cylindrical USA
13 Jade White Green Cylindrical USA
14 Kentucky Wonder Bush White Green Cylindrical USA
15 Line Hab 1 White Green Cylindrical CIAT
16 Line Hab 39 White Green Cylindrical CIAT
17 Line Hab 46 White Green Cylindrical CIAT
18 Maxibel White Green Cylindrical USA
19 Provider White Green Cylindrical USA
20 Purple Queen Purple Purple Cylindrical USA
21 Rocdor Yellow Yellow Flat USA
22 Royal Burgundy Purple Purple Flat USA
23 Slenderwash White Yellow Cylindrical USA
24 Strike White Green Cylindrical USA
25 Stringless Green White Green Flat USA
26 Tenderette White Green Flat USA
27 Tendergreen Purple Green Cylindrical USA
28 Tendergreen Improved White Green Cylindrical USA
29 Turmalina White Green Flat Brazil
Table 1. Code, origin and main qualitative morphological traits (flower color, pod color and pod type) of the 29 bush snap bean
to evaluate the Anova assumptions: Shapiro-Wilk’s test to check the normal distribution of the residuals; Levene’s test for homogeneity of variances; Tukey’s test for nonadditivity; and graphical analysis for
independence of the residuals. Anova was performed
by fitting a fixed linear model, according to the
experimental design. The following parameters were
estimated for each trait: error variance between plots; quadratic component of treatment; coefficient of genetic determination; selective accuracy (Resende & Duarte 2007); experimental, genotypic and relative coefficient of variation (Vencovsky & Barriga 1992).
To assess the associations between traits,
genetic and phenotypic correlation coefficients were
calculated between all pairs of traits (Steel & Torrie 1980). The genetic and phenotypic (co)variance matrices between the traits were calculated after estimating the sum of squares and products matrices for treatment (H) and the error (E), and their respective degrees of freedom, using multivariate analysis of variance (Manova).
The relative contribution of each trait to the genetic diversity was determined by the Singh’s method (Singh 1981). To assess the genetic divergence between genotypes, based on traits, multivariate analysis was performed using the following clustering
techniques: UPGMA (Sneath & Sokal 1973) and
Tocher optimization (Rao 1952). Both methods
were based on generalized Mahalanobis distance D2
(Mahalanobis 1936), used as a dissimilarity measure, and the technique of canonical variables.
The magnitude of the adjustment between the distance matrix and cluster analysis (UPGMA and
Tocher) was estimated by cophenetic correlation
(Sokal & Rohlf 1962). The Mantel’s randomization
test (Mantel 1967) was applied, based on 10,000 permutations of rows and columns of the cophenetic matrix of each clustering method, to test the hypothesis of a null correlation between the cophenetic matrix and the original distance matrix. The Pearson’s
correlation coefficient between the adjusted means
of the genotypes, for each trait, and the scores of the main canonical variables that explain at least
80 % of the total variation were also estimated. The Student t-test was used to measure the significance of the Pearson’s correlation coefficient. All operations
and statistical analyses were performed using the R platform (R Core Team 2016). The following
packages were used: “manova”, “stats”, “biotools”,
“Morpho”, “ggdendro” and “scatterplot3d”.
RESULTS AND DISCUSSION
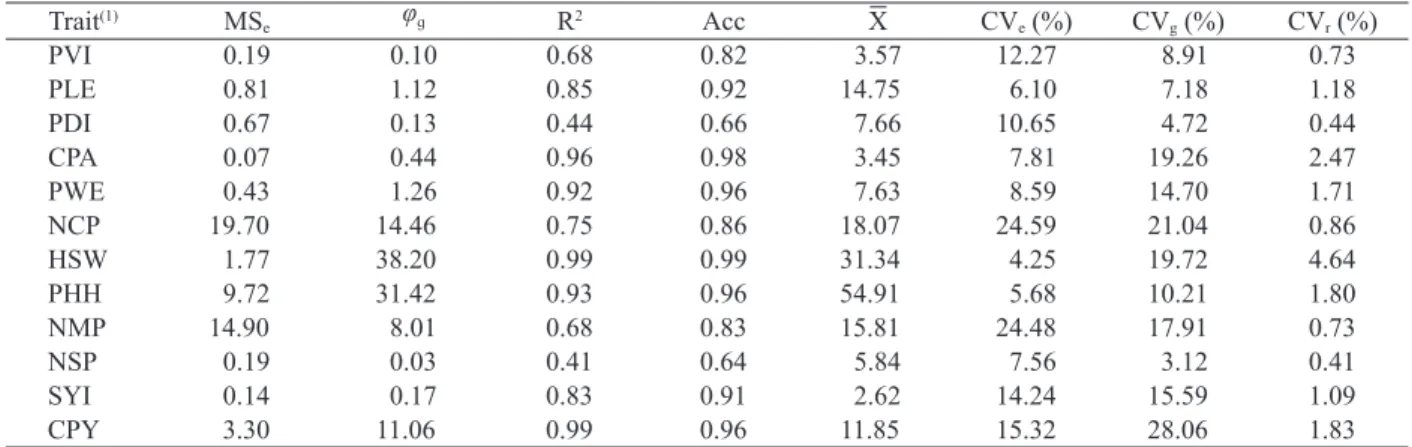
The averages, residual and genetic parameters for each agro-morphological trait are shown in Table 3. Based on the estimates of selective accuracy (Acc), moderate to high experimental precision was detected for the traits. This statistics is suitable as a measure of precision in the selections (Resende & Duarte 2007). According to Steel & Torrie (1980),
the ideal selective accuracy must be ≥ 90 %, which
corresponds to the values detected for most traits assessed in this study.
Genetic variability is a prerequisite for
the efficient identification of superior genotypes.
Therefore, it is essential to partition the phenotypic
Table 2. Twelve agro-morphological quantitative traits assessed in bush snap bean genotypes, their code and measurement method.
Code Trait Measurement method
PVI Plant vigor (score) Visual assessment at flowering, by rating scale (1-5 scale, with regular intervals of 0.5, where 1 is the worst and 5 the best) PLE Pod length (cm) Average longitudinal length of 10 pods, using a graduated ruler PDI Pod diameter (cm) Average cross section of 10 pods, using a digital caliper CPA Commercial pods aspect (score) Visual assessment at harvest, by rating scale (1-5 scale,
with regular intervals of 0.5, where 1 is the worst and 5 the best)
PWE Pod weight (kg) Average weight of all pods per plot, using a scale
NCP Number of commercial pods per plant (unit) Average number of all commercial pods in all plants HSW 100-seed weight (g) Average weight of 100 harvested seeds
PHH Plant heightat harvest (cm) Average distance from the base to the end of the main stem at harvest NMP Number of mature pods per plant (unit) Average number of all mature pods in all plants of the plot area NSP Number of seeds per pod (unit) Average number of seeds formed in 10 pods
SYI Seed yield (t ha-1) Ratio between the average weight of all seeds and the plot area
variability into its genetic and non-genetic
components (Vencovsky & Barriga 1992). A high coefficient of genetic determination (R2) was detected
for most traits, especially for 100-seed weight, commercial pod yield and commercial pod aspect, which presented values greater than 0.95 (Table 3).
Regarding the relative coefficient of variation (CVr),
most traits presented values higher than the unit (1), especially for 100-seed weight, commercial pod aspect, commercial pod yield, plant height at harvest and pod weight, with values greater than 1.5. Therefore, these results suggest a favorable condition to identify superior genotypes, with respect to these traits, either for direct use in commercial production or as new parents in breeding programs.
The adjusted means of the genotypes and the Fisher least significant difference statistics, for each agro-morphological trait, are shown in
Table 4. Significant differences (p ≤ 0.05) were
detected between the genotypes for all traits assessed. The Delinel and Maxibel cultivars showed the best
commercial pod aspect, while the Blue Lake 274,
Purple Queen and Tendergreen Improved cultivars showed the worst scores for this trait. Although the commercial pod aspect is an important trait in snap beans, the number of commercial pods per plant is
a trait more directly associated with the effective
pod yield, i.e., the commercial pod yield, because of their high genetic correlation (Table 7). Regarding the genotypes with higher commercial pod yield, the Contender, Jade and Provider cultivars were the most
productive (approximately 18 t ha-1) and statistically
different (p ≤ 0.05) from the others. Therefore, among
the genotypes assessed, these cultivars are the most promising for commercial production in the Ipameri region, because of their acceptable values for other traits, such as medium to high plant vigor (Table 4). However, for the safe recommendation of these cultivars, on a commercial scale, further studies should be carried out to evaluate the yield adaptability and stability over the years and other environments.
The Contender cultivar presented the highest adjusted average for 100-seed weight and pod
weight, statistically different (p ≤ 0.05) from the
others (Table 4). In addition, this cultivar is among those with larger pod length and diameter and lower number of seeds per plant. Although this cultivar has larger seeds, the pods present good commercial pod aspect, conferred by its bigger, cylindrical pods (Table 1). This is an interesting characteristic, since large seeds are usually an undesirable feature in snap bean cultivars, because of the presence of protrusions on the pod surface, which confer a strange appearance (Peixoto et al. 2002). A potentially greater plant vigor is another characteristic of the Contender cultivar, since this trait is positively correlated with 100-seed weight (Table 5). Larger seeds have higher seed reserve content, an important feature in legumes (Henning et al. 2010). Genotypes with greater plant vigor are desirable, because of their
better initial agronomic performance in the field. Therefore, because of its high effective pod yield
(1) PVI: plant vigor; PLE: pod length (cm); PDI: pod diameter (cm); CPA: commercial pod aspect; PWE: pod weight (kg); NCP: number of commercial pods per plant;
HSW: 100-seed weight (g); PHH: plant height at harvest (cm); NMP: number of mature pods per plant; NSP: number of seeds per pod; SYI: seed yield (t ha-1);
CPY: commercial pod yield (kg ha-1). Trait(1) MS
e φց R2 Acc X CVe (%) CVg (%) CVr (%)
PVI 0.19 0.10 0.68 0.82 3.57 12.27 8.91 0.73
PLE 0.81 1.12 0.85 0.92 14.75 6.10 7.18 1.18
PDI 0.67 0.13 0.44 0.66 7.66 10.65 4.72 0.44
CPA 0.07 0.44 0.96 0.98 3.45 7.81 19.26 2.47
PWE 0.43 1.26 0.92 0.96 7.63 8.59 14.70 1.71
NCP 19.70 14.46 0.75 0.86 18.07 24.59 21.04 0.86
HSW 1.77 38.20 0.99 0.99 31.34 4.25 19.72 4.64
PHH 9.72 31.42 0.93 0.96 54.91 5.68 10.21 1.80
NMP 14.90 8.01 0.68 0.83 15.81 24.48 17.91 0.73
NSP 0.19 0.03 0.41 0.64 5.84 7.56 3.12 0.41
SYI 0.14 0.17 0.83 0.91 2.62 14.24 15.59 1.09
CPY 3.30 11.06 0.99 0.96 11.85 15.32 28.06 1.83
Table 3. Estimates of residual and genetic parameters for agro-morphological traits assessed in bush snap bean genotypes: residual mean square (MSe), genotype quadratic component (φց), coefficient of genetic determination (R2), selective accuracy
(Acc), general average (X), experimental coefficient of variation (CVe), genetic coefficient of variation (CVg) and relative
(1) PVI: plant vigor; PLE: pod length (cm); PDI: pod diameter (cm); CPA: commercial pod aspect; PWE: pod weight (kg); NCP: number of commercial pods per plant;
HSW: 100-seed weight (g); PHH: plant height at harvest (cm); NMP: number of mature pods per plant; NSP: number of seeds per pod; SYI: seed yield (t ha-1);
CPY: commercial pod yield (kg ha-1). LSD
(0.05): Fisher least significant difference at 5 %; SE: standard error; SD: standard deviation.
Genotype PVI(1) PLE PDI CPA PWE NCP HSW PHH NMP NSP SYI CPY
Amarelo Japonês 3.8 15 6.7 4.3 8.3 21 31 64 15 6.4 3.0 14
Blue Lake 274 3.3 14 7.8 2.3 6.9 15 35 48 12 5.3 2.0 8
Branco Japonês 3.9 15 7.6 3.8 8.1 17 30 57 13 5.7 2.6 12
Cherokee Wax 3.4 15 6.7 3.3 7.5 12 45 59 14 5.7 2.4 7
Commodore Improved 4.0 15 7.9 2.9 7.1 22 31 51 18 5.7 3.2 15
Contender 3.5 17 8.3 4.4 11.1 21 47 51 14 5.1 3.0 18
Delinel 3.6 17 8.3 4.8 6.9 21 23 58 17 5.7 2.6 15
Derby 3.5 15 8.2 2.8 8.5 11 30 65 20 5.9 3.1 6
Espada 3.8 14 7.3 2.5 6.5 22 26 49 17 5.7 2.2 11
Festina 3.4 14 7.4 3.3 6.6 16 31 48 19 6.0 3.0 12
Gold Rush 2.9 15 8.3 3.8 8.0 13 23 51 22 6.0 2.3 7
Improved Gold Wash 3.1 13 7.2 4.0 7.7 23 34 55 19 5.5 2.7 13
Jade 3.6 15 7.5 4.0 5.4 26 29 54 16 6.1 2.9 18
Kentucky Wonder Bush 3.6 14 7.4 3.8 8.2 13 29 66 18 5.9 2.4 9
Line Hab 1 3.5 16 8.3 3.9 9.4 15 35 63 15 6.3 2.5 10
Line Hab 39 3.4 14 7.6 3.4 7.0 17 35 55 13 5.8 2.8 13
Line Hab 46 3.9 14 8.3 2.8 8.4 16 35 59 10 6.1 2.7 11
Maxibel 3.5 18 7.4 4.8 6.3 21 21 61 16 5.8 1.9 12
Provider 3.4 14 7.5 3.9 9.3 20 21 54 15 6.0 1.5 18
Purple Queen 4.0 13 7.0 2.4 6.4 13 32 62 17 5.8 2.7 9
Rocdor 3.5 15 8.2 3.4 7.2 18 30 47 11 6.5 2.1 10
Royal Burgundy 4.3 14 7.2 3.9 7.8 14 33 57 12 5.7 2.1 10
Slenderwash 2.9 13 8.3 3.4 5.9 25 24 45 22 5.7 2.3 11
Strike 3.1 15 7.1 3.3 7.7 28 27 52 20 5.7 3.4 16
Stringless Green 4.6 14 8.3 3.4 8.4 19 41 46 11 6.0 3.3 15
Tenderette 3.9 14 7.0 3.0 6.9 18 34 55 22 5.9 2.8 11
Tendergreen 3.8 15 8.6 3.1 8.4 18 36 57 16 5.9 2.5 11
Tendergreen Improved 3.5 15 7.6 2.4 7.3 14 30 54 13 5.9 2.9 14
Turmalina 3.1 16 7.7 3.9 8.5 15 33 52 12 5.9 2.9 11
LSD (0.05) 0.6 1.3 1.1 0.4 0.9 6.2 1.9 4.4 5.4 0.6 0.5 2.6
Table 4. Adjusted averages of 29 bush snap bean genotypes for the 12 traits assessed and basic statistics associated with the analysis of variance.
(1) PVI: plant vigor; PLE: pod length (cm); PDI: pod diameter (cm); CPA: commercial pod aspect; PWE: pod weight (kg); NCP: number of commercial pods per plant;
HSW: 100-seed weight (g); PHH: plant height at harvest (cm); NMP: number of mature pods per plant; NSP: number of seeds per pod; SYI: seed yield (t ha-1);
CPY: commercial pod yield (kg ha-1). **, *: significant for p ≤ 0.01 and p ≤ 0.05, respectively, according to the Student’s t-test.
Trait(1) PVI PLE PDI CPA PWE NCP HSW PHH NMP NSP SYI CPY
PVI - -0.03 -0.03 -0.19 0.06 -0.19 0.35* 0.13 -0.31* 0.13 0.26 0.11
PLE -0.11 - 0.16 0.59** 0.29 0.04 0.01 0.32* -0.18 -0.04 -0.07 0.22
PDI -0.13 0.05 - -0.01 0.29 -0.10 0.15 -0.20 -0.22 -0.06 -0.05 -0.06
CPA -0.23 0.65** -0.01 - 0.22 0.26 -0.16 0.22 0.00 0.00 -0.22 0.37*
PWE 0.06 0.32* 0.50** - -0.29 0.49** 0.19 -0.33* -0.06 0.06 0.16
NCP -0.18 0.11 -0.19 0.24 -0.34* - -0.31* -0.37* 0.34* -0.11 0.13 0.77**
HSW 0.43* 0.01 0.23 0.30 0.51** -0.37* - -0.05 -0.43** -0.21 0.45** -0.01
PHH 0.15 0.36* -0.31* -0.16 0.22 -0.43** -0.05 - -0.04 0.27 -0.14 -0.25
NMP -0.40* -0.22 -0.42* 0.24 -0.39* 0.46** -0.55** -0.11 - -0.04 0.09 -0.11
NSP 0.33* -0.10 -0.11 -0.02 -0.10 -0.15 -0.34* 0.39* -0.11 - -0.03 -0.18
SYI 0.29 -0.11 -0.15 0.00 0.07 0.18 0.49** -0.18 0.04 -0.12 - 0.29
CPY 0.11 0.24 -0.17 -0.26 0.18 0.67** -0.02 -0.25 -0.12 -0.15 0.22
and pods with good commercial quality, including succulent green pod wall, the Contender cultivar could be recommended for use by regional producers or in crosses to generate promising segregating populations.
Using the squared Mahalanobis distance (D2ii’), the 29 genotypes were grouped into four
clusters, either by the Tocher optimization method (Table 6) or the UPGMA method (Figure 1). This equivalence in clustering genotypes by the methods is an evidence of a high consistency in the results, also supported by the high estimates of the cophenetic
correlation coefficient (Tocher’s method: 0.83; UPGMA: 0.72), both significant (p < 0.001) by
Figure 1. Generalized Mahalanobis distances (D2
ii’) dendrogram based on the UPGMA clustering of 29 bush snap bean genotypes
for the 12 traits assessed. Cophenetic correlation coefficient: 0.72 (p < 0.001 by the Mantel test). Cophenetic correlation coefficient: 0.83 (p < 0.001 by the Mantel test).
Cluster I II III IV Number of genotypes Genotype
I 51.5 112.7 120.2 247.4 23
Line Hab 46, Tendergreen, Line Hab 39, Tenderette, Royal Burgundy, Branco Japonês, Improved Gold Wash,
Turmalina, Commodore Improved, Festina, Rocdor,
Tendergreen Improved, Purple Queen, Strike, Kentucky
Wonder Bush, Line Hab 1, Derby, Amarelo Japonês,
Jade, Blue Lake 274, Espada, Slenderwash, Gold Rush
II 45.1 296.1 398.8 3 Delinel, Maxibel, Provider
III 62.1 96.6 2 Cherokee Wax, Stringless Green
IV 0 1 Contender
Table 6. Average distance, within (diagonal) and between (off-diagonal) clusters, among the four clusters determined by the Tocher
the Mantel test. As expected, a lower estimate of cophenetic correlation was detected for the UPGMA method, given that the cophenetic distances obtained by the Tocher method reliably synthesize the original generalized Mahalanobis distance. Furthermore, hierarchical methods, such as UPGMA, typically
exhibit weaker linear association, resulting in a
distortion of the cophenetic distances (Silva & Dias 2013). These results indicate that there is a high genetic divergence between some of the genotypes assessed, because, although the great majority of the genotypes are grouped with less than 50 units of distance (e.g., clusters I), the clusters diverged from each other in distances of about 100 units or more.
Based on the results of clustering, possible crosses between the genotypes allocated to cluster I,
about 79.3 % from the total (Table 6), would tend to
decrease the probability of obtaining more promising segregating populations. The largest generalized Mahalanobis distance was observed between clusters II and IV (398.8), and clusters II and III (296.1), indicating the importance of the genotypes allocated to cluster II (Delinel, Maxibel and Provider cultivars), as a source of parents for promising crosses. However, it is important to note that the clustering data alone
is not the best strategy for defining crosses, since
genetically distinct genotypes do not necessarily have the best combining ability. Therefore, crosses between the best genotype from cluster II and the Contender cultivar, single genotype from cluster IV, could be more interesting to the breeding program. According to Cruz et al. (2012), provided that the genotypes have high additive value, i.e., high average for the interesting traits, the use of the most contrasting ones should be considered for crosses. This type of cross can increase the probability to
complement different but favorable alleles, increasing
their frequency in superior genotypes.
The canonical variable analysis explained
82.45 % of the total variation by the first three
canonical variables (Figure 2). The dispersion of
the scores of genotypes in the space of the first three
canonical variables showed the formation of about four clusters, also detected by the Tocher optimization and UPGMA methods. As previously observed, the Contender cultivar (code 6), a single constituent of cluster IV, was the most divergent to the other clusters, especially for pod weight, 100-seed weight and commercial pod yield (Table 6). Based on the absolute generalized Mahalanobis distances (D2ii’,
data not shown), the six pairs of genotypes with the largest distance values, in decreasing order, were: Contender x Slenderwash, Contender x Gold Rush, Contender x Espada, Contender x Delinel, Maxibel x Stringless Green and Contender x Derby. Therefore, the exploitation of the genetic variability released with such crosses may contribute to the selection of more transgressive genotypes (Rahman et al. 2002, Cruz et al. 2012).
The relative contribution of each trait to the genetic dissimilarity, according to the method by Singh (1981), showed that two of these traits
contributed with 64.45 % of genetic divergence
between the genotypes (Table 7). These traits were
100-seed weight, contributing with 47.25 %, and commercial pod aspect, with 17.2 %, indicating the
existence of expressive genetic variability for these traits, as previously described (Table 3). These traits
were more efficient in explaining the dissimilarity
among genotypes and, therefore, should be prioritized when choosing parents in breeding programs. The commercial pod yield, although it has also shown a great amplitude (6-18 t ha-1) (Table 4), had a small
contribution to divergence, with 7.58 %, being the
fourth in importance. Despite this result, this trait is important for breeding, since the selection of parents with higher commercial pod yield in crosses will result in a greater probability of obtaining superior lines.
To assess the magnitude of the canonical variables expressed for each trait, correlation
Figure 2. Three-dimensional dispersion of 29 bush snap bean
genotypes, in relation to the first three canonical
coefficients between the traits and the canonical scores were determined for the first four canonical variables, which explained more than 80 % of the total variation (Table 7). Significant correlations
of moderate to high magnitudes indicate the partial contribution of the traits to the total variability (Dias et al. 2009). The first canonical variable (CV1) explained the largest portion of the total variation attributed to 100-seed weight, a trait that contributed the most to genetic divergence. The second variable (CV2) capitalized on much of the variability arising from the commercial pod aspect and the third variable (CV3) explained, in most cases, the plant height at harvest. If compared to the contribution of these traits to the genetic divergence, determined by the Singh’s method (1981), there was a strong association between the results. Iezzoni & Pritts (1991), in a study with principal component analysis, also found that, generally, traits with the largest eigenvalues and highest correlations are more important for the respective component and, therefore, explain the capitalized variation.
An interesting factor to note is the lack of
correspondence between the clusters formed and the origin of the genotypes, which come from breeding programs in four different countries (Brazil, Colombia, United States of America and Japan). So, as most the snap bean genotypes from
different countries of origin tended to cluster together,
similar germplasm may have been shared between
countries, possibly due to strong trans-national seed exchange. In the literature, there is some evidence for snap bean ancestry having both Mesoamerican and Andean origins, especially regarding the existence of large seed size variability, which is associated with the phaseolin allele pattern (Myers & Baggett 1999, Blair et al. 2010). According to these authors, the intense selection pressure for seed size in snap beans, in parallel to the selection for seed types in dry beans, freed the phaseolin alleles to introgress from one genepool to another. Such factors have been responsible for the blurred distinction between the large-seeded Andean and small-seeded Mesoamerican types in snap beans.
Therefore, the association between seed size and centers of domestication, i.e., Andean or Mesoamerican, possibly is the main factor associated with the clustering pattern of the 29 genotypes
assessed, in addition to the key importance of the
100-seed weight for the genetic divergence. Better evidence of this clustering pattern is the phaseolin alleles pattern detected in genotypes already
evaluated in other studies, such as Kentucky Wonder and Blue Lake-derived cultivars, belonging to a
subgroup within the Mesoamerican genepool (Blair et al. 2010). As observed in this study, such cultivars of smaller seeds were allocated to cluster I (Table 6). On the other hand, the most distant Contender cultivar was allocated to cluster IV, thus possibly belonging to the Andean genepool.
(1) PVI: plant vigor; PLE: pod length (cm); PDI: pod diameter (cm); CPA: commercial pod aspect; PWE: pod weight (kg); NCP: number of commercial pods per plant;
HSW: 100-seed weight (g); PHH: plant height at harvest (cm); NMP: number of mature pods per plant; NSP: number of seeds per pod; SYI: seed yield (t ha-1);
CPY: commercial pod yield (kg ha-1). **, *: significant for p ≤ 0.01 and p ≤ 0.05, respectively, according to the Student’s t-test.
Trait(1) Singh statistics Canonical variables (CVi)
S.j (%) Accumulated S.j (%) CV1 CV2 CV3 CV4
HSW 47.25 47.25 -0.99** 0.01 -0.02 -0.02
CPA 17.20 64.45 0.19* 0.91** 0.16* 0.04
PHH 8.10 72.55 0.02 0.40** -0.72** -0.42
CPY 7.58 80.13 0.00 0.41** 0.65** 0.13
PWE 5.43 85.56 -0.42** 0.41** -0.32** 0.66**
PLE 4.16 89.73 0.00 0.58** -0.06 -0.02
SYI 3.18 92.90 -0.33** -0.06 0.24** -0.10
PVI 2.47 95.38 -0.25** 0.01 -0.01 -0.28**
NMP 1.58 96.95 0.31** -0.10 -0.03 0.00
NSP 1.13 98.09 0.17* 0.02 -0.13 -0.04
PDI 0.99 99.08 -0.02 0.01 -0.01 0.35**
NCP 0.92 100.00 0.22** 0.16* 0.61** -0.02
Table 7. Relative contribution (S.j) and accumulated relative contribution (Accumulated S.j) of the 12 traits assessed for genetic
CONCLUSIONS
1. The 29 snap bean genotypes exhibited a wide range
of variability and differentiation for agronomic and
morphological traits, mainly for 100-seed weight, aspect and yield of commercial pods, plant height at harvest and pod weight. Therefore, these traits
are favorable for improvement through effective
phenotypic selection, where high genetic gain can
be achieved;
2. High genetic divergence was detected between the genotypes, in which 100-seed weight and commercial pod aspect were the most important traits for clustering. Some genotypes possess desirable characteristics for these and other traits, given the favorable genetic associations between traits, and hence could be used directly by regional producers or included in crosses for cultivar
development;
3. Snap bean genotypes from different countries
of origin tend to cluster together, indicating that similar germplasm is shared among different countries, thus suggesting a strong trans-national seed exchange.
REFERENCES
ARAÚJO, L. C. et al. Contribution of components of production on snap beans yield. Crop Breeding and Applied Biotechnology, v. 12, n. 3, p. 206-210, 2012. BLAIR, M. W. et al. Extensive diversity and inter-genepool introgression in a world-wide collection of indeterminate snap beans accessions. Theoretical and Applied Genetics, v. 120, n. 7, p. 1381-1391, 2010.
CRUZ, C. D.; REGAZZI, A. J.; CARNEIRO, P. C. S.
Modelo biométrico aplicado ao melhoramento genético. Viçosa: UFV, 2012.
DIAS, F. T. C.; SILVA, A. P. M.; BERTINI, C. H. C. M.
Genetic divergence in cowpea genotypes with upright growth and early cycle. Crop Breeding and Applied Biotechnology, v. 9, n. 3, p. 253-259, 2009.
E M P R E S A B R A S I L E I R A D E P E S Q U I S A AGROPECUÁRIA (Embrapa). Sistema brasileiro de
classificação de solos. 3. ed. Brasília, DF: Embrapa, 2013.
FILGUEIRA, F. A. R. Novo manual de olericultura: agrotecnologia moderna na produção e comercialização de hortaliças. 3. ed. Viçosa: UFV, 2013.
GEPTS, P. et al. Phaseolin-protein variability in wild forms and landraces of the common beans (Phaseolus vulgaris):
evidence for multiple center of domestication. Economic Botany, v. 40, n. 4, p. 451-456, 1986.
HENNING, F. A. et al. Composição química e mobilização de reservas em sementes de soja de alto e baixo vigor. Bragantia, v. 69, n. 3, p. 727-734, 2010.
IEZZONI, A. F.; PRITTS, M. P. Applications of principal
component analysis to horticultural research. HortScience, v. 26, n. 4, p. 334-338, 1991.
JOHNSON, R. A.; WICHERN, D. W. Applied multivariate
statistical analysis. New Jersey: Englewood Cliffs, 1992.
KRAUSE, W. et al. Genetic divergence in snap beans based on agronomic traits and resistance to bacterial wilt. Crop Breeding and Applied Biotechnology, v. 9, n. 3, p. 246-252, 2009.
MAHALANOBIS, P. C. On the generalized distance in statistics. Proceedings of the National Institute of Sciences of India, v. 2, n. 1, p. 49-55, 1936.
MALUF, W. R.; FERREIRA, P. E. Análise multivariada
da divergência genética em feijão-de-vagem (Phaseolus vulgaris L.). Horticultura Brasileira, v. 1, n. 2, p. 31-34, 1983.
MANTEL, N. The detection of disease clustering and a generalized regression approach. Cancer Research, v. 27, n. 2, p. 209-220, 1967.
MORAIS JÚNIOR, O. P. et al. Desempenho de cultivares
de couve-flor de verão em Ipameri. Ciência Rural, v. 42, n. 11, p. 1923-1928, 2012.
MYERS, J. R.; BAGGETT, J. R. Improvement of snap
beans. In: SINGH, S. (Ed.). Common bean improvement for the 21st century. Boston: Kluwer, 1999. p. 289-329. PEIXOTO, N. et al. Características agronômicas, produtividade, qualidade de vagens e divergência genética em feijão-vagem de crescimento indeterminado. Horticultura Brasileira, v. 20, n. 3, p. 447-451, 2002.
PEIXOTO, N.; CARDOSO, A. I. I. Cultura do
feijão-vagem. In: NASCIMENTO, W. M. (Ed.). Hortaliças leguminosas. Brasília, DF: Embrapa, 2016. p. 102-126. R CORE TEAM. R: a language and environment for statistical computing. Vienna: R Foundation for Statistical Computing, 2016.
RAHMAN, M.; HUSSAIN, D.; ZAFAR, Y. Estimation of
genetic divergence among elite cotton cultivars-genotypes
by DNA fingerprinting technology. Crop Science, v. 42, n. 6, p. 2137-2144, 2002.
RESENDE, M. D. V.; DUARTE, J. B. Precisão e controle
de qualidade em experimentos de avaliação de cultivares. Pesquisa Agropecuária Tropical, v. 37, n. 3, p. 182-194, 2007.
SILVA, A. R. D.; DIAS, C. T. D. S. A cophenetic correlation coefficient for Tocher’s method. Pesquisa Agropecuária Brasileira, v. 48, n. 6, p. 589-596, 2013.
SINGH, D. The relative importance of characters affecting
genetic divergence. Indian Journal of Genetics & Plant Breeding, v. 41, n. 2, p. 237-245, 1981.
SNEATH, I. H. A.; SOKAL, R. R. Numerical taxonomy.
San Francisco: Freeman and Company, 1973.
SOKAL, R. R.; ROHLF, F. J. The comparison of
dendrograms by objective methods. Taxon, v. 11, n. 2, p. 30-40, 1962.
SOUSA, D. M. G.; LOBATO, E. Cerrado: correção do
solo e adubação. 2. ed. Brasília, DF: Embrapa Cerrados, 2004.
STEEL, R. G. D.; TORRIE, J. H. Principles and
procedures of statistics: a biometrical approach. 2. ed.
New York: McGraw Hill, 1980.
VENCOVSKY, R.; BARRIGA, P. Genética biométrica no
fitomelhoramento. Ribeirão Preto: Sociedade Brasileira