Efeitos gênicos na qualidade de sementes em cruzamentos dialélicos de milho-pipoca
Pablo Diego Silva Cabral1, Antonio Teixeira do Amaral Júnior2, Henrique Duarte Vieira2,
Juliana Saltires Santos2, Ismael Lourenço de Jesus Freitas2, Messias Gonzaga Pereira2
ABSTRACT
The failure to obtain the ideal stand is one of the causes of decreased crop yields, in this sense it is important to investigate the genetic effects related to seed quality. The aim of this study was to measure the general combining ability (GCA), the specific combining ability (SCA) and the reciprocal effects (RE) for popcorn seed quality in addition to evaluate the association between germination and vigor tests with field emergencein order to identify hybrids with better germination and vigour. Ten inbred lines were evaluated using a complete diallel cross with reciprocals. Seed quality was measured by germination tests (GT) and by modified cold vigour tests (MCV). In the GT, the numbers of strong normal seedlings (SNS), weak normal (WNS), abnormal (AS) and ungerminated seeds (UGS) were counted. In the MCV, the numbers of normal seedlings (NPC), abnormal (ASC) and ungerminated seeds (UGSC) were counted, and the plants’ dry matter (DM) was measured. Analysis of variance for GCA, SCA and RE were significant for all variables. The quadratic components for SCA were higher than those for GCA for the SNS, AS, UGS, ASC and UGSC traits, which indicates higher significance for the non-additive effects. The most favourable GCA estimates, were found in lines P3 and L70. The best hybrids were P1xL70, P3xP6 and P8xL70. The RE results showed that L70 and P3 should be used as the female parent in the P1xL70 and P3xP6 hybrid crosses, respectively. The MCV was the test that was most strongly correlated with field emergence, with a magnitude of 0.667.
Index terms: General and specific combining ability, maternal effect, germination and vigour.
RESUMO
O insucesso na obtenção do estande ideal é uma das causas da diminuição do rendimento das culturas. Nesse sentido, torna-se importante investigar os efeitos gênicos relacionados à qualidade de torna-sementes. No pretorna-sente trabalho objetivou-torna-se avaliar a capacidade geral (CGC) e específica (CEC) de combinação e o efeito recíproco (ER) da qualidade de sementes de milho-pipoca e a correlação entre os testes de germinação e de vigor com a emergência no campo, visando à obtenção de híbridos com maior germinação e vigor. Avaliaram-se dez linhagens em cruzamento dialélico completo, com recíprocos. A qualidade das sementes foi avaliada por meio dos testes de germinação (TG), computando-se plântulas normais fortes (PNft) e fracas (PNfr), anormais (PA) e sementes não germinadas (SNG) e pelos testes de vigor de frio modificado (TFM), foram avaliadas plântulas normais (PNF) e anormais (PAF) e sementes não germinadas (SNGF) e pela matéria seca das plântulas (MS). De acordo com a análise de variância a CGC, a CEC e o ER foram significativos para todas as variáveis. Os componentes quadráticos relacionados aos efeitos de CEC foram maiores que os relacionados com a CGC para as características PNfr, PA, SNG, PAF e SNGF, indicando a maior significância dos efeitos não-aditivos. As estimativas mais favoráveis para CGC, foram expressas pelas linhagens P3 e L70. As melhores combinações híbridas: P1xL70, P3xP6 e P8xL70. O ER demonstrou que nos híbridos P1xL70 e P3xP6 as linhagens L70 e P3 devem ser utilizadas como genitora feminina nesses cruzamentos, respectivamente. A maior estimativa de correlação com a emergência em campo ocorreu para TFM, com magnitude de 0.667.
Termos para indexação: Capacidade geral e específica de combinação, efeito materno, germinação e vigor.
(Received in march 14, 2013 and approved in october 24, 2013)
1Universidade Estadual do Norte Fluminense “Darcy Ribeiro”/UENF – Avenida Alberto Lamego – 2000 – Parque Califórnia – 28013-602 – Campos dos Goytacazes – RJ – Brasil – [email protected]
2Universidade Estadual do Norte Fluminense “Darcy Ribeiro”/UENF – Campos dos Goytacazes – RJ – Brasil INTRODUCTION
One of the primary causes of reduced yield per unit area for most cultivated varieties of plants is unsuccessful stand establishment that is the result of crops with substandard populations (MARCOS FILHO, 2005). Thus, it is essential to investigate the nature of the genetic effects that affect the seed quality traits and the effects of different
genetic structures in populations in the field with respect to germination and vigour (TEKRONY; EGLI, 1991). Seed quality may be defined as the sum of the genetic, physical, physiological and health-related traits that affect the plant’s ability to perform vital functions; it is characterised by germination and vigour (POPINIGIS, 1985).
tests may overestimate performance in the field because they are conducted under ideal temperatures and humidity. As a result, vigour tests are performed to complement data obtained from germination tests and to detect significant differences in seed quality in lots with similar germination rates (MARCOS FILHO, 2005). Of the various vigour tests used for maize growth, the modified cold test is the most recommended because of its strong correlation with plant emergence in the field (MCDONALD, 1975; MOLINA; IRIGON; ZONTA, 1987; TEKRONY; EGLI; WICKAM, 1989; BARROS et al., 1999).
Despite the importance of developing cultivars with high germination and vigour, few studies have been performed on the predominant genetic effects controlling the traits associated with seed quality in popcorn. Therefore, studying their combining ability may yield valuable information because it will permit the best parents to be selected to create hybrids with higher seed quality based on their general combining ability (GCA) and specific combining ability (SCA), in addition to the reciprocal effects (RE) (GRIFFING, 1956).
Moterle et al. (2012) studied combining ability with respect to seed quality in nine popcorn lines using a complete diallel cross without reciprocals and found significant GCA and SCA values in the germination, first count, accelerated aging, modified cold, electr ic conductivity, plant emergence in sand bed, emergence speed and emergence speed index tests. These authors also found that non-additive effects were more important than additive effects on genetic control of the physiological quality of popcorn seeds. Gomes et al. (2000) also found that non-additive genetic effects had a greater effect on seed quality in a complete diallel cross of field maize than additive effects. Conversely, Antuna et al. (2003) and Ortiz et al. (2006) studied the genetic control of the physiological quality of field maize seeds and observed that additive effects had a greater effect on genetic control than non-additive effects in the majority of the germination and vigour tests performed.
The aim of the present study was to estimate the GCA, SCA and RE of ten popcorn inbred lines using diallel crosses, in addition to measuring the correlation of germination and vigour tests with field emergence in the identification of genetic combinations with better germination and vigour.
MATERIAL AND METHODS
Ten S7 popcorn lines (Table 1) from the genetic improvement programme at Darcy Ribeiro Northern Rio de Janeiro State University (Universidade Estadual do Norte
Fluminense Darcy Ribeiro - UENF) were evaluated using a complete diallel cross with reciprocals, which resulted in a total of 90 diallel hybrids.
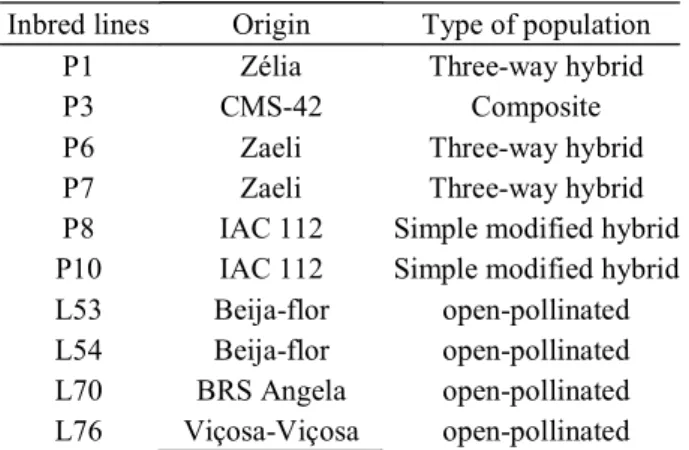
Table 1 – Origin and type of population of inbred lines used for diallel scheme.
Inbred lines Origin Type of population
P1 Zélia Three-way hybrid
P3 CMS-42 Composite
P6 Zaeli Three-way hybrid
P7 Zaeli Three-way hybrid
P8 IAC 112 Simple modified hybrid
P10 IAC 112 Simple modified hybrid
L53 Beija-flor open-pollinated
L54 Beija-flor open-pollinated
L70 BRS Angela open-pollinated
L76 Viçosa-Viçosa open-pollinated
Germination and vigour tests were performed in the Seed Production and Technology Sector of the UENF Plant Science Laboratory. The germination test (GT) was performed in quadruplicate with 50 seeds per replicate. The seeds were placed between three paper towels that had been moistened with a volume of distilled water equivalent to 2.5 times the mass of the dry paper. They were then rolled and transferred to a biological oxygen demand (BOD) incubator alternating between 20-30 °C, as described in Brasil (2009). Final counts were made after seven days, and the percentages of normal seedlings (NS), abnormal seedlings (AS) and ungerminated seeds (UGS) were calculated. Normal seedlings were classified as strong normal (SNS) and weak normal (WNS). SNS were those seedlings with the most developed coleoptile and root (mass and length), consistent with the classification by Nakagawa (1999).
biochemical oxygenation demand (BOD) germination chamber without light and at a constant temperature of 10p C. After this period, the rolls were transferred to the germinator for four days with temperature alternating between 20-30 °C, as recommended by Brasil (2009). Following this incubation, they were evaluated to calculate the percentage of normal seedlings (NPC), abnormal seedlings (ASC) and ungerminated seeds (UGSC).
Field emergence was evaluated in the experimental field at the Antônio Sarlo State Agricultural College (Colégio Estadual Agrícola Antônio Sarlo), in Campos dos Goytacazes, Rio de Janeiro. Ninety hybrids were planted 0.20 m apart in two rows that were 3.00 m in length and 0.90 m apart. Two seeds were planted per hole at a depth of 0.05 m. Emerged normal plants were counted in each parcel 14 days after planting and expressed as a percentage (NAKAGAWA, 1994).
The design used was randomised complete blocks with four replicates. Based on the analysis of variance results, the sum of squares for the treatments (hybrids) were decomposed into GCA, SCA and RE using Griffing’s Method III (1956) with a fixed model, wherein:
The Pearson´s correlation coefficient (r) between the results of the germination, vigour and field emergence tests was calculated using only the normal seedling data from the germination and vigour tests. All analyzes were performed using the software Genes (CRUZ, 2013).
RESULTS AND DISCUSSION
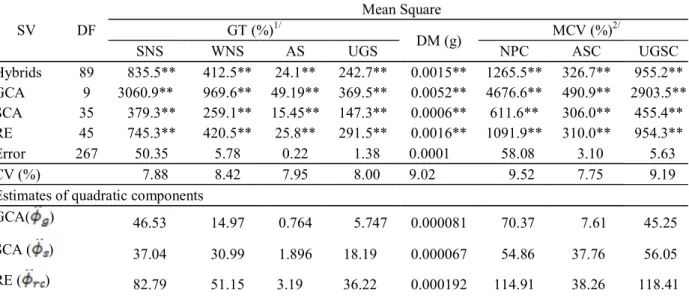
The F test revealed significant differences among the hybrids for all of the measured traits, indicating that there is genetic variation (Table 2). The effects of the GCA, SCA and RE were significant for all evaluated traits, which indicates that additive, non-additive and maternal effects are involved in the genetic control of these traits. Using diallel analysis in field maize lines to study seed quality, Moterle et al. (2011) showed that GCA, SCA and RE significantly affect the germination test as well as the first count, the MCV and emergence in sand bed vigour tests. Moterle et al. (2012) evaluated ten popcorn lines using a complete diallel cross without reciprocals and showed that GCA and SCA significantly affect all germination and vigour tests.
The estimates of quadratic components associated to GCA, SCA and RE indicated that non-additive effects had a greater impact on WNS, AS, UGS, ASC and UGSC than additive effects. However, the opposite effect was observed for SNS, DM and NPC, i.e., additive effects were predominant (Table 2). These results are consistent with Moterle et al. (2012), who found that non-additive effects were more important for the genetic control of seed quality by using the GT and the MCV.
Gomes et al. (2000) evaluated the combining ability of field maize lines for kernel quality and showed that non-additive effects were the most important for the GT and the MCV, which is consistent with the results found by Moterle et al. (2012). However, these results are not consistent with those observed by Antuna et al. (2003) and Ortiz et al. (2006), who observed that additive genetic effects had a larger influence on the GT. It is notable that these latter authors used a different methodology because they used only the mean squares associated with the GCA and SCA effects of each characteristic and did not use the corresponding estimated quadratic components.
The RE quadratic components for all of the traits were higher than those for SCA, which indicates that there is a difference between using a line as a male or a female in the same cross. These results corroborate the field maize results found by Moterle et al. (2011), who found greater effects for RE than SCA for germination, first counting and emergence in sand bed tests. However, these results are not consistent with those of Gomes et al. ij
ij i j ij ij
Y m g g s r
wherein:
ij
Y = mean value of the hybrids F’1s and reciprocal (i,j=1,2,...,p);
m= general mean;
,
i j
g g = effect of general combining ability of the ith and jth parent, respectively;
ij
s = effects of specific combining ability for crosses between parents of order i and j;
ij
r = reciprocal effect that measures the differences provided by the parent i or j when used as male or female in cross ij, and
ij
= average experimental error..
Being considered in this model that sij=sji e rij rji. The estimators square means of fixed effects associated with GCA (g), SCA (s) and ER (
rc ), were:
( ) ( ) ( )
; e ,
2( 2) 2 2
g rc
QMG QMR QMS QMR QMRC QMR
p
wherein:
(2000), who showed that the effects of SCA were usually greater than those of RE in field maize.
The coefficients of variation (CV%) ranged from 7.75 to 9:53% for ASC and NPC, respectively. According to the classification of corn suggested by Scapim et al. (1995) are among the bands values are low. Pimentel-Gomes (1985) reports that the CV% gives an idea about the experimental precision, and the lower the CV%, higher accuracy.
In the GT, the variation of the GCA (
i g ) – the
highest GCA estimate minus the lowest estimate divided by the standard deviation – were 20.28, 35.73, 44.39 and 45.87 times the standard deviation for SNS, WNS, AS and UGS, respectively (Table 3), which indicates, therefore, that there are significant differences between the GCA effects of the lines. These results are much greater than those found by Gomes et al. (2000), who observed a
i
g variation 3.98 times the standard deviation for the germination test in their study, although that study used only six field maize lines. The lines P3, P8, L53, L54, L70 and L76 had positive
i
g values for SNS and negative values for WNS, AS and UGS. The largest values were obtained for L76, followed by L70 and P3. These results indicate that these lines may contribute to increased seed germination because they tend to increase SNS and decrease the values of WNS, AS and UGS. Conversely, lines P1, P6, P7 and P10 had negative values for SNS and
positive values for WNS and UGS. Of these, only P7 had a negative value for AS, although it was small.
Seedling dry matter (DM) may be considered a vigour test for seeds (INTERNATIONAL SEED TESTING ASSOCIATION - ISTA, 1985); as dry matter increases, so does vigour. The
i
g variation for DM was 40 times
the standard deviation (Table 3). Lines P3, P6, L70 and L76 had positive values for GCA, although they were low; the P3 line had the highest value (0.022).
For the MCV, the variation of gi was 17.92, 37.95
and 62.45 times the standard deviation for NPC, ASC and UGSC, respectively (Table 3). Gomes et al. (2000) found variation for the cold test that were 10.33 times the standard deviation. The P3, L53, L54, L70 and L76 lines had positive GCA effects for NPC, and P3 had the largest value at 9.703. Only lines P1, P10 and L76 had positive values for ASC. Lines P3, P10, L53, L54, L70 and L76 had negative values for UGSC; P3 was the largest (-6.650). Thus, the line with the largest, most favourable values for this test, i.e., the line that tended to increase vigour the most, was P3.
Overall, the P3 and L70 lines had the most favourable GCA effect on germination and vigour. Cruz and Regazzi (2004) reported that crosses involving at least one parent that has the highest favourable GCA effect are best for hybrids with favourable SCA estimates.
Table 2 – Mean squares for general combining ability (GCA), specific combining ability (SCA) and reciprocal effects (RE) and its quadratic componentes for germination test (GT), seedling dry matter (DM) and modified cold vigour test (MCV).
1SNS = strong normal seedlings, WNS = weak normal seedlings, AS = abnormal seedlings, UGS = ungerminated seeds, 2NPC =
Normal seedlings in the modified cold test, ASC = abnormal seedlings in the modified cold test, UGSC = ungerminated seeds in the modified cold test. CV% = coefficients of variation. **Significant at a 1% probability level by the F-test.
SV DF
Mean Square
GT (%)1/
DM (g) MCV (%)
2/
SNS WNS AS UGS NPC ASC UGSC
Hybrids 89 835.5** 412.5** 24.1** 242.7** 0.0015** 1265.5** 326.7** 955.2**
GCA 9 3060.9** 969.6** 49.19** 369.5** 0.0052** 4676.6** 490.9** 2903.5**
SCA 35 379.3** 259.1** 15.45** 147.3** 0.0006** 611.6** 306.0** 455.4**
RE 45 745.3** 420.5** 25.8** 291.5** 0.0016** 1091.9** 310.0** 954.3**
Error 267 50.35 5.78 0.22 1.38 0.0001 58.08 3.10 5.63
CV (%) 7.88 8.42 7.95 8.00 9.02 9.52 7.75 9.19
Estimates of quadratic components
GCA( ) 46.53 14.97 0.764 5.747 0.000081 70.37 7.61 45.25
SCA ( ) 37.04 30.99 1.896 18.19 0.000067 54.86 37.76 56.05
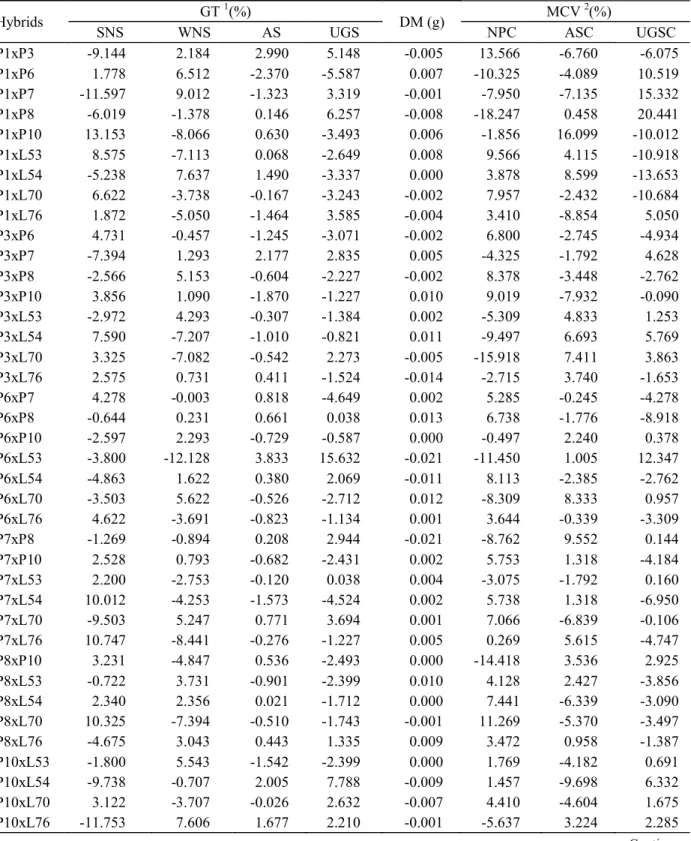
Therefore, based on SCA, the best combinations for improving germination and vigour are P1xL70, P3xP6 and P8xL70 (Table 4). The best of these hybrids is P8xL70 because it has the best SCA for most of the traits.
When analysing RE only in those hybrids for which at least one of the lines in the cross had a high GCA (hybrids P1xL70, P3xP6 and P8xL70), only the P1xL70 hybrid had a large negative value for NPC (-22.25) (Table 5). For ASC and UGSC, the estimates were high and positive, with values of 9.75 and 7.12, respectively, which indicates that the L70 line should be used as the female parent in this hybrid (P1xL70) to increase vigour. In the P3xP6 cross, a large positive effect was observed for NPC (8.00) and a negative effect was observed for UGSC (-9.25), which indicates that the P3 line should be used as a female parent. Conversely, large RE estimates were not found for the P8xL70 h ybr id, an d th er e wer e th us n o recommendations for the use of either line as the female parent.
Table 6 shows the simple correlation coefficients (r) between field emergence (FE), the GT, the MCV and DM. All of the correlations were significant; the largest estimate was between the GT and the MCV (0.676) and the lowest was between the MCV and DM (0.402).
With respect to the correlations between seedling emergence in the field and seed quality tests, the MCV was the most correlated with FE (0.667). A similar result
was found by Torres et al. (1998), who found a correlation between the MCV and FE with an r of 0.689 when the effectiveness of various tests for determining seed quality in field maize was evaluated. Molina, Irigon and Zonta (1987) also found a correlation coefficient of 0.845 for FE and the MCV in field maize. Therefore, using the MCV may assist in predicting the number of seedlings that will emerge in the field more accurately. In contrast, DM was not strongly correlated with FE (0.458), indicating that this vigour test is not adequate for identifying plants with high FE.
Th e per cen tage of n or mal seedl in gs t h at germinated in the GT was higher than in the MCV and FE (Table 6), which indicates that the GT overestimated this parameter, particularly compared to FE. Therefore, the GT should not be used to calculate the quantity of seeds to sow in a field. According to Johnson and Wax (1978) and Marcos Filho, Cícero and Silva (1987), the GT estimates are higher than FE because the laboratory humidity and temperature levels are ideal for seed germination in the GT, which is different than in the field. Conversely, the percentage of normal emerged seedlings in the MCV (73.20%) was very close to the FE percentage (72.30%). Marcos Filho, Cícero and Silva (1987) argue that this r esult is obser ved because th e cold test combines low temperature and higher humidity, thus only allowing seeds with more vigour to survive.
Table 3 – Estimates of the general combining ability effect (gi) and its standard deviation (SD) for ten parental lines (PL) in germination tests (GT), seedling dry matter (DM) and modified cold test (MCV).
1SNS = strong normal plants, WNS = weak normal plants, AS = abnormal plants, UGS = ungerminated seeds, 2 NPC = normal
plants form the modified cold test, ASC = abnormal plants in the modified cold test, UGSC = ungerminated seeds in the modified cold test. MSD = Minimum significant difference at 5% probability by test t.
PL GT
1
(%)
DM (g) MCV
2
(%)
SNS WNS AS UGS NPC ASC UGSC
P1 -9.463 4.013 1.484 3.719 -0.010 -18.172 5.494 12.897
P3 4.834 -1.269 -0.516 -2.672 0.022 9.703 -2.350 -6.650
P6 -13.213 7.653 0.844 4.438 0.001 -8.656 -1.272 9.506
P7 -2.838 1.153 -0.078 1.031 -0.003 -4.031 -1.225 3.944
P8 1.459 -1.081 -0.297 -0.281 -0.005 -1.234 -0.569 0.584
P10 -0.713 0.856 1.094 -0.906 -0.005 -0.375 3.416 -3.088
L53 1.741 -1.097 -0.594 -0.250 -0.001 6.703 -3.350 -3.181
L54 2.678 -0.097 -0.016 -1.688 -0.005 6.891 -0.459 -6.572
L70 6.819 -3.597 -0.609 -2.281 0.004 6.313 -1.678 -4.416
L76 8.694 -6.534 -1.313 -1.109 0.003 2.859 1.994 -3.025
SD 1.08 0.397 0.063 0.155 0.0008 1.558 0.233 0.313
Table 4 – Estimates of the specific combining ability effects (sij) and standard deviation (SD) for the germination test (GT), seedling dry matter test (DM) and modified cold vigour test (MCV).
Hybrids GT
1
(%)
DM (g) MCV
2
(%)
SNS WNS AS UGS NPC ASC UGSC
P1xP3 -9.144 2.184 2.990 5.148 -0.005 13.566 -6.760 -6.075
P1xP6 1.778 6.512 -2.370 -5.587 0.007 -10.325 -4.089 10.519
P1xP7 -11.597 9.012 -1.323 3.319 -0.001 -7.950 -7.135 15.332
P1xP8 -6.019 -1.378 0.146 6.257 -0.008 -18.247 0.458 20.441
P1xP10 13.153 -8.066 0.630 -3.493 0.006 -1.856 16.099 -10.012
P1xL53 8.575 -7.113 0.068 -2.649 0.008 9.566 4.115 -10.918
P1xL54 -5.238 7.637 1.490 -3.337 0.000 3.878 8.599 -13.653
P1xL70 6.622 -3.738 -0.167 -3.243 -0.002 7.957 -2.432 -10.684
P1xL76 1.872 -5.050 -1.464 3.585 -0.004 3.410 -8.854 5.050
P3xP6 4.731 -0.457 -1.245 -3.071 -0.002 6.800 -2.745 -4.934
P3xP7 -7.394 1.293 2.177 2.835 0.005 -4.325 -1.792 4.628
P3xP8 -2.566 5.153 -0.604 -2.227 -0.002 8.378 -3.448 -2.762
P3xP10 3.856 1.090 -1.870 -1.227 0.010 9.019 -7.932 -0.090
P3xL53 -2.972 4.293 -0.307 -1.384 0.002 -5.309 4.833 1.253
P3xL54 7.590 -7.207 -1.010 -0.821 0.011 -9.497 6.693 5.769
P3xL70 3.325 -7.082 -0.542 2.273 -0.005 -15.918 7.411 3.863
P3xL76 2.575 0.731 0.411 -1.524 -0.014 -2.715 3.740 -1.653
P6xP7 4.278 -0.003 0.818 -4.649 0.002 5.285 -0.245 -4.278
P6xP8 -0.644 0.231 0.661 0.038 0.013 6.738 -1.776 -8.918
P6xP10 -2.597 2.293 -0.729 -0.587 0.000 -0.497 2.240 0.378
P6xL53 -3.800 -12.128 3.833 15.632 -0.021 -11.450 1.005 12.347
P6xL54 -4.863 1.622 0.380 2.069 -0.011 8.113 -2.385 -2.762
P6xL70 -3.503 5.622 -0.526 -2.712 0.012 -8.309 8.333 0.957
P6xL76 4.622 -3.691 -0.823 -1.134 0.001 3.644 -0.339 -3.309
P7xP8 -1.269 -0.894 0.208 2.944 -0.021 -8.762 9.552 0.144
P7xP10 2.528 0.793 -0.682 -2.431 0.002 5.753 1.318 -4.184
P7xL53 2.200 -2.753 -0.120 0.038 0.004 -3.075 -1.792 0.160
P7xL54 10.012 -4.253 -1.573 -4.524 0.002 5.738 1.318 -6.950
P7xL70 -9.503 5.247 0.771 3.694 0.001 7.066 -6.839 -0.106
P7xL76 10.747 -8.441 -0.276 -1.227 0.005 0.269 5.615 -4.747
P8xP10 3.231 -4.847 0.536 -2.493 0.000 -14.418 3.536 2.925
P8xL53 -0.722 3.731 -0.901 -2.399 0.010 4.128 2.427 -3.856
P8xL54 2.340 2.356 0.021 -1.712 0.000 7.441 -6.339 -3.090
P8xL70 10.325 -7.394 -0.510 -1.743 -0.001 11.269 -5.370 -3.497
P8xL76 -4.675 3.043 0.443 1.335 0.009 3.472 0.958 -1.387
P10xL53 -1.800 5.543 -1.542 -2.399 0.000 1.769 -4.182 0.691
P10xL54 -9.738 -0.707 2.005 7.788 -0.009 1.457 -9.698 6.332
P10xL70 3.122 -3.707 -0.026 2.632 -0.007 4.410 -4.604 1.675
P10xL76 -11.753 7.606 1.677 2.210 -0.001 -5.637 3.224 2.285
Table 4 – Continuation...
Hybrids GT
1
(%) DM (g) MCV 2(%) Hybrids GT 1(%)
SNS
DM (g) MCV 2(%) Hybrids
SNS WNS AS WNS AS
L53xL54 3.809 -2.753 -1.057 -0.868 0.007 -0.747 -5.057 3.175
L53xL70 -7.457 9.122 0.786 -2.774 -0.007 -0.918 1.661 0.519
L53xL76 2.168 2.059 -0.760 -3.196 -0.004 6.035 -3.010 -3.372
L54xL70 -0.644 0.747 -0.417 1.663 0.001 -6.731 5.021 5.660
L54xL76 -3.269 2.559 0.161 -0.259 0.000 -9.653 1.849 5.519
L70xL76 -2.285 1.184 0.630 0.210 0.008 1.175 -3.182 1.613
SD 2.839 1.045 0.166 0.409 4.097 0.614 0.827 0.220
MSD 6.953 2.356 0.463 1.149 0.008 7.468 1.726 2.325
1SNS = strong normal seedlings, WNS = weak normal seedlings, AS = abnormal seedlings, UGS = ungerminated seeds, 2 NPC =
normal seedlings in the modified cold test, ASC = abnormal seedlings in the modified cold test, UGSC = ungerminated seeds in the modified cold test. MSD = Minimum significant difference at 5% probability by test t.
Table 5 – Estimates of the reciprocal effects (rij) and its standard deviation (SD) for the germination test (GT), seedling dry matter test (DM) and modified cold test (MCV).
Hybrids GT
1
(%)
DM (g) MCV
2
(%)
SNS WNS AS UGS NPC ASC UGSC
P1xP3 -2.500 -12.125 5.375 10.750 -0.0363 -10.750 1.750 9.000
P1xP6 -2.000 3.750 0.625 -2.375 -0.0176 -20.500 3.000 23.250
P1xP7 -3.250 -5.500 -1.000 8.625 -0.0091 -28.500 -1.500 32.500
P1xP8 -1.625 -10.375 0.000 13.250 -0.0012 -18.500 -13.250 31.750
P1xP10 13.375 -17.375 4.875 1.125 -0.0148 -9.250 21.375 -3.125
P1xL53 9.625 -17.500 0.375 6.125 -0.0020 -11.250 0.625 8.625
P1xL54 7.375 -14.375 4.875 3.250 -0.0056 -16.750 14.500 -0.500
P1xL70 0.750 -4.625 1.375 2.500 -0.0043 -22.250 9.750 7.125
P1xL76 7.000 -19.000 -0.125 10.750 -0.0162 -27.250 3.500 23.750
P3xP6 -0.750 3.500 1.000 -3.500 0.0066 8.000 3.500 -9.250
P3xP7 -2.750 4.500 -0.750 -2.250 0.0370 7.500 0.500 -11.750
P3xP8 -2.125 1.125 0.500 -0.125 0.0141 -1.500 3.500 -2.000
P3xP10 -2.750 7.625 -1.375 -1.000 0.0126 2.500 -1.500 -1.000
P3xL53 4.000 -5.500 0.750 0.750 0.0227 -8.750 5.500 3.250
P3xL54 -6.000 6.500 -0.375 -0.125 0.0245 -6.250 2.250 2.375
P3xL70 3.375 -5.375 0.250 0.625 0.0155 -12.250 5.250 1.625
P3xL76 -6.500 5.000 -0.250 -0.750 -0.0007 -3.000 9.000 -1.000
P6xP7 3.375 -7.375 -0.250 4.625 -0.0010 -15.250 2.875 15.500
P6xP8 -4.625 -6.000 1.375 9.250 0.0043 -7.000 0.750 8.000
P6xP10 9.625 -7.375 -1.125 -2.000 -0.0150 -9.375 5.750 3.625
P6xL53 -7.500 -26.125 4.750 25.625 -0.0099 -34.250 5.250 29.000
P6xL54 -2.250 -7.000 1.125 8.125 -0.0202 -7.500 0.750 6.000
P6xL70 10.250 -7.000 0.375 -4.500 -0.0001 -11.000 15.250 -5.125
Table 5 – Continuation...
Hybrids GT
1
(%) DM (g) MCV 2(%) Hybrids GT 1(%)
SNS
DM (g) MCV 2(%) Hybrids
SNS WNS AS WNS AS
P6xL76 1.500 -6.500 0.125 6.250 -0.0138 -7.500 -4.000 11.500
P7xP8 8.250 -5.250 1.000 -4.250 0.0007 8.875 -8.125 -4.000
P7xP10 19.375 -21.375 3.000 -1.000 0.0005 1.250 -0.125 -1.000
P7xL53 6.875 -1.500 -0.125 -6.625 0.0122 1.500 0.250 -9.250
P7xL54 -9.375 9.000 -0.250 0.625 -0.0029 -2.750 1.500 -1.750
P7xL70 10.625 -8.125 2.000 -4.250 -0.0137 3.500 0.125 -6.250
P7xL76 4.000 -7.000 -1.000 4.000 -0.0129 -0.750 -5.250 6.000
P8xP10 6.500 -2.375 2.750 -1.875 0.0027 10.375 -2.000 -7.750
P8xL53 0.625 -0.875 0.375 0.125 0.0053 1.250 2.125 -3.375
P8xL54 -9.250 8.125 -0.375 -2.375 0.0024 6.250 -2.750 -2.750
P8xL70 -4.500 -1.000 0.750 1.750 -0.0063 -0.500 -1.250 1.500
P8xL76 5.500 -3.125 -0.500 -2.000 -0.0158 3.750 -2.750 -3.000
P10xL53 -1.375 -1.625 -0.125 3.000 0.0138 -4.750 2.250 5.750
P10xL54 -7.875 2.125 -1.500 6.250 -0.0122 -4.125 -0.125 0.500
P10xL70 2.375 0.375 1.875 -1.250 0.0007 4.500 -3.000 -1.500
P10xL76 4.500 -6.125 0.875 0.750 -0.0277 -8.000 9.000 -1.000
L53xL54 -11.375 12.625 -0.250 -1.000 0.0054 3.250 -1.250 -2.250
L53xL70 -12.000 12.500 0.750 -1.250 -0.0111 -0.250 0.000 0.250
L53xL76 0.250 -1.000 0.000 0.750 -0.0195 -0.750 -0.500 1.250
L54xL70 -2.375 -5.250 1.125 3.750 0.0004 -10.875 7.250 6.000
L54xL76 16.500 -18.000 1.000 0.500 -0.0062 -2.750 4.250 4.750
L70xL76 -4.375 5.625 -0.625 1.875 -0.0086 -4.000 1.000 3.000
SD 3.21 1.18 0.18 0.46 0.002 4.64 0.69 0.93
MSD 6.953 2.356 0.463 1.149 0.008 7.468 1.726 2.325
1SNS = strong normal seedlings, WNS = weak normal seedlings, AS = abnormal seedlings, UGS = ungerminated seeds, 2 NPC =
normal seedlings in the modified cold test, ASC = abnormal seedlings in the modified cold test, UGSC = ungerminated seeds in the modified cold test. MSD = Minimum significant difference at 5% probability by test t.
Table 6 – Estimates of Pearson’s correlation (r) between field emergence (FE), germination test (GT), modified cold test (MCV) and seedling dry matter (DM), and the average percentage of normal emerged or germinated seedlings.
*, ** Significant at 5% and 1% probability level, respectively, by the t-test.
The average percentage of normal emerged plants in the DM test was 56.99% – lower than the FE results (72.30%). This result differs from that reported by Durães et al. (1994), who showed the importance of dry matter accumulation by seedlings to determine the vigour index for the seeds. Of all of the tests used to evaluate popcorn seed quality, that which best identified seeds with high vigour and high field emergence was the MCV.
CONCLUSIONS
There is genetic variability for seed quality in the studied lines, and non-additive genetic effect had the greatest contribution on seed quality.
FE GT MCV DM
FE 0.593** 0.667** 0.458**
GT 0.676** 0.428**
MCV 0.402*
Normal average of
There is a pronounced reciprocal effect for popcorn seed quality, requiring male and female parents to be designated prior to cross-breeding.
The MCV is highly correlated with seedling emergence in the field and may be used to estimate popcorn seed vigour.
REFERENCES
ANTUNA, O.G. et al. Componentes genéticos de caractertes agronómicos y de calidad fisiológica de semillas en líneas de maíz. Revista Fitotecnia Mexicana, Chapingo, v.26, n.1, p.11-17, 2003.
BARROS, A.S.R. et al. Teste de frio. In:
KRZYZANOWSKI, F.C.; VIEIRA, R.D.; FANÇA NETO, J.B. Vigor de sementes: conceitos e testes. Londrina: ABRATES, 1999. p.5.1-5.13.
BRASIL. Ministério da agricultura agropecuária e abastecimento. Secretaria de Defesa Agropecuária. Regras para Análise de Sementes, Brasília, 2009, 398p.
CRUZ, C. D. GENES - a software package for analysis in experimental statistics and quantitative genetics. Acta Scientiarum. Agronomy, Maringá, v. 35, n. 3, p. 271-276, 2013.
CRUZ, C.D.; REGAZZI, A.J. Modelos biométricos aplicados ao melhoramento genético. Viçosa: UFV, 2004. 480p.
DURÃES, F.O.M. et al. Índices de vigor de sementes de milho (Zea mays L.): Associação com emergência em campo, crescimento e rendimento de grãos. Revista Brasileira de Sementes, Brasília, v.17, n.1, p.13-18, 1995.
GOMES, M.S. et al. Estimativas da capacidade de combinação de linhagens de milho tropical para qualidade fisiológica de sementes. Ciência e
Agrotecnologia, Lavras, v.24 (Edição Especial), p.41-49, 2000.
GRIFFING, J.B. A generalized treatment of the use of diallel crosses in quantitative inheritance. Heredity, Oxford, v.10, p.31-50, 1956.
INTERNATIONAL SEED TESTING ASSOCIATION -ISTA. Handbook of vigour test methods. Zürich, 1995, ed. 3. 117p.
JOHNSON, R.R.; WAX, L.M. Relationship of soybean germination and vigor tests to field performance. Agronomy Journal, Madison, v.70, n.2, p.273-278. 1978.
MARCOS FILHO, J. Fisiologia de sementes de espécies cultivadas. Jaboticabal: Funep, 2005. 546p.
MARCOS FILHO, J.; CÍCERO, S.M.; SILVA, W.R. da. Avaliação da qualidade das sementes. Piracicaba: FEALQ, 1987. 230p.
MCDONALD JR, M.B. A review and evaluation of seed vigour test. Proceeding of the Association of Official Seed Analysts, Lansing, v.65, n.1, p.108-139, 1975.
MOLINA, J.C.; IRIGON, D.L.; ZONTA, E.P. Comparação entre metodologias do teste de frio na avaliação da qualidade fisiológica de sementes de milho (Zea mays L.). Revista Brasileira de Sementes, Brasília, v.9, n.3, p.77-85, 1987.
MOTERLE, L.M. et al. Combining ability of tropical maize lines for seed quality and agronomic traits. Genetics and Molecular Research, Ribeirão Preto, v.10, n.3, p.2268-2278, 2011.
MOTERLE, L.M. et al. Combining ability of popcorn lines for seed quality and agronomic traits.
Euphytica,Wageningen, v.185, n.3, p.337-347, 2012.
NAKAGAWA, J. Testes de vigor baseados na avaliação das plântulas. In: Vieira, R.D.; Carvalho, N.M. Testes de vigor em sementes. Jaboticabal: FUNEP, 1994, 48-85p.
ORTIZ, F.C. et al. Análisis dialélico para caracteres de vigor de semilla y de plântula en genótipos de maíz tropical. Revista Fitotecnia Mexicana, Chapingo, v.32, n.1, p.77-87, 2006.
PEREIRA, A.F. et al. Qualidade fisiológica de sementes e desempenho agronômico de genótipos de milho doce. Pesquisa Agropecuária Tropical, Goiânia, v.38, n.4, p.249-261, 2008.
PIMENTEL-GOMES, F. Curso de estatística experimental.11. ed. Piracicaba: Nobel, 1985, 466p.
SCAPIM, C.A.; CARVALHO, C. G. P. de; CRUZ, C. D. Uma proposta de classificação dos coeficientes de variação para a cultura do milho. Pesquisa Agropecuária Brasileira, Brasília, v. 30, n. 5, p.683-686, 1995.
TEKRONY, D.M.; EGLI, D.B. Relationship of seed vigor to crop yield: A Review. Crop Science, Madison, v.31, n.3, p.816-822, 1991.
TEKRONY, D.M.; EGLI, D.B.; WICKHAM, D.A. Corn seed vigour effect on no-tillage field performance and field emergence. Crop Science, Madison, v.29, n.6, p.1523-1528, 1989.