Mariana Madureira Ferreira Jacinto
Development and Implementation of an
Economic and Financial Evaluation Model of
R&D Projects:
A case study in the mobility sector
Master Thesis
Engineering and Industrial Management Integrated Master
Work performed under the guidance of
Professor Paulo Sérgio Lima Pereira Afonso
DIREITOS DE AUTOR E CONDIÇÕES DE UTILIZAÇÃO DO TRABALHO POR TERCEIROS Este é um trabalho académico que pode ser utilizado por terceiros desde que respeitadas as regras e boas práticas internacionalmente aceites, no que concerne aos direitos de autor e direitos conexos. Assim, o presente trabalho pode ser utilizado nos termos previstos na licença abaixo indicada.
Caso o utilizador necessite de permissão para poder fazer um uso do trabalho em condições não previstas no licenciamento indicado, deverá contactar o autor, através do RepositóriUM da Universidade do Minho.
Licença concedida aos utilizadores deste trabalho
Atribuição-NãoComercial-SemDerivações CC BY-NC-ND
A
CKNOWLEDGMENTSThank you to my team colleagues, and my team leader, specifically André Ferreira, who contributed to the development of this research project and helped me overcome every obstacle, as well as some professionals in Bosch related to the are with whom I had the pleasure to work.
Thank you to my university tutor who did the best he could at every meeting and phone call, was always present and supported all the steps taken in this dissertation project.
Thank you to my family support for their support throughout the whole degree. It would not have been possible without you.
Thank you to a special individual, that motivated me, kept my good humor, and never let me give up on my capabilities.
Thank you to everyone who contributed.
STATEMENT OF INTEGRITY
I hereby declare having conducted this academic work with integrity. I confirm that I have not used plagiarism or any form of undue use of information or falsification of results along the process leading to its elaboration.
Development and Implementation of an Economic and Financial Evaluation
Model of R&D Projects: A case study in the mobility sector
R
ESUMOOs projetos de Investigação e Desenvolvimento (I&D) possuem orçamento limitado, e estão dependentes das capacidades de investimento e de financiamento à disposição da empresa. Deste modo, a dimensão financeira deve estar presente na gestão de I&D para que possam ser identificados possíveis riscos e para que seja possível avaliar o retorno do investimento (ROI) o mais precocemente possível. Este projeto de investigação teve como objetivo o desenvolvimento de uma metodologia para avaliar projetos de I&D. O modelo de avaliação económico-financeira desenvolvido (modelo FINECON) é uma ferramenta para a tomada de decisão e avaliação de projetos de I&D e respetivos cenários financeiros, que se destina a empreendedores, empresas com projetos de I&D, ou, em último caso, investidores permitindo analisar as condições de viabilidade económico-financeira de novos produtos, negócios e startups de base tecnológica.
A metodologia proposta foi aplicada no MobiBUS, um projeto de mobilidade inteligente de I&D desenvolvido na Bosch Car Multimedia, em colaboração com a Universidade do Minho. A aplicação do modelo ao projeto MobiBUS suportou a sua total avaliação, a formulação hipotética de cenários otimistas e pessimistas, e o fornecimento de informações à equipa e potenciais investidores.Em suma, o projeto MobiBUS avaliou-se viável, tendo em conta os recursos, produto e tecnologia utilizada, e ainda suficientemente sustentável para que se crie uma start-up. O modelo desenvolvido pode ser aplicado noutros casos no contexto particular da mobilidade e noutros projetos de I&D de base tecnológica.
Palavras-Chave
Development and Implementation of an Economic and Financial Evaluation
Model of R&D Projects: A case study in the mobility sector
A
BSTRACTResearch and Development (R&D) projects have limited budgets, depending on the company’s investment and funding capacities available to the company. That being said, the financial dimension should be included in R&D management at every stage to identify possible risks and evaluate the return on investment (ROI), as soon as possible.
This research aims to develop a framework to evaluate R&D projects. The developed economic and financial model (FINECON Model) is a decision-making and evaluation tool for R&D projects and their financial scenarios, designed for entrepreneurs, companies with R&D teams, and, lastly, investors or business angels’ usage, allowing the economic and financial viability study of new products, businesses, and technological startups.
The proposed methodology was applied to MobiBUS, an intelligent mobility R&D project developed in Bosch Car Multimedia, in collaboration with the University of Minho.
The application of the developed model to the case study MobiBUS supported the whole evaluation, the formulation of good and bad hypothetical scenarios, and the delivery of information to the team and potential investors.
In conclusion, the MobiBUS project was evaluated as viable, taking into consideration its resources, product, and used technology, as well as sustainable enough to create a start-up. The developed model can be applied to other case studies in mobility contexts or other technological R&D projects.
Keywords
T
ABLE OFC
ONTENTSAcknowledgments ... iii
Resumo ... v
Abstract ... vi
Table of Contents ... vii
Abbreviations and Acronyms List ... xi
List of Figures ... xii
List of Tables ... xiv
1. Introduction ... 1
1.1 Background and Context ... 1
1.2 Motivation and Objective ... 4
1.3 Research Methodology ... 5
1.4 Dissertation Structure ... 6
2. Literature Review ... 7
2.1 Investment appraisal: approaches and models ... 7
2.1.1 Research with experts ... 8
2.1.2 Simplistic models ... 8
2.1.3 Benefit and Effectiveness Measurement models ... 9
2.1.4 Multi-criteria analysis ... 9
2.1.5 Comparing analysis ... 9
2.1.6 Systemic models ... 10
2.1.7 Programming models ... 10
2.1.8 Real Options Approaches ... 11
2.1.9 Economic and Financial Analysis ... 12
2.1.10 Economic evaluation tools and models applied in the industry ... 13
2.1.11 Additional financial ratios and methods ... 14
2.1.12 Sensitivity and Risk Analysis ... 15
2.2 Decision-making strategy ... 17
2.2.1 Technology Evaluation ... 17
2.2.3 Planning required resources ... 23
2.2.4 Taking financial decisions ... 24
2.3 Strategic Investment Decision-Making ... 26
2.3.1 Investment Appraisal as an overall ... 26
2.3.2 Strategic Perspective ... 27
2.3.3 Financial Perspective ... 28
2.3.4 Main criteria for decision-making ... 29
2.3.5 Current frameworks ... 31 2.3.6 Problems encountered ... 31 2.3.7 Opportunity Gap ... 32 3. Research Methodology ... 34 3.1 Research Process ... 34 3.2 Research Topic ... 34 3.3 Literature Review ... 35 3.4 Research Design ... 36
3.5 Data Collection and Analysis Methods ... 37
3.6 Research Steps ... 38
4. Economic and Financial Evaluation Model ... 39
4.1 Development Process ... 39 4.2 Model Structure ... 39 4.2.1 Characteristics ... 40 4.2.2 Organization ... 41 4.2.3 Evaluation in a loop ... 44 5. Case Study ... 45 5.1 Company Presentation ... 45 5.1.1 Bosch Group ... 45
5.1.2 Bosch Portugal and Car Multimedia (CM) Division ... 46
5.1.3 R&D department and the Innovation Process ... 46
5.2 Case Study Overall ... 47
5.2.2 Goals ... 48 5.2.3 Structure ... 48 5.3 Business Plan ... 48 5.3.1 Business Opportunity ... 48 5.3.2 Product ... 49 5.3.3 Market analysis ... 50 5.3.4 Strategic analysis ... 51
5.3.5 Marketing and sales plan ... 52
5.3.6 Action Plan ... 54 5.3.7 Strategic alliances ... 55 5.4 Financial Plan ... 55 5.4.1 Assumptions ... 55 5.4.2 Sales Forecast ... 56 5.4.3 Personnel Plan ... 56
5.4.4 Cash flow statement ... 57
5.4.5 Financial indicators ... 57
5.4.6 Risk and sensitivity analysis ... 58
5.5 Conclusions ... 58
6. Analysis and discussion of findings and results ... 59
6.1 Model validation ... 59
6.2 Case study validation ... 59
6.3 Answers to the RQ ... 60
7. Conclusions ... 61
7.1 Main Contributions ... 61
7.2 Future Work ... 62
Bibliography ... 63
Appendix I – Data collection techniques for evaluation proceedings ... 69
Appendix II – Type of decisions to consider in an economic and financial evaluation, regarding four categories: technology, business, resources, and finance ... 70
Appendix IV – FINECON Model ... 74
Appendix V – Bill-of-Materials (BOM) of the HW ... 76
Appendix VI – Detailed Product’ Costs ... 77
Appendix VII – Main Assumptions ... 80
A
BBREVIATIONS ANDA
CRONYMSL
IST AHP – Analytic Hierarchy ProcessBEP – Breakeven Point BM – Business model BOM – Bill of materials
CAPM – Cost of Capital by Capital Asset Pricing Model CBA – Cost/Benefit Analysis
CF – Cash Flow
CMA – Cost Minimisation Analysis DCF – Discounted Cash Flow
EBIT – Earnings before interest and tax GDP – Gross Domestic Product
IAPMEI - Agency for Competitiveness and Innovation ICT – Information & Communications Technologies IRR – Internal Rate of Return
LCM – Lowest Common Multiple MCA – Multi-Criteria Analysis
MARR – Minimum Attractive Rate of Return MP – Raw and other direct materials MOI – Indirect labour
MOD – Direct labour
MVP – Minimal viable product NPV – Net Present Value ROI – Return on Investment RP – Retail Price
RR – Rate of Return
R&D – Research and Development VBA – Visual Basic for Applications
L
IST OFF
IGURESFigure 1 - Sources of Risk that affect Profit (adapted from (Hawawini & Viallet, 2015)) ... 16
Figure 2 – Type of technology, considering position in the market and its innovation interest (Jolly, 2003) ... 17
Figure 3 – “Black Hole” Investment Strategies, retrieved from (McGrath, 2010) ... 24
Figure 4 – Most important decisions, regarding investment amount, risk level and ROI period (own source) ... 25
Figure 5 – Investment appraisal logical process (Ekanem, 2005) ... 27
Figure 6 – Management models in investment appraisal (Carr et al., 2010) ... 30
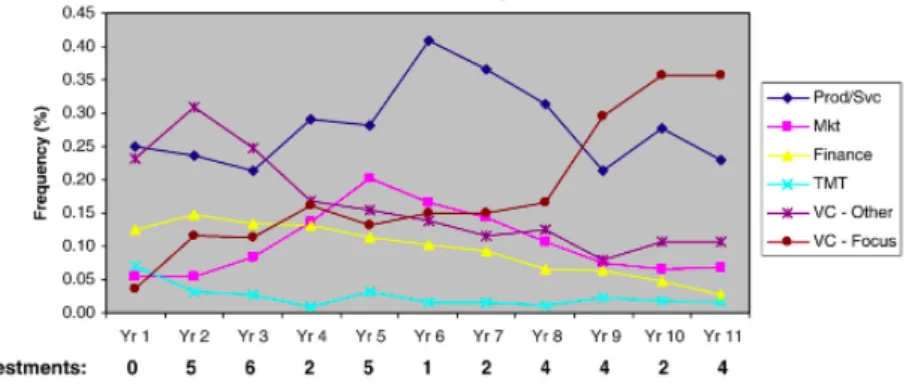
Figure 7 – Reasons for rejecting an investment in relation to the number of years and investments (Petty & Gruber, 2011) ... 30
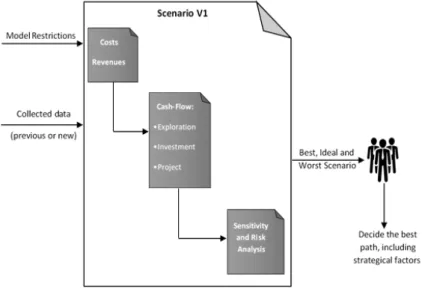
Figure 8 – FINECON Model usage in one scenario situation (own source) ... 40
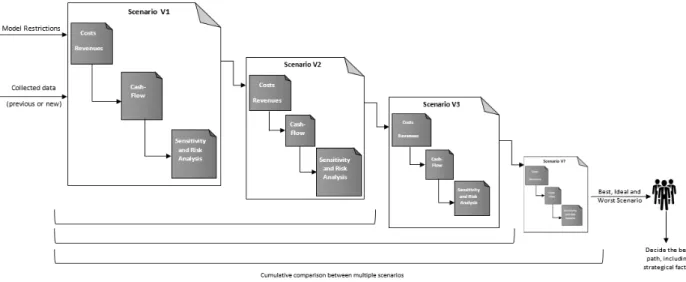
Figure 9 - FINECON Model usage in multiple scenario situation (own source) ... 41
Figure 10 - SAE Front-end and the Mobile app ... 49
Figure 11 – Market growth forecasting ... 51
Figure 12 –SWOT Analysis ... 52
Figure 13 – Yearly Costs on a 10-year forecast ... 56
Figure 14 - Sales Forecast ... 56
Figure 15 – Headcount for a 10 year forecast period ... 57
Figure 16 – CF statement ... 57
Figure 17 – Tornado chart representation for sensitivity analysis ... 58
Figure 18 – Data Collection Techniques (Stevens, Lawrenz, & Sharp, 1993) ... 69
Figure 19 – Alternatives for Technology evaluation (own source) ... 70
Figure 20 - Alternatives for Business strategy and structure (own source) ... 70
Figure 21 - Alternatives for Resources planning (own source) ... 71
Figure 22 – Alternatives for financial decisions (own source) ... 71
Figure 23 – First phase using Brainstorming Technique ... 72
Figure 24 – Categorized Keywords into (A) and (B) ... 73
Figure 26 – Assumptions ... 74
Figure 25 – Home Page ... 74
Figure 27 – Costs ... 74
Figure 29 – Financial Charges ... 75
Figure 30 – Financial Sheet (CF Map) ... 75
Figure 31 – Financial Sheet (Balance Sheet) ... 75
Figure 32 – BOM of the HW for the MobiBUS’ solution ... 76
L
IST OFT
ABLESTable 1 –Financial ratios examples ... 14
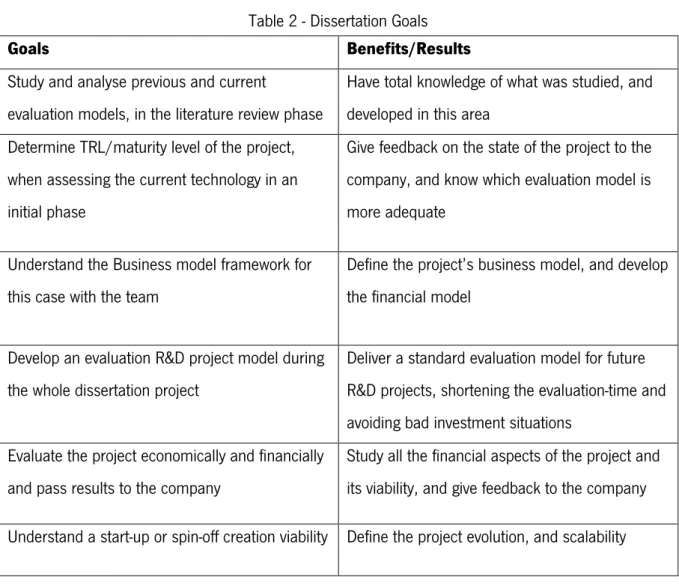
Table 2 - Dissertation Goals ... 35
Table 3 – Saunders’ research onion application (Saunders et al., 2009) ... 36
Table 4 – MobiBUS’ calculated retail price ... 53
Table 5 – 1st draft of solution’ cost, specifically physical, installation, software and structure. ... 77
Table 6 – Low-cost solution, specifically physical, installation, and software and structure. ... 78
Table 7 – Market risk values ... 80
1. I
NTRODUCTIONThis chapter is concerned with replying to questions such as what, why and how the research project was conducted. The what element is answered by the contextualization and problem statement; the why by the motivation; and the how by the objectives and methodologies and methods used. In general, the importance and relevance of economic and financial evaluations in Research and Development (R&D) projects in academic research and companies is stated.
1.1 Background and Context
Businesses are evolving continuously and unexpectedly due to the introduction of new technologies, the quick changes in the markets, the concept of short life cycle products, and the increased need for innovation. Organizations should be flexible and have the ability to adapt, react, and embrace changes, fulfil market requirements, and stand out from competitors. Additionally, the gap between customer demands and the products offered by the industry must be seen as an opportunity. (Costa, 2014; Elmquist & Masson, 2009; Pereira & Amaral, 2012)
In the digital-oriented world we live in, every now and then disruptive innovation is the order winner and a competitive advantage. This concept can be defined as coming up with a new idea or method that creates value, tangible or intangible, to organisations in the market, as well as recognising the good ideas that are already present (Burkus, 2013; Damanpour & Evan, 1984; Drucker, 2002; Kline & Rosenberg, 1986; Morris, Kuratko, & Covin, 2011). Nowadays, it is considered a competitive advantage or a driver for corporate success, and it is known for its serendipity, contrasting to the production perspective where every process is meticulously planned and measured (Teresko, 2008b). So, why does not everybody innovate?
Innovative technological ideas and projects are usually developed in R&D departments, enhancing the market positioning and perhaps the organizational culture (Spinesi & Tirelli, 2018). It requires diversified talents, cooperative, agile, experienced and very creative people, and stimulating work environments (Bougrain & Haudeville, 2002; Kuusisto, 2008; Neely & Rentocchini, 2012). These departments are characterised by high uncertainty conditions and a constant industry pressure to innovate (Knudsen & Scandizzo, 2002). Hence, the factors that influence the success of a R&D Project are: the organization, specifically the planning process, the team, the monitoring and feedback process; the market; the technology; and the environment (Friar & Balachandra, 1999; Pinto & Slevin, 1989).
When framed and aligned with the organizations’ strategic mission and vision, productivity can significantly increase by its existence. Strategic innovation can be defined as the reconceptualization of the applied business model and the intensification of the created value, focusing on the who (customers), what (product or service), and how (development and launching process). In general, a creator should be characterized by an absorptive capacity to persistently assimilate and transform knowledge (Anderson & Markides, 2007).
From a critical perspective, firms should detail their products or project financially, to plan and monitor investments, specifically previous and future ones (Gopalakrishnan & Damanpour, 1997). Goduscheit, Fallant, Poh, Ang & Bai (2018; 2001) stated that companies face difficulties in understanding the real value of an R&D project and its financial performance, as they are characterized by ideas and prototypes, that may be tested and in different maturity stages or technology-readiness levels (TRL). Consequently, R&D metrics should be defined, such as yearly or forecasted revenue sales and profit, number of patents and new products released, headcount, and so on (Teresko, 2008a).
On the other hand, another major problem is the validation of the investment in R&D, to prove their productivity and significance. In most cases, R&D projects have a limited budget that depends on the company’s capacity to raise investment and funding from crowdfunding, business angels, venture capital, bank loans, public financing, microcredit, and so on.
The common financial key performance indicators (KPI) for R&D are costs measures, revenue sales, projected value of R&D pipeline, and gross profit margin (Ojanen & Vuola, 2003). Ellis (1984) indicates that accountants see R&D mainly as an expense. However, it must be seen as an expenditure for a future return on a possibly risky or uncertain environment. Thus, the financial dimension should always be considered by the R&D management to constantly identify risks and evaluate profits and losses. R&D management can apply various models in project evaluation by using qualitative, semi-quantitative and quantitative techniques (Newton & Pearson, 1994; Rip, 2003). They can be divided into just eight categories (Augood, 1973; Baker, 1974; Poh et al., 2001): Research with experts, Simplistic, Benefit and Effectiveness Measurement models, Multi-Criteria analysis, Comparing analysis, Systemic methods, Programming models, Real Options approaches, and Economic and Financial analysis.
The last one is used to clarify, quantify and value all inputs and outputs, considering the time value of money. The model can integrate measures like: the payback period, the rate of return on investment (ROI), the EBITDA, or the weighted average cost of capital (WACC) (Knudsen & Scandizzo, 2002; Žižlavský, 2014); and financial approaches and concepts like the valuation model, Capital Asset Pricing
Model (CAPM), discounted cash-flows methods (DCF), specifically the traditional Net Present Value (NPV) and Internal Rate of Return (IRR), arbitrage pricing theory (APT) (Cochran, Pyle, Greene, Clymer, & Bender, 1971; Perlitz, Peske, & Schrank, 2003; Pries, Åstebro, & Obeidi, 2001). Additionally, this analysis type allows the definition of relevant multiple scenarios, following a “what if” principle to decide which is the best one. Finally, a complete economic and financial study must incorporate a risk and sensitivity analysis, whereby the most common technique is the Monte Carlo Simulation. From an industrial perspective, there are some models and excel structures already in practice like the European Commission recommended approaches, the Institute for Competitiveness and Innovation (IAPMEI) model, from business and management schools, or experts in the area.
All the evaluation models vary according to the different analysis approaches and not only on the inputted financial information. Nevertheless, these models still have some problems as to their complexity and inadequacy, the lack of input data, and the absence of a standardized, complete, and customizable model with adequate KPIs (Geisler, 1994). Furthermore, a survey answered by 205 firms corroborated that 20% of them had better results when using more than one evaluation model type (Coldrick, Lawson, Ivey, & Lockwood, 2002). Also, 60% of the companies from a survey in 2014 stated that they definitely use between two or three valuation methods to evaluate investment projects, for example the discounted cash-flow, the net present value, the discount rate input, and so on (Bancel & Mittoo, 2014).
The Four-Validation Model, exposed in an article written by Afonso and Fernandes (2018), is applicable in the development and evaluation of an idea and contains four phases: the value proposition formulation, market analysis, business model development, and an economic and financial viability study. It can be strongly concluded that there is no standard way to evaluate a project accurately and adequately. However, investments can sometimes go wrong, even when products and the associated business model look feasible and is correctly evaluated.
The evaluation process, also called the investment appraisal, can deliver detailed and clear financial results that, triggered by effective market penetration, can more easily attract investors, by reaching important decisions, based on an idea the creator has to stablish a new venture, in other words creating a start-up or spin-off. In these cases, financial stability is the second most important aspect to its growth (Rodrigues Parracho, 2017).
In conclusion, success can be determined by specific criteria and evaluation models, which do not yet fulfil all companies’ and entrepreneurs’ needs. If the project and its products are transformed into industrialized and mass-producible ones, it is important to be aware of the financial current and future
status. According to Sievanen, Suomala & Paranko (2003), 20% of the most profitable products, that represent the majority of the business, “generate more than 150% of the profits and 50% of the net sales”, which can be affected by the type of product, life cycle, after sales support, and so on.
1.2 Motivation and Objective
According to the R&D Funding Magazine (2019), there are considerable aspects about R&D:
• From 2015 to 2018, significant improvements were identified, and R&D is becoming even more successful and important for industries.
• In 2019, 2.3 trillion USD were spent on the global R&D gross domestic product (GDP). Additionally, the business enterprise sector represents 65% of the gross expenditure on R&D (Eurostat, 2019), and service business models achieved two-thirds of the global economy’ GDP (O’Cass & Wetzels, 2018).
• The Information & Communications Technologies (ICT) sector has the highest share in R&D spending, reaching 239 billion USD. Its future technological trends involve Big Data, Cloud Computing, and Advanced Analytics, and 89% of the respondents stated that it will continue thus. • Half of the respondents of the survey answered that they have difficulties in defining and keeping to the budget, due to market changes, insufficient investment and high costs, qualified human capital needs, and restrictive corporate policies.
Countries that continuously invest over and over, establish a good framework of science and technology, motivate people to act, and have the ability to create new innovations. Currently, the Portuguese entrepreneurial ecosystem has been growing and start-ups represent 1,1% of the national GDP1. Entrepreneurship is considered to be a meta-economic event, as it considerably influences and changes the economy (Drucker, 2002).
The opportunities for the acceleration, incubation, and investment in ideas or R&D projects are rising. In 2018, start-ups have created more 25,084 jobs in Portugal. Companies that challenge themselves are the most distinctive and competitive ones, as well as possible leaders in the industry (Barbosa, 2019; Castro, 2017).
Evaluating an R&D project can be challenging for firms in aspects like (Capron, 1992; Hall & Lerner, 2010; Shane, 2008; Spinesi & Tirelli, 2018):
1 Retrieved from https://eco.sapo.pt/2019/07/26/startups-ja-representam-11-do-pib-portugues/. Accessed in 26th of July
• Input and output definition and accuracy, related to data availability and the cost-detailing process • Hypothetically define business capacity according to the innovation process and market demand • Budget definition
• Price formation, in particular for unformed markets
• Need to forecast and the constant unpredictability and riskiness
• Uncertain nature of innovation and the dependence on technological and economic development • Time difference between the investment moment and the real economic impact
• Time-consuming decisions between multiple scenarios.
In spite of that, the opportunity gap is clear and the specification of a research question and its methodology is crucial in any research project (Yin, 2003). Considering the knowledge areas of economics, finance, accounting and business, the general research question of this research project is “How can organizations evaluate R&D projects economically and financially and take decisions in an early phase to avoid unsuccessful investments?”.
Regardless of what drives this research project, a sine qua non for the development of any R&D project is a goal-setting approach. So, this study aims to develop an economic and financial evaluation model for R&D projects, based on a current literature review, and apply it to a case study in the Engineering Department of Bosch Car Multimedia Portugal S.A.
1.3 Research Methodology
According to Saunders, Lewis & Thornhill (2009), research means that data is collected and interpreted with a clear purpose, using a number of specific methods and methodologies systematically (Ghauri & Gronhaug, 2005). The research followed a pragmatic philosophy, and a deductive approach, as the economic and financial evaluation model and respective analysis framework is developed based on relevant literature review in the afore-mentioned knowledge areas, and then it is applied to a single case-situation (Saunders et al., 2009).
The academic work is framed in a cross-sectional horizon, in the same organization with time constraints, using multi-methods with qualitative and quantitative data collection and analysis. The main data collection and analysis tool will be the Excel software, and the included VBA Macros (to create an automatic model and simplify the task of evaluating business ideas or R&D projects).
The work was developed using Scrum, an agile project framework to manage its progress considering the organization and the academic perspectives. The implementation of this framework enables tasks to be completed in a straight forward manner, to prioritize tasks, keep track of the completed work or work still
in progress, and monitor and prepare for possible risks (Rubin, 2013). Additionally, Scrum can contribute financially by reducing the possibility of risks, due to increments in productivity, product quality and customer satisfaction. In this case, it is important as the idea can result in the creation of a new venture.
1.4 Dissertation Structure
This document is divided into three parts, and seven subsections in total. First, the introductory part, where the dissertation organization and literature is presented. Secondly, the development, where an economic evaluation model is developed and applied to a case study. Finally, the third one with the main findings and conclusions, including recommendations for future research.
This first part includes the following chapters:
• Chapter 1 introduces the main issues of the research, states its Framework and chosen Problem, mentions the Methodologies and Methods used, and its work steps and structure. • Chapter 2 presents the State of the Art. In order to gain significant knowledge regarding the
main topics of the research, the literature was reviewed, focusing on the main findings and research opportunity gaps. The mentioned study fields were the economic evaluation models, in particular their characteristics and limitations; the decision-making process explaining every possible option an entrepreneur has while developing a business idea; and which opportunity gaps are most present in this academic knowledge field.
• Chapter 3 describes and explains the Research Methodologies and the Design for the chosen research process providing more reliability to the study, and the work steps.
The second part includes the following sections:
• Chapter 4 presents the economic and financial evaluation model structure developed for R&D projects, its assumptions, and structure.
• Chapter 5 reports the environment of the case study, specifically the company and how the case study was structured. Afterwards, it describes the business and the financial plan, where the application of the proposed economic and financial evaluation model is explained.
The third part includes the following sections:
• Chapter 6 presents the importance of the research outcomes and findings for the academic work, the R&D project, and the organization, and its relation to the research question and goals. • Chapter 7 concludes the whole research project in terms of meeting its goals, advances for the literature, problems encountered, for example strengths, weaknesses and limitations, key outcomes and recommendations for future research opportunities.
2. L
ITERATURER
EVIEWThe literature review is crucial to set the research in a specific context and define its importance, which will also reveal the research opportunity. The referenced topics are: the developed and commonly used evaluation models that support entrepreneurs and organizations, more specifically their characteristics, limitations and future research opportunities; and an overview of the decisions when developing a new business idea.
2.1 Investment appraisal: approaches and models
Investment appraisal is a process that may occur at an ex ante, ongoing or ex post stage. The first one allows the team to select and check what the most viable options are. The second one aims to monitor and guide a project while it is being developed and the research is being carried out. The third one analyses the results of the project according to the business and the project’s strategic plan. During the three previous stages, the evaluation model can provide information regarding the forecast, the ideal path of the project and its economic impact (Capron, 1992; Fernandes, Perobelli, & Brandão, 2014). There is no standard way to define the evaluation of a product, project or a business. Firms use several “financial analysis methods for screening and evaluation”, different criteria, types of resources and budgeting programmes. Even if the company has one or more projects in hand, the evaluation models use quantitative, qualitative or both techniques, financial indices, comparison methods, and other stochastic and mathematical models (Chien, 2002).
Additionally, these decisions are taken after collecting and estimating data, formulating hypotheses and alternatives, defining limitations and criteria, applying the most adequate model, and, when required, repeating the previous steps with updated information iteratively. Consequently, there exist some problems regarding the estimations due to (Baker, 1974):
• Technical, commercial and economic accomplishment uncertainty • Large errors in initial stages
• Completion time depending on resources availability • Possibility to scale business
• Uncertain and frequent investment rounds
The difference between all methods are the type of data, economic and social point impact, way of calculation, considered parameters, and the optimal result or financial indicator. The opportunity cost of the investment, the risk, uncertainty of future costs, the scenario’s flexibility or possibility for an economy of scale, all impact the decision to invest or not (Dixit & Pindyck, 1994).
The suitable criteria for these evaluation models are multiple simultaneous scenarios with objectives and constraints; timing; resources limitations, risky and uncertain conditions, scaling opportunities, and different analysis techniques such as optimization, simulation, scheduling, and prioritisation.
Furthermore, the existing models do not consider all the parameters of R&D: information can be too subjective, and the idea development and business growth is “uncertain and unpredictable”. Managers tend to neglect risks and adopt an overoptimistic position when they are deeply involved. The Go/Kill moments can go wrong as teams fail to value all data and its financial results from the current models. So, R&D projects tend to grow outside the core business or even the company.
The following subsubsections from the 2.1.1 to 2.1.9 explain succinctly the main approaches on a quantitative perspective, qualitative or both, going from more simple methods like research with experts to economic evaluations and risk analyses. Afterwards, possible financial ratios, industry applied tools and sensitivity and risk analysis techniques are detailed. 2.1.12
2.1.1 Research with experts
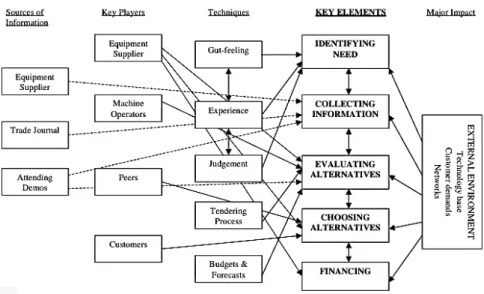
The first step to take, in order to collect and assess raw data, is talking and research in the field. Interviewing shareholders, possible investors, network contacts, current and future clients, the team and its managers, enables decisions to be taken straightforwardly. The most adequate methodologies used in research are systematic assessments by peers, relevant and concise questionnaires, and interviews with a number of experts, written in a standardized way. Also, researchers, analysts and managers can use the Delphi method, which is a regular and interactive communication method applied to structured groups (Capron, 1992). Besides, data collection can be done using several techniques presented in Appendix I – Data collection techniques for evaluation proceedings. Finally, teams should define the most adequate data collection form, plan and analysis methods.
2.1.2 Simplistic models
Taking a simplistic and qualitative perspective (Augood, 1973), managers can use checklists, which can be simple, using a short and clear list of elements and looking for an acceptable pattern; quantified, by assigning weight to every element and evaluating success percentage from a scale of 100; or in an acceptable profile, with a common set of elements for different business’ categories, comparing various
projects portfolios. However, these methods can seem difficult if engineers are required to work with such subjective data.
2.1.3 Benefit and Effectiveness Measurement models
Cost-Benefit Analysis (CBA) allows the decision whether to undertake a project. The team initially defines goals, different scenarios and its constraints. Then, they identify economic and social benefits/costs for the society from market behaviours and human capital experience, and measure or estimate statistically or by a priori judgment. Teams consider a monetary decision unit. When applying CBA, managers can define decision criteria and assign values for each option. Afterwards, they are able to analyse risk and uncertainty if necessary. Finally, they choose the best alternative by filtering the accepted ones and then choosing the best one2. For that reason, the ratio between benefit and cost is an indicator that should be maximized and allows the comparison of two or more alternatives (Davies, 1996; Neufville, 2008). Secondly, cost-minimisation analysis (CMA) is used for businesses where the impact is the same and the only dependent variables are costs.
2.1.4 Multi-criteria analysis
The multi-criteria analysis (MCA) assigns weight to the project’s criteria, both qualitative and quantitative, transforms their utilities into measurable values, scores their performance in different parameters, ranks options by their final value and chooses the best one. These types of methods can be integrated into computing programs for graphic creation and better decision support (Shvetsova, Rodionova, & Epstein, 2018). For projects evaluated between 5 and 20 million euros, the most adequate is the MCA, and for valuations higher than 20 million euros or innovative projects with future great operational costs, managers should apply CBA techniques, previously explained.
Finally, the analytic hierarchy process (AHP) assigns a specific weight for different options, according to its importance and priority in a matrix. Afterwards, the best alternatives are ranked in each criterion and teams take a decision for what is best for the project (Saaty, 1980).
2.1.5 Comparing analysis
A project can be evaluated for different alternatives related to costs such as: location, suppliers, raw materials, technology, design, project planning, investment requirements, timing, working capital, and so
2 Retrieved from https://www.tcd.ie/Economics/assets/pdf/MScEPS/Economic%20Evaluation/evaluationLecture3MC.pdf.
on. On the other hand, the other factors can be the level of output, quality, prices, time to market and its scope. These allow that, in an initial stage, analysts can test the options at hand and see what the best preliminary results for the project are. While estimating all these scenarios regarding costs and benefits, the team can forecast qualitatively and quantitatively, and compare each option. Also, these analyses enable the filtering of what the most favourable path should be.
The solely comparative methods are the decision tree analysis allowing managers to choose an optimal solution between different quantifiable scenarios, like the development of interdependence matrices with identified interactions between the weighted attributes of each project’s phase, resulting in a final desirability index (Mohantyy, Agarwalz, Choudhuryz, & Tiwari, 2005).
Additionally, the scoring model includes matrix approaches, such as analysis matrices for the economic impact, and decision-making matrices, when sorting alternatives by criteria, and evaluating the correlation between the results and data from experts (Baker, 1974).
2.1.6 Systemic models
In general, these kinds of methods systemically analyse the available options, evaluate selected ones, determine control points, and dynamically model all the variables and their values, considering economic terms and components from their environment.
A commonly-used systemic model is the continuous-time stochastic, which combines dynamics with uncertainty and determines the probability distribution of future stages and not the value (Rafiee & Kianfar, 2011). As an extension, there exists the theory of investment-Brownian motion, which can analyse the random behaviour of financial markets over time, and the Poisson-process to detect the variation pattern for a number of alternatives, for example headcount or sales increase and associated variables (Dixit & Pindyck, 1994).
2.1.7 Programming models
These programming models are function and probabilities-based algorithms, which vary from having one main goal if using mathematical programming techniques, or simultaneously many for multi-objective programming. The first ones relate to evaluations with reliable and sufficient data. The second ones may include stochastic criteria to view several solutions, considering uncertainty, as well as specific resources, criteria, and budget. When applied, the team seeks the maximization of the expected return or the efficient assignment of resources (Graves & Ringuest, 2003). There exist several programming techniques for project’ selection (Chien, 2002; Levine, 2005):
- Linear or non-linear - used for optimal resource allocation and project selection, considering constraints and limitations of the project. The final result is obtained by summing up all contributions to the projects.
- Integer – is a subdivision of linear/non-linear programming, although variables should only be integers. The zero-one model is a deviation of the integer programming where variables can only have values between 0 and 1
- Dynamic – refers to the technique of dividing a problem into smaller ones, and taking a decision at a time
- Goal – is a multi-objective optimization, guided according to the analyst’s main goals.
2.1.8 Real Options Approaches
Managers tend to find problems in the information regarding budgets, operational efficiency, and financial payoffs, and in deciding whether to buy or sell an asset, hypothetically.
The real-options model allows the investment’s evaluation and application in several stages and the determination of the best improvements for the project, like abandoning, expanding, contracting, for example. This model involves dynamic programming with probability and final payoff for every option, considering different stages and variabilities in a business. This evaluation process is more adequate for the ones with risky, uncertain and flexible conditions, such as development costs and time, performance level, market requirements and payoff. However it cannot evaluate projects simultaneously (Fernandes et al., 2014; Huchzermeier & Loch, 2001).
Using a real-option approach, Silva and Santiago (2009) developed a model where the project’s duration is uncertain. The model uses Markov stochastic principles for time, considers risks and evaluates the business performance for every stage. The team can decide if they want to continue, improve with more resources, abandon the project, or accelerate with more resources but completing the plan earlier, in every finished phase and not just periodically.
The option-pricing theory, similar to the real-options approach, calculates the fair value of the option using stock price, adequate price of option, end date of the solution, expected dividends, risk free interest rate, and volatility. The fair value depends on a professional’s perspective and assumptions whereas the market price is mainly dictated by supply and demand, as well as other pricing factors (Mondher, 2002; Newton & Pearson, 1994).
Finally, there are other pricing models such as the binomial option pricing model, which is a tree of priced alternatives with individual probabilities and using a risk-free rate during a specific time period (Neves,
2014; Perlitz et al., 2003), and the Black-Scholes-Merton pricing model, which allows the valuation of an asset and its price variation, considering a constant volatility and risk-free rate as well as the non-payment of dividends (Black & Scholes, 1973).
2.1.9 Economic and Financial Analysis
In order to identify the real value of the project, and choose the most beneficial or less costly project, one or more projects in hand can be economically and financially evaluated. An economic and financial evaluation uses CF concepts and an/the NPV model with a decision-tree. These evaluations can be done at a micro, using internal data; meso, that is industry and market data; and macro level, specifically the economic situation and its variables as well as the state of R&D, depending on the required level of detail and interdependence (Capron, 1992).
On one hand, an economic evaluation analyses the project in a broader perspective, regionally or nationally, and considers the impact that it might have on society, referring to the effects on the economy. This type of evaluation considers the economic and shadow prices without transfer payments (taxes, profits, subsidies, and others), to view the adaptability of the project in a national environment3. Moreover, an economic price is the price customers can afford and a shadow price is the actual market or intrinsic value of a product/service that is not normally priced or sold in the market.
A project economic analysis contemplates the following steps4: validation of the economic context and principles, particularly the macro context, sector analysis, rationale for Public Sector Involvement, and choice of modality; and the project’s viability, specifically the demand and alternative analysis, valuation of benefits and costs, institutional sustainability, distribution and sensitivity analysis, and monitoring and evaluation.
On the other hand, a financial evaluation is a fund-based method which compares the sustainability and balance of an investment, using market prices. This method is concerned with the profitability for stakeholders (Davies, 1996; Ferreira, 2016; Hayes, 2019).
To conclude, the difference is that costs and outputs are valued financially and then adapted for the economic perspective, considering government intervention, the market structure and opportunity costs of resource usage. Although a project might not be financially sustainable, it can be economically viable due to the way government funds are allocated.
3 Retrieved from https://www.adb.org/sites/default/files/page/149401/financial-analysis-economic-analysis-2006.pdf.
Accessed in 14th of May 2019.
4 Retrieved from https://www.adb.org/sites/default/files/page/149401/economic-analysis-projects-principles-concepts-2006.pdf. Accessed in 14th of May 2019.
For a more clearer financial demonstration, engineers develop an investment, exploration, and financing plan (Ferreira, 2016). The first one describes the value and time of the received investments. The second one, also an income statement, presents the expected revenues and costs. The last one describes how the project will be financed in the short or long-term.
2.1.10 Economic evaluation tools and models applied in the industry
There are numerous economic and financial evaluation models as well as files in Excel to support these processes. The manager should decide whether he might create his own or not. However, the following models are common in the industry:
a) Investment’ Projects Evaluation Tool by IAPMEI
IAPMEI is an institution that supports micro, small, and medium firms and promotes Portuguese entrepreneurial competitiveness and growth5. They have developed a complete tool, in Excel, to evaluate investments in a 5- or 10-year perspective, using the Portuguese accounting regulations as well as the most common financial indicators, such as IRR, NPV6.
b) Manual from the European Commission for financial and economic analysis of development projects
This manual, developed by the Commission of the European Communities, delivers profound knowledge regarding the financial and accounting concepts and its application on these evaluations, the applied calculations, how the correlation between the national or international scale affects each project, techniques for financial and economical evaluation of a project, whether integrated in the firm or not, with tangible or intangible products, how to include risk and uncertainty in the evaluation process, how to assess an investment’ decision, and evaluate a project’s relevance. Last, this manual tells teams to consider: the payback period, NPV, IRR, the benefit-cost ratio, and the ROI, as well as sensitivity analysis for the evaluation of R&D projects. To sum up, this manual explains a methodology that should be followed when evaluating projects of any kind (Fabre & Jones, 1997).
Additionally, the European Commission provides the requirements, financial indicators, for example if it is financially autonomous or profitable, and the best practices to assess the project’s capacity and budget in order to apply for a grant for the Horizon 2020. Regarding the evaluation approaches and tools, there
5 Retrieved from https://www.iapmei.pt/SOBRE-O-IAPMEI/Missao-Visao-Valores.aspx. Accessed in 14th of August 2019. 6 Retrieved from https://www.iapmei.pt/PRODUTOS-E-SERVICOS/Assistencia-Tecnica-e-Formacao/Ferramentas/Ferramenta-de-Avaliacao-de-Projetos-de-Investiment.aspx. Accessed in 14th of August 2019.
are many possible ones to be used, both quantitative or qualitative, like the problem, effect or the decision diagram, interviews, focus group, survey, expert panel, case study, indicators, SWOT analysis, multi-criteria, cost effective, which is extensively explained for investment projects (European Commission, 2014; European Cooperation in Science & Technology, 2019), or even cultural and social analysis7. The overall results should be the budget inputs, direct and induced outputs, outcomes for the stakeholders, and the impact on the society. Finally, the European Commission has a financial self-check tool available to simulate the projects that seek investment8.
2.1.11 Additional financial ratios and methods
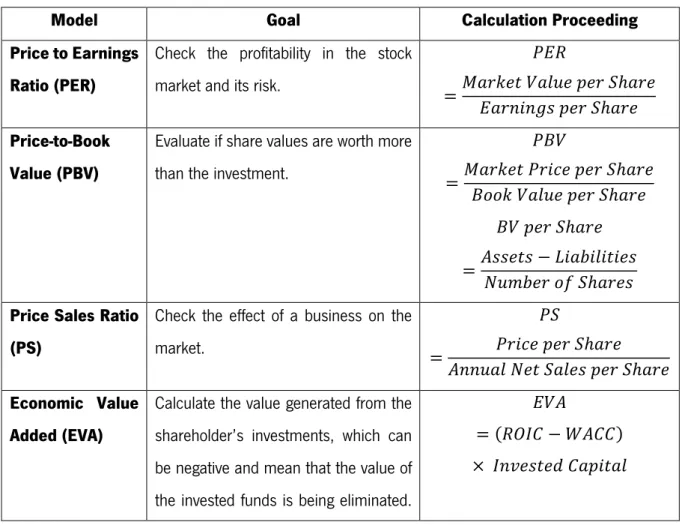
Business and financial analysts, and engineers use some financial ratios to easily assess a project’s viability, which are represented in Table 1 (Mondher, 2002; Neves, 2014).
Table 1 –Financial ratios examples
Model Goal Calculation Proceeding
Price to Earnings Ratio (PER)
Check the profitability in the stock market and its risk.
!"#
= %&'()* ,&-.) /)' 0ℎ&') "&'23245 /)' 0ℎ&') Price-to-Book
Value (PBV)
Evaluate if share values are worth more than the investment.
!6, =%&'()* !'37) /)' 0ℎ&') 688( ,&-.) /)' 0ℎ&') 6, /)' 0ℎ&') =955)*5 − ;3&<3-3*3)5 =.><)' 8? 0ℎ&')5 Price Sales Ratio
(PS)
Check the effect of a business on the market. !0 = !'37) /)' 0ℎ&') 922.&- =)* 0&-)5 /)' 0ℎ&') Economic Value Added (EVA)
Calculate the value generated from the shareholder’s investments, which can be negative and mean that the value of the invested funds is being eliminated.
",9
= (#ABC − D9CC) × B2G)5*)H C&/3*&-
7 Retrieved from https://europa.eu/capacity4dev/evaluation_guidelines/minisite/en-methodological-bases-and-approach/evaluation-tools. Accessed in 15th of October 2019.
This technique considers risk and the cost of capital.
Cash Value Added (CVA)
Analyse the return from an investor’s/shareholder’s perspective for a specific year. Additionally, this model integrates strategic investments for new products or markets, and considers non-strategic ones as costs.
C,9 = =)* A/)'&*382&- #)5.-* + J)/')73&*3825(C82*&<3-35*37 − "7828>37) − K5)H #)58.'7)5 × D9CC "7828>37 J)/')73&*382 =L3M)H &55)*5 × D9CC (9 + D9CC) − 1 Market Value Added (MVA)
Analyse the value created, considering
the investment and its market. %,9 = O
",9 (1 + D9CC) Karibskii, Shishorin, and Yurchenko (2003) discovered a method which combines four decisive financial indicators, namely NPV, IRR, Payback Period, and Profitability Index (PI), calculated by the Equation (1).
!B = !, 8? L.*.') CL B23*3&- B2G)5*>)2*
(1)
It is proposed that after one project or more are economically and financially evaluated with the previously mentioned models, each parameter has a specific weight and results on an economic efficiency value (E) combined with the optimal payback period (T). This integral index is calculated using the Equation (2).
P" = O(>QR× (=!, + B## + !B) S TUV ; Xℎ)') >QR = 5/)73?37 X)34ℎ*, &2H M = 0,1,2 \ = 8/*3>&- (2)
Dixit and Pindyck (1994) declare two further techniques: a comparison method between the per-period value of an incremental unit of capital and an equivalent per-period-rental price, or between the capitalized value of the marginal investment to its purchase cost.
Merton’s model (Mondher, 2002) is an analysis technique that evaluates the firm’s value and the cost of gathering, processing and delivering information. Furthermore, this model associates itself with CAPM and the securities equilibrium and market place is inexistent.
The mean-variance analysis helps to identify whether the project reaches the expected return-variance for the company compared with previous projects, aiming to maximize attractiveness, as the return, and minimize risk, as the variance.
A sensitivity analysis is the study of the impact when costs and benefits vary and the determination of which variables make the project reach NPV=0 or a required value of IRR or NPV. The variation of several factors, chosen in a subjective way and correlated or not, allows the calculation of a minimum RP (Conejos, 2016; Iooss & Saltelli, 2015). The process to carry out a sensitivity analysis begins with the selection of variables and its variation extension, and the determination of the effect in NPV and IRR (Asian Development Bank, 2017).
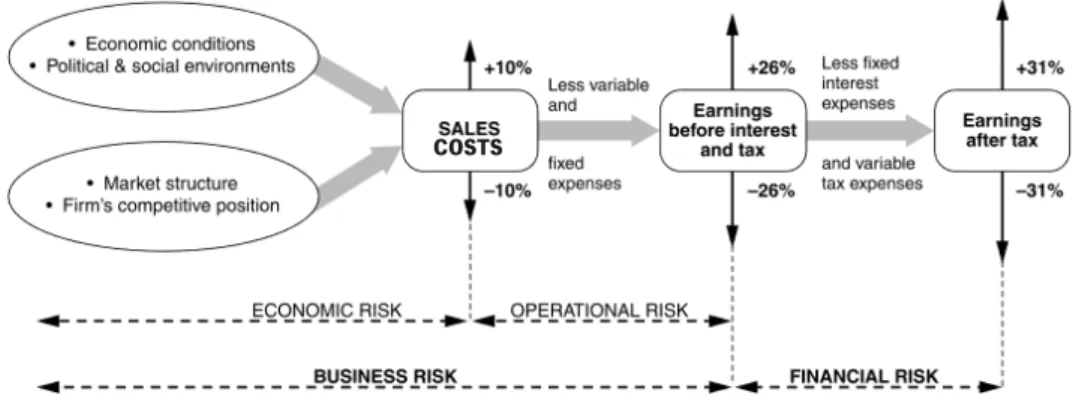
Any project has an associated risk/uncertainty, directly affecting the MARR. Risk is related to new technologies, high up-front investments, economic instability, and others, caused by internal or external factors, and risk sources represented in Figure 1.
Figure 1 - Sources of Risk that affect Profit (adapted from (Hawawini & Viallet, 2015))
What differs a risk from a sensitivity analysis is that it estimates the probability weighted for NPV and the probability of IRR. A more basic process includes: identification, analysis, solution planning, and a monitoring and action plan.
For a more complex uncertainty analysis, an engineer should follow these steps: variables identification, establish probabilities distributions and their values, analysis-based values and parameters to estimate NPV and IRR, test and estimate final weighted probabilities of NPV and IRR. This proceeding is called Montecarlo Simulation software and is based on estimation processes and its best scenarios for these financial indicators and the analysis of the uncertainty distribution in certain parameters.
Consequently, it is possible to propose different scenarios for the project in hand, which delivers diverse results by changing important financial elements. Also, at this stage the analyst can study three scenarios: pessimistic, the one that does not meet the companies’ predictions; probable, realistic and similar to the previous one; and optimistic, when results are better than the previous ones. Also, these results are obtained using the previous factors or variables identified in the sensitivity analysis (Conejos, 2016).
2.2 Decision-making strategy
Economic and financial evaluation occurs when an idea, project or a venture needs to monitor its current state and determine its viability, or when entrepreneurs and their teams want to take decisions regarding it. That being said, there are several options on the table in those decision-taking moments, represented in Appendix II – Type of decisions to consider in an economic and financial evaluation, regarding four categories: technology, business, resources, and , when entrepreneurs ask this question: “What should I do when I have an idea or product?”. It is important to analyze the structuring of every aspect, specifically the technological characteristics, business strategy, and resources which will affect every cost element as well as the final result and financial indicators, from which the team deliberates its viability.
2.2.1 Technology Evaluation
In an initial stage, the team should evaluate the technology to analyze its current and future state, as well as its opportunity gap. Every decision can be postponed or used to give feedback about the need to pivot, in other words, significantly change strategy.
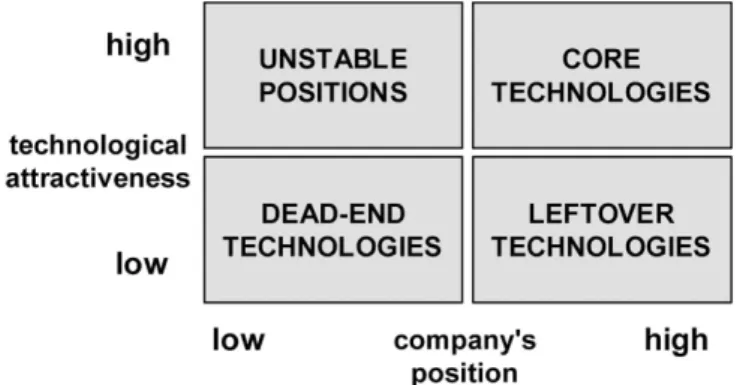
The first phase allows an initial evaluation of the state of the technology, specifically its feasibility and level of maturity, according to the TRL scale. It is important to frame technology considering market position and innovation interest, according to Figure 2. Afterwards it is possible to understand the future status of the R&D process, whether it should carry on or not, considering all proposed features for the MVP.
Figure 2 – Type of technology, considering position in the market and its innovation interest (Jolly, 2003)
The second stage pertains to the technology supply, as it can either be made internally, specified further in the Planning required resources section, or bought, which can also be internally or externally depending on the company. When the technology is acquired externally, it means that the team buys
technology from another firm without their support. In this situation, the team can reduce costs when the firm needs to build or improve their infrastructure in order to produce that specific technology with the required features and quality level. Also, externally acquiring can allow easier absorption of know-how and innovation. It is said that it is more productive and profitable when companies combine a make and buy approach. Critical factors for success can be delivery lead time for the supplier and their own company, integrating complexity into activities (Cassiman & Veugelers, 2002).
Next, the team or the allocated business/financial analyst should analyze the type of technology used. If it relates to a hardware solution, the bill of materials (BOM) can be kept or changed. If it relates to a software solution, the technological infrastructure can also be changed or maintained. These adjustments could force the need for more investment, as there might be added costs, possibly outside of the budget plan, that can impose limits to future development.
The fourth point concerns the enforcement of intellectual property over ideas, technology, designs, and inventions, which is a given right in a specific country over the product from the designated legal entity or institute of the team or the entrepreneur. In other words, the inventor can legally preventother entrepreneurs or firms from stealing and using its creation, although if necessary, the rights can be retrieved from the owner (Barros, 2016; Carmichael, Whittington, & Graham, 2007; Dixit & Pindyck, 1994). Registered intellectual properties (IP) are frequently required in R&D environments or when creating a startup. Also, an IP can be defined as a:
• Patent, which is an exclusive right for 20 years on an invention that includes descriptive technical information regarding the product, preventing situations where others make, use, distribute, import or commercialize it without their consent.
• Copyright, that is a legal economic and moral right that creators have over their expressions, for example, computer programs, advertisements or databases.
• Trademark, in other words, an exclusive right for a company’s registered product or service to another enterprise, for example for a combination of words, letters, numerals or logotypes. These rights can last for 10 years.
The previously-shown types of IP can be associated with tangible assets, under confidentiality or employment agreements that protect data leakage.
Additionally, all types of IP can derive to licenses but, it is said that 75% of an idea is not commercially licensed or even disclosed. The ones who license have the tendency to acquire technology externally, transferring knowledge bidirectionally.
When the research environment is at universities or in companies internally, it is easier to enable an idea and detain an ownership. Also, in these cases, almost 50% of the researchers, included in R&D in firms, started a business based on patents (Neely & Rentocchini, 2012).
In summary, a license is an agreement between two parties that allows the licensee to manage their goods or services with their consent. It can be regarded as a passive income of around 25% in royalties, as well as strategic benefits with more partnerships and business opportunities that might be created. Ventures start to depend on internal application and outward licensing (Lichtenthaler, 2010).
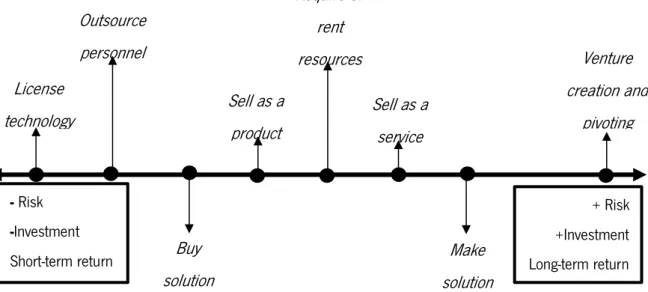
Finally, the fifth phase concerns the monetization of the developed technology regarding its patent, which might be blocked when there is no opportunity to integrate the solution with others, there are security and privacy obstacles, and there is not sufficient investment in enlarging the idea’s capacity (Capgemini Consulting, 2014). This phase is ideal for entrepreneurs to understand how they can translate hours of R&D and solutions into capital. Thus, entrepreneurs can either license the technology or sell the idea. Licensing an idea, the technology or a patent implies a full fee, for exclusive rights or royalties, which require the definition of the unit fee and the requested monetary amount. On the other hand, selling an idea can be a challenging decision due to the state of the patent that may be inexistent, approved, denied, or pending.
2.2.2 Business strategy outline and structure
The first step is tracing the future course, specifically deciding whether the team should continue or not with the idea or product, both depending on the project’s rate of success, financial return and the time it takes, expected value of the project, and required time for success. When the team decides to continue internally or externally from an internal perspective, entrepreneurs can either:
- Create and initiate an internal project, when the idea is in the championing or implementation stage, where the idea is approved and converted into a tangible outcome, after its initial elaboration. This direction helps to move things on and adds pressure to advance from an idea to commercialization, although they are dependent on the top-level managements’ decisions. Additionally, creating an internal project has its ups and downs, as it is said that 28% of IT projects are successful, 75% miss deadlines, 55% exceed their budgets and 37% do not meet project requirements (Perry-smith & Mannucci, 2017; Shenhar & Dvir, 2007).
- Create a new business unit, that has strategic plans with specific KPIs both tangible and intangible, which can be assessed separately and compared to other business units if required, deciding whether it generates value or not. It is said that it is easier to look backward and not
forward as it requires more critical thinking and forecasting data, in hypothetical and uncertain scenarios. Also, the establishment of a business unit should be aligned with the enterprise’s goals, and have a clear focus on what segment of its stakeholders it targets, in other words what customer value proposition it focuses on. Strategic business units make the team more organized and efficient, help to focus on what is important for them, support segmented, targeted, and well-positioned development, and might get faster and bigger investments due to their specialization. To sum up, these units will increase customer satisfaction and the overall profitability of the business (Marr, 2006).
From an external perspective, the entrepreneur can (Pride, 2018; Tübke, 2005):
- Create a start-up, which is a decision with high risk for every shareholder involved, and where costs should be kept to a minimum in the beginning. Start-ups, framed in an unstable environment, are like a black box, where decisions are taken but, despite the team’s caution and experience, the outcome can never be predicted. Nowadays, about three start-ups are every second, but 92% of them fail three years later, and 50% after five years. Capital support is becoming more difficult to acquire as experienced investors are more conscious in a germinal phase whether the idea is good or not. To conclude, it is said that a start-up usually starts to be profitable in the third year of operations. Entrepreneurs tend to make bad decisions and rush the normal process of a venture creation, as they truly believe in their product. Start-ups as spin-offs need time to evolve and mature, and their main success factors are: opportunity, individuals, in other words, experience and industry, sociological factors, founding team, motivation, a business strategy plan and available investment.
- Create a spin-off, which is a decision to grow separately from the parent-company but maintain their support, for examples in cases where maintaining the alliance is more beneficial than giving total control. The main goal is to refocus their strategies, increase the shareholder input value and gain access easily to targeted investment. The main success factors are similar to start-ups: motivation, organisation structure, and business activity.
- Merge or join ventures, which is a strategic alliance of two or more entities to be able to access the following benefits: cost reduction, share of markets, IP, assets and knowledge, and the number of clients and partners’ increase in their portfolio. This action does not constitute a legal entity, but allows them to expand into larger markets. The success factors of joint ventures can be described as: independent structural independence, adaptive business strategy, existence of conflicts of interests, team motivation, and the flexibility of both entities.
When the team decides to stop, they can choose any of these alternatives (McCardle, Tsetlin, & Winkler, 2018):
- Giving up on the idea should occur when the entrepreneurs are facing the following situations: the marketplace is too crowded, and the entrepreneur is not ready to pivot the current idea, there is no passion left in the team regarding the solution’s purpose and the path the business might take, and the demand is inexistent, over-optimistic or still taking too long. However, there is no precise method to evaluate whether this decision is the best one. That being said, all ideas are valuable, just requiring additional development, time and expert support, the place or time might not be adequate, and the entrepreneur might not be the right person.
- Abandon the project, from which companies can benefit more than continuing with it despite the previous investments made. It can become a difficult decision when there are already stablished client alliances and partnerships with other ventures, which can be taken considering KPIs like market share and profits reduction. This can happen due to inabilities to invest more or where there are other more interesting and profitable projects at hand.
- Deliver their idea to another project, which happens when the idea can be framed in a planned or on-going project, and their team has the right resources and is better prepared for its development or when the idea/solution passes on from the innovation to the executive team, or business unit, when the idea does not frame the strategies of the location where the project is being developed and the team is not prepared for this type of project, for example.
- Close the Business, considered as an exit strategy that needs the consent of all shareholders, including owners and partners, and requires certain steps like completing dissolution documentation, cancelling IP rights, applying labor laws, resolving financial obligations like taxes, and keeping all the financial records.
- Sell the business, by valuing the enterprise considering the past income, market state, in other words, other businesses and held assets.
- Transfer ownership, specifically the business shares, from individuals who own percentages of the firm, and stakes, from individuals who own percentage of stock involved. These decisions can involve an immediate transfer, gradual, or temporarily through a lease.
The second step is to draw up a business model (BM). It is essential that all stakeholders adequately plan and, if necessary, follow disruptive strategic approaches. However,, it is beneficial that the BM is done by an individual experienced in the area, as theoretical knowledge is insufficient to project or likely to generate a proper and successful business model for the venture in hand. These drafts are part of a
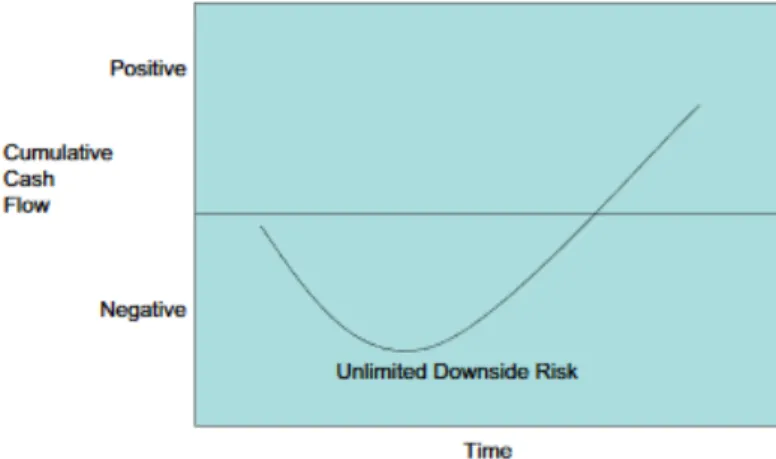
try-fail process, in order to create the most detailed and suitable BM. In order to develop the best BM for this solution, the team should (McGrath, 2010):
- Decide the most adequate channels, specifically whether the product or service is going to be promoted and commercialized directly from the producer to the client, or through intermediaries, for example using sales agents or other firms.
- Define the revenue model, in order to understand how the company is going to monetize the solution, how it is going to make a profit and if so how much.
o Initially, it is important to decide whether the solution will be sold as a product or service, and its revenue acquisition strategy. It is said that more than 70% organizations do not have the capability to generate service revenues from their solutions.
o Set price, which will dictate the clients’ acquisition rate. Furthermore, the individual accountable for these decisions should specify whether they require a short- or long-term strategy, whether any type of discount will be applied, and, finally, what the final retail price will be. In addition, the price in general will be established according to units of business, for example a pay-as-you-go, one-time, pay-for-results, freemium, or subscription approach.
This second option might take time that is valuable for development, and does not include information specifically requested by certain stakeholders. Also, it involves certain problems that might affect its success: like the need to focus on the value proposition of the solution, technology development level, overvalue the need to reduce costs, globalization, complexity, innovation, strategy and management, and funding resources availability.
The third step concerns elaborating the market plan, with previous market/ industry research. The most important decisions to take are the definition, maintenance or changes of the market segment, and delineation of an adequate and pervasive market strategy that will create more impact among clients. The first concerns defining what is the target audience and its boundaries to a more effective enterprise, and decide if the team wants to scale the business or limit its size.
The second one involves a market strategy, like postponing, entering or exiting, in other words, launching the solution/product onto the market. The launch initially involves a testing phase, after the business plan elaboration. However, this moment allows the company to get the first results, like number of sales, revenue volume, and units sold. The first released version, the dev, is for early adopters that are interested in giving feedback, for example for requirements analysis and tests of software functionalities, and design. Afterwards, there is an alpha and beta release with acceptance and usability testing. The majority of these