Design of the austempering heat treatment of a ductile iron
differential case aided by computer simulation
Abstract
Austempered ductile iron is frequently employed in the fabrication of au-tomobile parts due to its good mechanical properties, and its simplicity and low cost of the manufacturing process. The heat treatment design is an im-portant stage, in which parameters such as temperatures and durations are chosen according to the required microstructure, part dimension, and ini-tial characteristics of ductile iron. A coupled thermo-mechanical-metallurgical model is employed in this work to facilitate the heat treat-ment design of a ductile iron differential case. The thermal-mechanical model is solved by using a general-purpose software, and the metallurgical model is implemented into it by means of user-defined subroutines. To perform the austempering heat treatment simulation of the part, experi-mental results were required to complete some basic parameters of the model. In order to select appropriated values of thermal cycle parameters, the numerical model was employed to analyze the influence of austenitiz-ing temperature, and austemperaustenitiz-ing time and temperature in the micro-structure, dimensional change of the part, cooling rate, and minimum re-quired time of the heat treatment to obtain a full ausferritic matrix. A good performance of the computational tool was found by comparison of numer-ical and experimental results.
Keywords
Ductile iron differential case, Austempering heat treatment design, Ther-mo-mechanical-metallurgical analysis, Finite element analysis.
1 INTRODUCTION
Austempered Ductile Iron (ADI) is a Fe-C-Si alloy that is frequently used in powertrain and suspension sys-tems of automobiles due to its good mechanical properties, such as
900 1600
MPa
tensile strength,650 1300
MPa
yield strength,1 9 %
elongation,20 100
J
impact energy, and269 512
HBW
hardness (ASTM A 897M-03, 2003). There are also advantages in the manufacturing process to obtain parts having com-plex shapes (Gundlach and Janowak, 1983; Sorelmetal, 1998; Putman and Thomson, 2003; Mendez et al., 2015). In different types of automobile applications, ADI has been employed to replace cast steel (such as in a spring support), forged steel (ring gear, timing gear, pinion, crankshaft), and as-cast ductile iron (crankshaft), because this material allowed weight reduction and cost savings (Sorelmetal, 1998).The ADI microstructure is formed by graphite nodules embedded into an ausferritic matrix. The ausferritic matrix is composed by sheaves and austenite blocks, and each sheaf is formed by ferrite platelets and austenite films (Sorelmetal, 1998). Parts with this microstructure are commonly obtained by a three-step austempering heat treatment, which is performed in the best case scenario after the casting and machining processes are com-pleted. In the first step of this heat treatment the part is heated and kept at the austenitizing temperature (
T
).During the second step, the part is cooled and kept at the austempering temperature (
T
A). Finally, in the thirdstep the part is cooled to the ambient temperature (Fraś et al., 2012). The described thermal cycle is character-ized by the temperature and duration of the first (
t
) and second (t
A) steps (Sorelmetal, 1998).Adrián D. Boccardoa,b,*
Patricia M. Dardatib
Luis A. Godoya,c
Juan J. Lopensinob
aInstituto de Estudios Avanzados en Ingeniería y
Tecnología, IDIT, CONICET-Universidad Nacio-nal de Córdoba, Córdoba, Argentina. E-mail: [email protected]
bGrupo de Investigación y Desarrollo en
Me-cánica Aplicada, GIDMA, Facultad Regional Córdoba, Universidad Tecnológica Nacional, Córdoba, Argentina. E-mail: [email protected], [email protected]
cFacultad de Ciencias Exactas, Físicas y
Natura-les, Universidad Nacional de Córdoba, Córdoba, Argentina. E-mail: [email protected]
*Corresponding author
http://dx.doi.org/10.1590/1679-78254559
The heat treatment temperatures vary in the range of
850
C T
950
C
and250
C T
A450
C
, andthe chosen values depend on the desired final microstructure (Bosnjak et al., 2001; Yescas, 2003), which is closely related to the required values of mechanical properties. Appropriate values of
t
andt
A have to be chosen toobtain ADI parts with a full ausferritic matrix, which depend on some characteristics such as the initial micro-structure and chemical composition of ductile iron, and the geometry of the parts (Moncada and Sikora, 1996; Sosa et al., 2004; Sosa et al., 2009; Fraś et al., 2012).
The design process of heat treatment, which allows selecting the thermal cycle parameters, can be aided by numerical simulation, in order to reduce the number and complexity of experimental tests. Computational tools have been successfully employed in different problems of the automotive industry (Kokkula et al., 2006; Lee et al., 2016; Kong et al., 2016). However, this is not a simple problem and to perform an appropriate representation of the phenomena involved in the heat treatment, a coupled thermo-mechanical-metallurgical model is required. The thermal model should allow computation of the evolution of temperature in the part taking into account the latent heat at phase change, the mechanical model is required to compute the evolution of deformation due to temperature and phase changes, whereas the metallurgical model should predict the evolution of phases during the heat treatment development.
Only a few works are found in the literature that consider coupled models for the austempering heat treat-ment simulation. Yoo et al. (1999) proposed a thermo-metallurgical model to simulate the in-situ austempering heat treatment. The metallurgical model allows to predict a ferritic-pearlitic-ausferritic matrix at ambient tem-perature. The pearlitic and ausferritic transformations are modeled by means of Avrami equation; the model is difficult to employ because the parameters of the equation need to be fitted based on a large number of experi-ments. In the works of Pérez Villalobos et al. (2011) and Hepp et al. (2012), the modeling of the austempering heat treatment of ADI parts was presented. Even though the models employed in these works predict the evolu-tions of temperature and phases in a part, they do not consider microstructural features such as the shape and size of phases and the chemical composition of phases. Moreover, information regarding model application, such as part modeling (initial and boundary conditions, domain discretization) and metallurgical model setting (em-ployed data base or fitting technique) is rather scarce. Boccardo et al. (2017b) proposed a thermo-mechanical-metallurgical model for the three-step austempering heat treatment, considering the reverse eutectoid, ausferrit-ic, and martensitic transformations; the modeling involved the microscale in order to consider the microstructure features of the ductile iron, such as graphite nodule size, shape and dimension of the growing phases, heterogene-ous carbon concentration within the matrix, among others. This model allows predicting a final martensitic-ausferritic matrix and the final dimensional change of the part.
The aim of the present work is to design the austempering heat treatment of a differential case, which was originally made of an as-cast ductile iron. In order to do that, the general-purpose software ABAQUS is employed to solve the thermal and mechanical problems at a macroscale by means of the finite element method. The metal-lurgical problem is solved by taking into account the microscale features of the material by a novel model previ-ously published and validated by the authors (Boccardo et al., 2017b), which is here implemented into ABAQUS and coupled with its thermo-mechanical model by means of user-defined subroutines.
The main characteristics of the thermo-mechanical-metallurgical model and the implementation of the met-allurgical model into ABAQUS are described in Section 2. In Section 3 the modeling of the differential case is de-veloped. Moreover, the strategy to fit the metallurgical model by means of simple and standard experimental tests is included. Numerical results obtained for different values of heat treatment parameters are presented and dis-cussed in Section 4. Finally, conclusions are drawn about the computational tool employment, fitting process of the metallurgical model, and the obtained thermal cycle, dimensional changes, and microstructure.
2 NUMERICAL MODEL
2.1 Thermo-mechanical model
A coupled temperature-displacement transient analysis was performed in this work using ABAQUS under small deformation assumptions (ABAQUS, 2010).
For the mechanical model, the constitutive response of the ductile iron was modeled assuming an elasto-plastic behavior with isotropic hardening according to the J2-flow theory of elasto-plasticity. Furthermore, this behavior was considered to be temperature-dependent. Based on the work of Boccardo et al. (2017b), the relation between the stress
and total straine
is given by the constitutive law defined as::(
p v)
C e e e
(1)where
C
is the temperature-dependent isotropic elastic constitutive tensor, ep is the plastic strain tensor, and ve is the strain tensor associated to a volume expansion or contraction due to temperature and phase changes. The von Mises yield function is assumed to represent the plastic behavior of the ductile iron (Celentano et al., 2013):
(1/2) 2
(3 )
(
o h)
f
J
C C
(2)where
J
2 is the second invariant of the deviatoric part of
, Ch A e
eqp n is the isotropic plastic hardening function (whereA
is the strength index,n
is the strain hardening exponent, ande
eqp is the equivalent plasticdeformation), and
C
o is the temperature-dependent yield strength defining the initial elastic boundary.It is assumed that temperature and phase changes generate an isotropic volume deformation at the mac-roscale. The volume deformation is evaluated by employing the model proposed by Christien et al. (2013), which is based in the variation of the microstructure density. The increment of the strain tensor ev, required by the ABAQUS formulation, is evaluated as:
1 3
mic mic mic
v o t t t
mic mic t t t
e
(3)
where
omic,
t tmicΔ, and
tmic are the microstructure density at beginning of the simulation (reference state), attime
t
Δ
t
, and at timet
. Moreover,1
is the unit tensor of second-rank.The microstructure density varies with both temperature and phase changes; and it is evaluated by means of the rule of mixtures:
mic
i
f
ph ph
(4)
where
f
ph and
ph are the volume fraction and density of the microconstituents, respectively. The phasevolume fractions are computed with the metallurgical model described in Section 2.2. The temperature-dependent phase densities are calculated as in Boccardo et al. (2017b).
For the thermal problem, the heat released or absorbed by phase change is considered (Boccardo et al., 2017b). The heat transfer equation is written as follows:
( )
Tc div Kgrad T Q t
(5)
where
T
is the temperature,t
is the time,
is the density,c
is the specific heat capacity,Q
is the thermal power released or absorbed by phase changes, andK
is the isotropic conductivity tensor of second-rank defined asK k
1
, wherek
is the conductivity. The material parametersc
andk
are considered temperature-dependent.
conv env
q
h T T
(6)
where
q
conv is the normal heat flux,h
is the heat transfer coefficient at interface, andT
andT
env are thetemperatures at both sides of the interface.
The initial condition applied to the entire domain is
T T
o, whereT
o is a uniformly distributedtempera-ture.
2.2 Metallurgical model
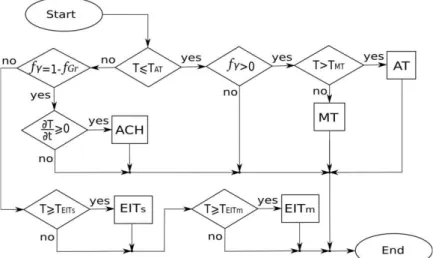
The metallurgical model simulates the microstructure evolution during the three-step of the austempering heat treatment. The metallurgical model considers an initial microstructure formed by ferritic, ferritic–pearlitic, or pearlitic matrices. During the heat treatment the microstructure suffers several phase transformations.
The model considers the development of:
• Stable (EITs) and metastable (EITm) reverse eutectoid transformations, in which ferrite and pearlite transform into austenite, respectively, during the heating from ambient temperature up to austenitizing temperature.
• Austenite carbon homogenization (ACH) during which the austenite carbon concentration is homogenized at austenitizing temperature. • Ausferritic transformation (AT) in which austenite transforms into ferrite platelets during the cooling from austenitizing temperature down
to ambient temperature. In the development of this transformation the ausferritic matrix is obtained.
• Martensitic transformation (MT) in which austenite transforms into martensite during the cooling from austenitizing temperature down to ambient temperature.
The solution scheme of the metallurgical model is illustrated in Figure 1, where TEITs, TEITm, TAT, and TMT are the temperatures at which transformations EITs, EITm, AT, and MT start, respectively; additionally,
f
Gr andf
are the graphite and austenite volume fractions, respectively. Notice that the developments of phase changesdepend on the value of temperature and the microstructure at time
t
.Figure 1: Metallurgical model: Schematic representation of the resolution (Boccardo et al., 2017b).
The microscale metallurgical model represents the evolution of the phases by means of representative vol-ume elements that allow considering microstructure characteristics such as the type, shape, and size of phases that form the ductile iron. The graphite nodules are assumed as spheres which are grouped into sets according to their radii; the number of sets is denoted as
nsetsg
. Additionally, the pearlite colonies are considered as a lami-nated composite of cementite and ferrite layers and they are grouped intonsetsc
sets according to their interlam-inar spacing. The equations to compute the volume fractions of graphite nodules, austenite, ferrite platelets, and martensite are (Boccardo et al., 2017b):
3
1
4
3 i i
nsetsg
Gr set Gr
i
f
N r
3 3 1 1 3 3 1 3 3 14
for EIT
3
4
for ACH
3
4
1
for AT
3
1
1
j j
i i i j
j
i i i
i i i i
nsetsg nsetsc o
set Gr p
i j
nsetsg
set shell Gr i
nsetsg
set shell p Gr i
o o
b b m shell she
x
x
N
r
r
f
x
N
r
r
f
N
r
f
r
f
f
f
f
for MT
ll m
(8)
3
1
4
3
i i insetsg
p p set shell i
f
f N r
(9)
o o
m b m b shell m shell
f
f
f
f
f
(10)where
r
Gr,r
, andr
shell are the radii of graphite nodule, austenite that grows within ferrite, and the sphericalrepresentative volume elements employed for ACH and AT, respectively;
x
,x
, andx
are the coordinates ofcementite-austenite and austenite-ferrite interfaces, and the length of the unidimensional representative element employed for EITm. Moreover,
f
po is the initial volume fraction of pearlite,f
ob andf
oshell are the volumefractions of austenite block and austenite shell at the beginning of MT,
f
p is the volume fraction of ferriteplatelets, while
f
b m andf
shell m are the volume fractions of austenite block and austenite shell thattransform into martensite, respectively. Finally,
N
set is the number of graphite nodules per unit of volume. Thefactors affected by subscripts
i
andj
are related to the sets of graphite nodules and pearlite colonies, respectively.The kinetics of phase transformation is computed by means of ordinary differential equations that are solved numerically with the explicit Euler method. The model employed for the ausferritic transformation simulates the nucleation of ferrite platelets by an incubation time function. This exponential function, Equation 11, has two pa-rameters (
k
1 andk
2) that need to be fitted with experimental data for each chemical composition of ductile iron (Boccardo et al., 2017a).1 2
3
exp
1
minc f
G
k
k
t
RT
k
(11)where
G
m is the maximum free energy available for nucleation at paraequilibrium condition,
f is the attemptfrequency factor,
R
is the gas constant,k
1 andk
2 are empirical parameters to be fitted, andk
3
2540 /
J mol
.Once the model is fitted correctly for a chemical composition, it is able to represent the evolution of ferrite platelets for other values of graphite nodule count and austempering temperature. A full description and equa-tions of the employed metallurgical model has been presented by Boccardo et al. (2017b).
2.3 Metallurgical model implementation
The USDFLD subroutine is used to implement the metallurgical model represented in Figure 1. Thus, the metallurgical model is solved at material points (Gauss points) of each finite element of the thermo-mechanical model. The variables related to the phase evolutions are stored into the STATEV array (solution-dependent state variables array) and it allows to pass information to HETVAL subroutine and visualize the results at the postpro-cess. The temperature within USDFLD is obtained by GETVRM subroutine.
The variables of the metallurgical model placed into STATEV array are initialized, at the beginning of the simulation, by employing the SDVINI subroutine. This subroutine also provides a check point to the input data. If problems are detected during the checking process, the calculation is stopped by STDB_ABQERR subroutine and a suitable error message is generated.
The heat flux generation
Q
due to phase changes is computed by HETVAL subroutine, and it is calculated as follows (Stefanescu, 2009):
s m p
p
f f f
Q L L L
t t t
(12)
where
L
,L
p, andL
are the latent heats of EITs, EITm, and AT transformations, respectively.Moreover,
f
s andf
m are the austenite volume fractions formed during EITs and EITm, respectively. Volumefraction derivatives are numerically evaluated.
The model to evaluate the deformations due to temperature and phase changes, Equation 3, is implemented into ABAQUS by means of the UEXPAN subroutine.
3 DIFFERENTIAL CASE MODELING
The austempering heat treatment of the differential case was performed in this paper by means of computer simulation. The specific part of interest is a gearbox component of front wheel drive automobiles.
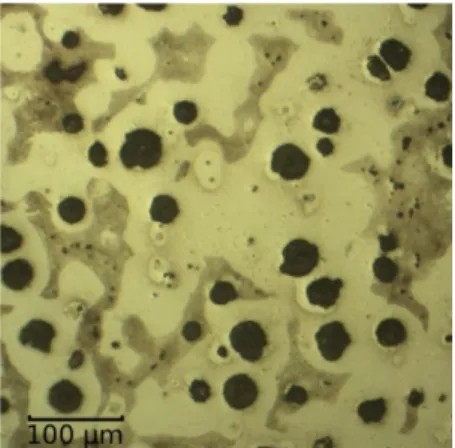
The initial microstructure of the whole part is composed by graphite nodules embedded into a ferritic-pearlitic matrix as shown in Figure 2. The graphite nodule count per unit of area is
200
nod mm
2, and the vol-ume fractions of graphite, ferrite, and pearlite are 0.16, 0.64, and 0.2, respectively, which were determined by image analysis of optical micrographs. The chemical composition, which is a design constraint, is 3.4C-0.8Mn-0.03Cr-0.4Cu-2.3Si-Fe (in weigh percent).In order to select appropriated values of the heat treatment parameters, several simulations were performed varying the austenitizing temperature, and austempering time and temperature.
Figure 2: Initial microstructure of the part. Graphite nodules in black, pearlite in brown, and ferrite in white.
3.1 Modeling of the part
the convection boundary condition was applied at the external surfaces of the geometry. The heat transfer coeffi-cient depends on the type of environment, and it was set as
h
70 /
W m C
2
during all the heating (furnace) and the cooling fromT
A down toT
Amb (room at ambient temperature), whereash
400 /
W m C
2
during thecooling from
T
down toT
A (salt bath) (Boccardo et al., 2017b). The thermal and mechanical properties ofduc-tile iron are shown in Tables 1 and 2, respectively.
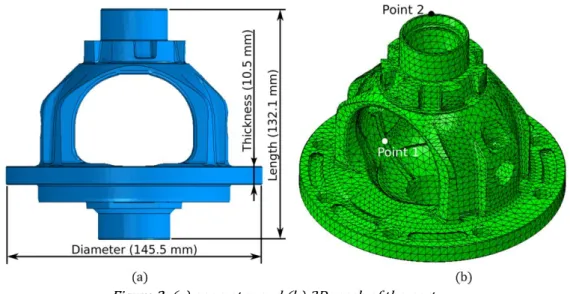
Figure 3: (a) geometry and (b) 3D mesh of the part.
Table 1: Thermal properties of ductile iron (Lacaze and Gerval, 1998; Kapturkiewicz et al., 2005; Celentano et al., 2013).
Temperature
C
W m C
Conductivity/
Specific heat
/
J kg C
20 44.1 500
280 44.1 612
420 40.9 672
560 37.1 732
700 33.6 750
840 28.1 758
980 22.5 786
3
7000 /
kg m
Latent heat
J kg
/
:L
5.8 10
44 4
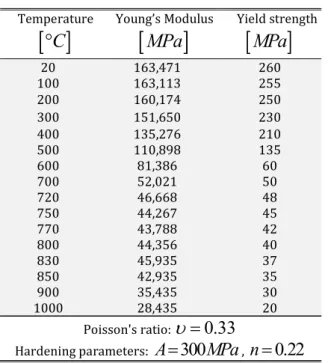
Table 2: Mechanical properties of ductile iron (Celentano et al., 2013).
Temperature
C
Young’s Modulus
MPa
Yield strength
MPa
20 163,471 260
100 163,113 255
200 160,174 250
300 151,650 230
400 135,276 210
500 110,898 135
600 81,386 60
700 52,021 50
720 46,668 48
750 44,267 45
770 43,788 42
800 44,356 40
830 45,935 37
850 42,935 35
900 35,435 30
1000 28,435 20
Poisson's ratio:
0.33
Hardening parameters:
A
300
MPa
,n
0.22
The metallurgical model was solved by considering graphite nodules of equal radius and pearlite colonies of equal interlaminar spacing (nsetsg1 and
nsetsc
1
). The graphite nodule count per unit of volume was calcu-lated asN
set1
3/ 4
NA
set31
1/2 (Boccardo et al., 2017a), where 12
200 /
setNA
nod mm
, and the interlaminarspacing of pearlite was set to 0.5 10 5 (coarse pearlite). The parameters of the ausferritic transformation model
are obtained using the fitting process described in Section 3.2.
3.2 Model fit
As described in the previous section, the ausferritic transformation model has two parameters to be fitted (
k
1 andk
2). The fitting strategy employed requires both experimental tests and numerical simulations, and it allows the model to consider the variation of the austempering temperature when the graphite nodule count re-mains constant.Fourteen cuboid samples of small dimensions (
20 1 0 5
mm
mm mm
) were extracted of one differential case, see Figure 4, and subjected to an experimental austempering heat treatment, all of them were austenitized atT
950
C
duringt
1200
s
, while the values ofT
A andt
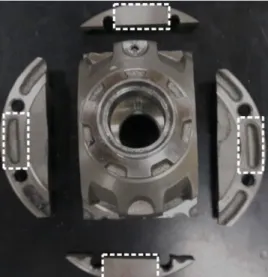
A were varied, as is shown in Table 3 and FigureFigure 4: Regions of which small samples were extracted (Regions indicated in dash line).
After the heat treatment, the samples were polished and etched during
15
s
with Picral reactive (4 %
picric acid in ethyl alcohol) to reveal the sheaves formed during the ausferritic transformation. Alternatively, Lepera’s reactive (1 %
aqueous solution of sodium metabisulfite and4 %
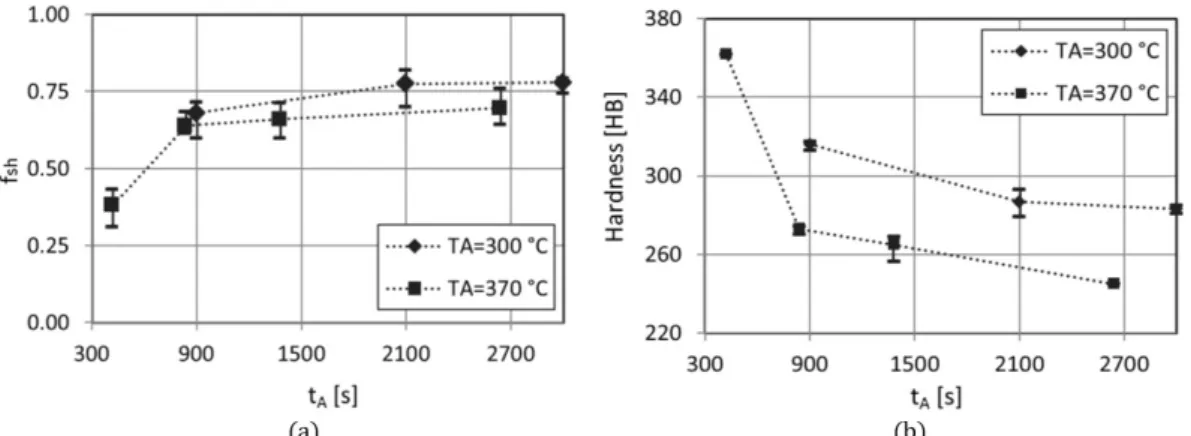
picral (LePera, 1980)) was employed, and simi-lar results were reached. The micrographs obtained for 370 _ 1 and 370 _ 4 samples are presented in Figure 6. Then, volume fractions of sheaves were measured by means of image analysis. As shown in Figure 7a for both values of austempering temperature, the microstructure presented an ausferritic-martensitic matrix at lower austempering time (small sheaves volume fraction) and a full ausferritic matrix at higher time.Additionally, Brinell hardness measurement was performed using
10
mm
steel ball and 3000 kgf . As shown in Figure 7b, the hardness decreases as austempering time increases, because sheaves volume fraction increases (or martensite volume fraction decreases).Table 3: Temperatures and times employed for the second step.
Sample
T C
A[ ]
t s
A
300_1
300
900
300_2 2100
300_3 3000
370_1
370
420
370_2 840
370_3 1380
Figure 5: Thermal cycle of small samples employed to characterize the kinetics of the ausferritic transformation.
Figure 6: Final microstructure of small samples austemperized at
T
A
370
C
for: (a)t
A
420
s
and (b)t
A
2640
s
.Graphite nodules in black, sheaves in brown, and austenite/martensite in white.
Figure 7: Evolution of: (a) sheaves volume fraction and (b) hardness, with austempering time and temperature.
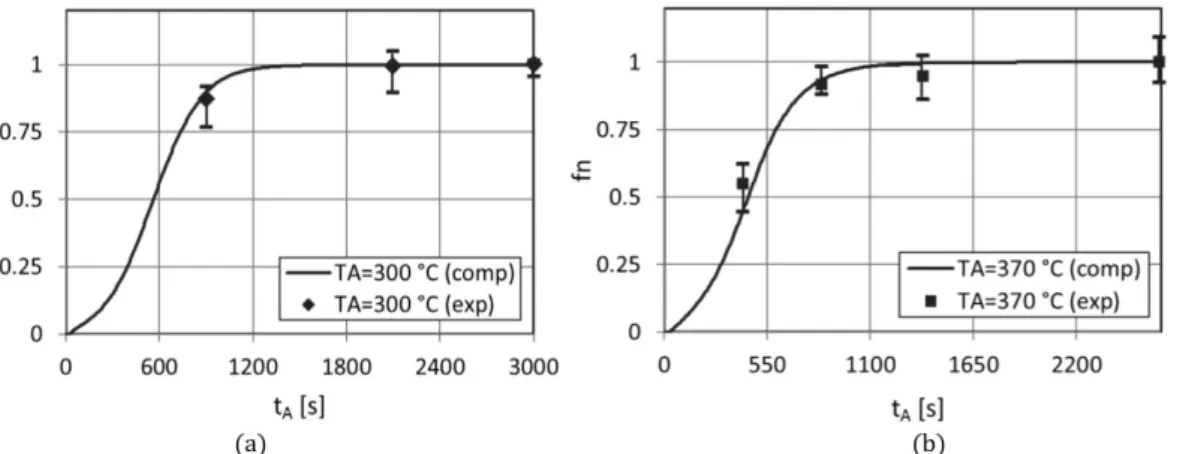
300 _ 3 and 370 _ 4 samples for different combinations of
k
1 andk
2. The geometry was meshed using 1950 tetrahedron elements of 4 nodes (C3D4T) and the convection boundary condition was applied at the external surfaces of the geometry. The optimal combination of these parameters minimizes the sum of the square differ-ences between numerical and experimental results, being the employed results the normalized sheaf volume frac-tion (f
n). This sum takes into account the mentioned difference of the two specimens used in the fitting process.The values obtained of the parameters were
k
1
3.5087 10
14 andk
2
1.9671 10 /
4J mol
. In Figure 8 theresults of the simulations employing these fitted values are compared with experiments for both austempering temperatures.
Figure 8: Kinetics of ausferritic transformation employing the fitted values of
k
1 andk
2 for: (a)T
A
300
C
and (b)370
A
T
C
.4 RESULTS AND DISCUSSION
The evolutions of temperature, phase volume fractions, and dimensional change of the differential case length during the heat treatment simulation were analyzed for
T
950
C
,T
A
330
C
, andt
A
2700
s
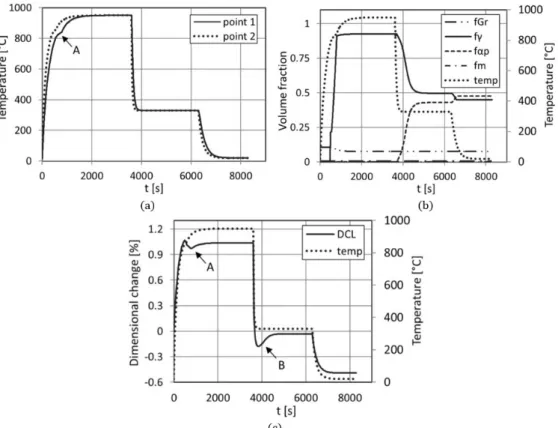
.In Figure 9a the temperature evolutions at points 1 and 2 of the part, see Figure 3b, are compared. Even though these points presented the largest difference in temperature evolution, it was small. In the first step, the variation of temperature evolution caused by the heat absorption of reverse eutectoid transformation was ob-served in the region A. Regarding phase evolutions, Figure 9b, during the first step the austenite volume fraction increased up to its maximum value (0.925) due to both reverse eutectoid transformation and austenite carbon homogenization. The volume fraction of this phase decreased during the second step as a consequence of the ausferritic transformation, in which it was consumed by ferrite platelets. The ausferritic transformation ended at
330
A
T
C
, but it restarted during the cooling down to the ambient temperature, a fact that explains thechang-es in austenite and ferrite platelet volume fractions as is shown in the figure. According to the numerical simula-tion, there was no martensite formation. The predicted evolution of austenite and ferrite platelets is in agreement with the experimental observations reported by Fraś et al. (2012). The length dimensional change during the heat treatment was studied, which is defined as
DC
m m m
t
o
/
o, wherem
is the value of the dimension, andthe subscripts
o
andt
stand for the initial value and the value at timet
, respectively. At the end of the first step an increment of the part length was observed, Figure 9c. This dimensional change had the contribution of both temperature increment, which produced an expansion, and phase change, which produced a contraction as may be observed in region A. At the beginning of the second step the length reduction occurred due to cooling fromT
down to
T
A, followed by an expansion caused by the austempering transformation, see region B. Finally, theFigure 9: Numerical results: (a) evolutions of temperatures at points 1 and 2 of the part, (b) evolutions of phase frac-tions at point 1, and (c) evolution of length dimensional change.
Figure 10 presents the ferrite platelet and austenite volume fractions at the end of the simulated heat treat-ment. The values of these fractions, in the whole part, are almost uniform and around of
f
p
0.475
and0.45
f
. For each phase, the small difference occurred due to different cooling rates during the cooling fromA
T
down toT
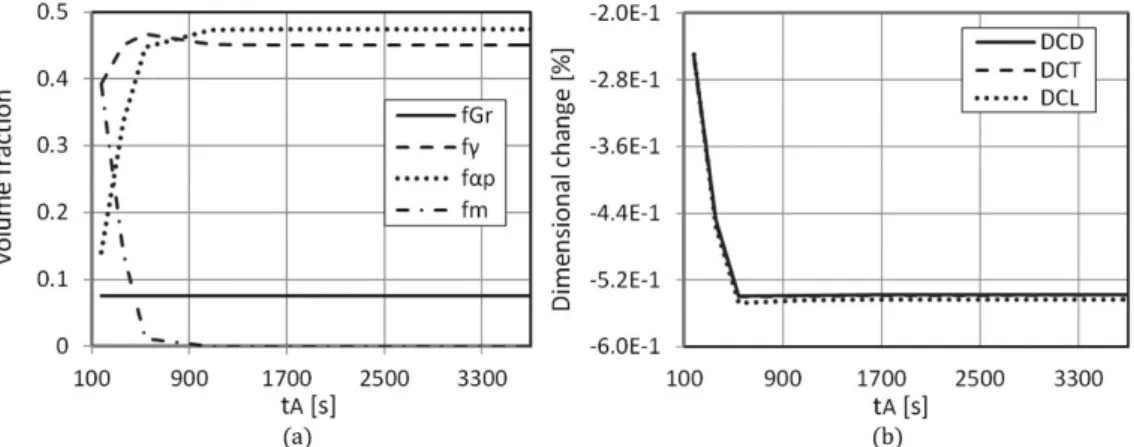
Amb.4.1 Influence of austempering time
The influence of austempering time in the final microstructure and final dimensional change of diameter (DCD), thickness (DCT), and length (DCL), see Figure 3a, was studied. Several heat treatment simulations were performed for
T
950
C
,T
A
330
C
, and austempering time in the range of180
t
A3600
s
. The finalphase volume fractions, for each austempering time, were almost uniform in the whole part and their average values are presented in Figure 11a. For austempering time less than
1000
s
a final ausferritic-martensitic matrix was predicted by the model. The martensite volume fraction decreased when the austempering time increased. To obtain a full ausferritic matrix with a maximum ferrite platelet volume fraction, the austempering time has to be greater than2400
s
, which is the required time to end the ausferritic transformation atT
A. It is worthwhileto notice that the same behavior was observed in samples employed to fit the metallurgical model. The dimen-sional change at the end of the heat treatment is defined as DC
mf mo
/mo, wherem
is the value of the dimension, and the subscriptso
and f stand for the initial and final values, respectively. As is shown in Figure 11b, dimension reductions occurred for any austempering time. The maximum reduction occurred for the maxi-mum ferrite platelet volume fraction, which is obtained when the ausferritic transformation has been completely developed atT
A. Moreover, DCD, DCT, and DCL were very close each other, because the final volume fraction isalmost uniform in the whole part.
Figure 11: Numerical results of the influence of austempering time in: (a) final phase fractions and (b) final dimensional change of diameter, thickness, and length.
4.2 Influence of austenitizing and austempering temperatures
The influence of austenitizing and austempering temperatures in the minimum required time for both first and second steps, final microstructure, final dimensional change, and cooling rate during the cooling from
T
down to
T
A was studied. Simulations were performed for austenitizing and austempering temperatures in theranges of
880
C T
950
C
and300
C T
A400
C
.The minimum required time for the first step (
t
min ) has the contribution of a) time to get the temperature atwhich the reverse eutectoid transformation starts and b) time to transform the initial microstructure. In the simu-lation it was observed that when
T
increased, the first time is increased and the second one decreased. There-sulting variation of
t
min withT
is shown in Figure 12a, and the maximum difference was2.6 %
. On the otherhand, the minimum required time for the second step (
t
Amin) has the contribution of a) time to get the880
T
C
-T
A
300
C
, respectively; meanwhile the maximum and minimum values for the second one wereobtained at
T
950
C
-T
A
300
C
andT
880
C
-T
A
400
C
, respectively. The resulting variation of minA
t
withT
andT
A is shown in Figure 12b, and the maximum difference was9.7 %
.Figure 12: Numerical results of the influence of: (a) austenitizing temperature in the minimum required time for the first step and (b) austenitizing and austempering temperatures in the minimum required time for the second step.
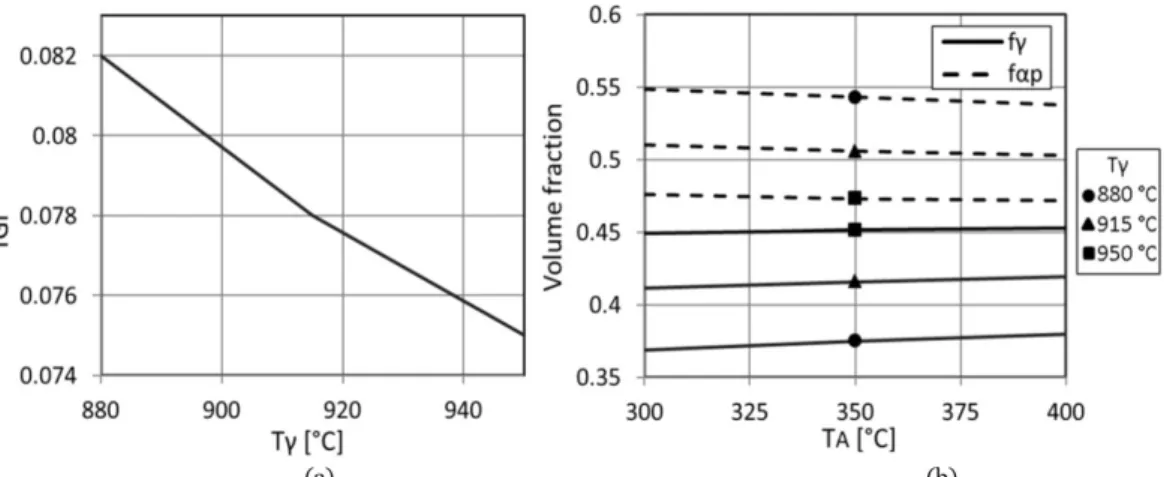
Regarding the microstructure at the end of the heat treatment, the graphite volume fraction depended on the austenitizing temperature, decreasing its fraction with the increment of the temperature, as may be seen in Figure 13a. The maximum difference in the graphite volume fraction was
9.3 %
. The ferrite platelet volume fraction increased with the decrement of bothT
andT
A, therefore the maximum volume fraction was obtained at880
T
C
-T
A
300
C
, and the maximum difference was16.3 %
, as is shown in Figure 13b. The variation ofthis phase fraction with
T
A was less than the expected, because a large amount of ferrite platelets was formedduring the third step when the part was cooling from a high value of
T
A. The behavior of austenite volumefrac-tion was opposite to the found for the ferrite platelets, because austenite was consumed by the second phase dur-ing the ausferritic transformation.
Figure 13: Numerical results of the influence of: (a) austenitizing temperature in the final graphite volume fraction and (b) austenitizing and austempering temperatures in the final ferrite platelet and austenite volume fractions.
dimensional changes were very close to each other, because the final volume fraction is almost uniform in the whole part. Moreover, the dimensional changes were highly influenced by
T
, being the maximum difference of30 %
.Figure 14: Numerical results of the influence of austenitizing and austempering temperatures in the final dimensional change of diameter, thickness, and length.
In order to obtain a full ausferritic matrix, the eutectoid transformation has to be avoided (transformation of austenite into ferrite and pearlite). One way to do that is by subjecting the part to high cooling rate during the cooling from
T
down toT
A (Venugopalan, 1990). In Figure 15 the cooling rate at point 1, developed between880
C
and600
C
, is presented for different values ofT
andT
A. The analysis is presented for this part point,because it presented the lowest value of cooling rate. The cooling rate is defined as
CR
800 600 / Δ
C t
, whereΔ
t
is the required time to cool the part from880
C
to600
C
. As may be seen, the cooling rate in-creased whenT
increased andT
A decreased, and the maximum difference was38.6 %
.Figure 15: Numerical results of the influence of austenitizing and austempering temperatures in the cooling rate, at point 1, during the cooling of the second step.
4.3 Influence of size and geometry of the part
A small difference was observed in the final microstructure. The ferrite platelet volume fraction in DFC was
4 %
greater than for SS, because different amount of this phase was formed during the cooling fromT
A down toambient temperature. As a consequence the final dimensional change (in absolute value) in SS is
3 %
greater than for DFC.The minimum required time for the first step was highly influence by the size and geometry, being
1130
s
and3200
s
for SS and DFC, respectively. As was mentioned in Section 4.2,t
min has the contribution of a) time toget the temperature at which the reverse eutectoid transformation starts and b) time to transform the initial mi-crostructure. In SS these contributions were smaller than for DFC. The minimum required time for the second step was
2335
s
and2400
s
for SS and DFC, respectively, indicating that it was slightly influenced by the men-tioned changes. The small difference occurred because a different time was necessary to get the temperature at which the ausferritic transformation starts, due to different cooling rate for SS (21.05 /
C s
) and DFC (5.91 /
C s
) during the cooling down toT
A, and that the duration of the ausferritic transformation atT
A wasalmost the same for both parts.
4.4 Selection of heat treatment parameters
As shown in Sections 4.1 and 4.2, the austenitizing temperature, the austempering temperature, and the aus-tempering time highly influence the final phase fraction, final dimensional change, among other variables.
In order to obtain a final microstructure composed by graphite nodules and a full ausferritic matrix, the dura-tion of the second step is chosen to be equal to
t
minA . The selected values for the temperatures areT
950
C
and
T
A
330
C
because they allow to obtain: (a) the desired microstructure for the part application and (b)high cooling rate that prevents the transformation of austenite into ferrite and pearlite. For the chosen tempera-tures, the minimum required time for first and second steps are
t
min
3200
s
andt
Amin
2400
s
. The finaldi-mensional change, due to the heat treatment, has to be considered in both pre and post machining processes in order to satisfy the dimensional tolerance.
The differential case was heat treated in a laboratory in order to verify the results obtained with the simula-tion. The durations chosen for the first and second steps were around
10%
greater than the durations predicted by the model (t
3600
s
andt
A
2700
s
), and the experimental procedure was the same that the employedfor the small samples.
As was predicted by the simulation, the microstructure obtained in the experiment is uniform in the whole part. The presence of ferrite, pearlite, and martensite was not observed, as is shown in Figure 16, even in the re-gion with the lowest cooling rate from
T
toT
A (point 1).5 CONCLUSIONS
The design of the austempering heat treatment of a ductile iron differential case, aided by computer simula-tion, was presented in this paper. The simulation was performed with a coupled thermo-mechanical-metallurgical model, which was fitted to the chemical composition of the part.
The main conclusions drawn from the work may be summarized as follows:
(a) The metallurgical model was implemented into ABAQUS by means of user-defined subroutines. The pre-process, resolution, and post-process required to perform the simulations and analyses of results were carried out in spite of the complexity of the part geometry and the large size of the employed finite element mesh.
(b) The metallurgical model was successfully fitted to the alloy chemical composition by employing a standard procedure that involved experimental heat treatment, at different austempering times and temperatures, and microstructure analysis of several small samples obtained of one differential case.
(c) According to the simulations, the austempering time modifies the type of final microstructure. In the differential case, ausferritic-martensitic and ausferritic matrices are obtained for short and large values of austempering times, respectively. The same behavior is observed in the samples employed to fit the metallurgical model. Additionally, the austenitizing temperature highly influences the final phase volume fraction (decrement of graphite and ferrite platelet volume fractions with a temperature increment) and final dimensional change (increment of the contraction with a temperature increment) when the ausferritic transformation was
completely developed at the austempering temperature.
(d) The minimum time required for the first step of the differential case heat treatment is influenced by the austenitizing temperature (decrement of this time with a temperature increment). On the other hand, when the size of the part is reduced, the minimum required time decreases. The minimum required time for the second step of the differential case heat treatment is influenced by the austenitizing and austempering temperatures in a not simple way, and it suffers a small variation when the size of the part is reduced.
(e) The temperature evolution in whole part presented small differences; a fact that allowed to obtain a uniform ausferritic matrix, at the end of the heat treatment, in the whole part.
(f) The model was appropriate to predict the minimum required time, for both first and second steps, to obtain a full ausferritic matrix at the end of the heat treatment. The predicted values were
t
min
3200
s
andt
minA
2400
s
, and the experimental heat treatment of the part was developed increasing botht
andt
A in10%
.(g) Amounts of ferrite and pearlite were not observed in the micrographs of the treated differential case, indicating that the cooling rate was correctly chosen. The cooling rate highly depends on the austempering temperature. When considerable amounts of ferrite and pearlite are obtained during the cooling from austenitizing temperature down to austempering temperature, the metallurgical model has to consider the development of the eutectoid transformation in order to represent adequately the phase evolution throughout the three-step austempering heat treatment.
Acknowledgment
During the course of this Research A.D. Boccardo had a postdoctoral scholarship from CONICET. L.A. Godoy is a member of the research staff of CONICET. This work was supported by a grant from Universidad Tecnológica Nacional (ASUTNCO0004735). The experimental heat treatment was developed at Departamento de Ingeniería Metalúrgica, Facultad Regional Córdoba, Universidad Tecnológica Nacional. The authors thank the contributions of Diego J. Celentano in the development of some parts of the model reported in this paper.
References
ABAQUS (2010). ABAQUS documentation, version 6.10, Dassault Systèmes, Providence, RI, USA.
ASTM A 897M-03 (2003). Standard specification for austempered ductile iron castings.
Boccardo, A., Dardati, P., Celentano, D., Godoy, L. (2017a). A microscale model for ausferritic transformation of austempered ductile irons. Metallurgical and Materials Transactions A 48:524-535.
Boccardo, A., Dardati, P., Celentano, D., Godoy, L. (2017b). Austempering heat treatment of ductile iron: Computa-tional simulation and experimental validation. Finite Elements in Analysis and Design 134:82-91.
Celentano, D., Dardati, P., Carazo, F., Godoy, L. (2013). Thermomechanical-microstructural modelling of nodular cast iron solidification. Materials Science and Technology 29:156-164.
Christien, F., Telling, M., Knight, K. (2013). A comparison of dilatometry and in-situ neutron diffraction in tracking bulk phase transformations in a martensitic stainless steel. Materials Characterization 82:50-57.
Fraś, E., Górny, M., Tyrała, E., Lopez, H. (2012). Effect of nodule count on austenitising and austempering kinetics of ductile iron castings and mechanical properties of thin walled iron castings. Materials Science and Technology 28(12):1391-1396.
Gundlach, R.B. and Janowak, J.F. (1983). Development of a ductile iron for commercial austempering. AFS Trans-actions 86:377.
Hepp, E., Hurevich, V., Schäfer, W. (2012). Integrating modeling and heat treatment simulation of austempered ductile iron. IOP Conference Series: Materials Science and Engineering 33:012076.
Kapturkiewicz, W., Fraś, E., Burbelko, A. (2005). Computer simulation of the austenitizing process in cast iron with pearlitic matrix. Materials Science and Engineering A 413-414:352-357.
Kokkula, S., Langseth, M., Hopperstad, O.S., Lademo, O.G. (2006). Behaviour of an automotive bumper beam-longitudinal system at 40% offset impact: an experimental and numerical study. Latin American Journal of Solids and Structures 3:59-73.
Kong, Y.S., Abdullah, S., Omar, M.Z., Haris, S.M. (2016). Topological and topographical optimization of automotive spring lower seat. Latin American Journal of Solids and Structures 13:1388-1405.
Lacaze, J. and Gerval, V. (1998). Modelling of the eutectoid reaction in spheroidal graphite Fe-C-Si alloys. ISIJ In-ternational 38:714-722.
Lee, S., Kim, B., Lee, H.-J., Yoon, J. (2016). Warm forging of an aluminium alloy for the differential case in an auto-mobile transmission. Proceedings of the Institution of Mechanical Engineers, Part D: Journal of Autoauto-mobile Engi-neering 230(8):1131-1139.
LePera, F. (1980). Improved etching technique to emphasize martensite and bainite in high-strength dual-phase steel. Journal of Metals 32:38-39.
Mendez, S., de la Torre, U., Larranaga, P., Suarez, R., Stefanescu, D. (2015). New as-cast ductile iron raises bar properties. Metal Casting Design & Purchasing 17(5):39-44.
Moncada, O.J. and Sikora, J.A. (1996). Dimensional change in austempered ductile iron. AFS Transactions 104:577-580.
Pérez Villalobos, I., Getzlaff, U., Köser, O. (2011). Predicción mediante la simulación de la microestructura en fun-diciones ADI tras el tratamiento térmico. FundiPress: Revista de la Fundición 28:30-33.
Putman, D. and Thomson, R. (2003). Microstructural and mechanical property modelling of austempered ductile iron. International Journal of Cast Metals Research 16:191-196.
Sorelmetal (1998). Ductile iron data for design engineers, Rio Tinto Iron & Titanium Inc. (Montreal).
Sosa, A.D., Echeverría, M.D., Moncada, O.J., Míngolo, N., Sikora, J.A. (2009). Influence on nodule count on residual stresses and distortion in thin wall ductile iron plates of different matrices. Journal of Materials Processing Tech-nology 209:5545-5551.
Stefanescu, D. (2009). Science and engineering of casting solidification, 2nd ed., Springer (New York).
Venugopalan, D. (1990). Computer modeling of ferrite and pearlite formation in ductile iron. Physical Metallurgy of Cast Iron IV: Proceedings of the Fourth International Symposium on the Physical Metallurgy of Cast Iron 271-278.
Yescas, M. (2003). Prediction of the vickers hardness in austempered ductile irons using neural networks. Inter-national Journal of Cast Metals Research 15:513-521.