Escola de Gestão
Departamento de Métodos Quantitativos para Gestão e Economia
On Clustering Stability
Maria José de Pina da Cruz Amorim
Compilação de artigos especialmente elaborada para obtenção do grau de Doutor em Métodos Quantitativos
Orientadora:
Doutora Maria Margarida Guerreiro Martins dos Santos Cardoso, Professora Associada com Agregação, ISCTE – Instituto Universitário de Lisboa
Escola de Gestão
Departamento de Métodos Quantitativos para Gestão e Economia
On Clustering Stability
Maria José de Pina da Cruz Amorim
Compilação de artigos especialmente elaborada para obtenção do grau de Doutor em Métodos Quantitativos
Júri:
Doutora Elizabeth de Azevedo Reis, Professora Catedrática, ISCTE- Instituto Universitário de Lisboa
Doutor Mário Alexandre Teles de Figueiredo, Professor Catedrático, Instituto Superior Técnico de Lisboa
Doutora Teresa Paula Costa Azinheira Oliveira, Professora Auxiliar, Universidade Aberta
Doutora Ana Alexandra Antunes Figueiredo Martins, Professora Adjunta, Instituto Superior de Engenharia de Lisboa
Doutora Paula Alexandra Barbosa da Conceição Vicente Duarte, Professora auxiliar com Agregação, ISCTE – Instituto Universitário de Lisboa
Doutora Maria Margarida Guerreiro Martins dos Santos Cardoso, Professora Associada com Agregação, ISCTE – Instituto Universitário de Lisboa
i
Em memória do meu querido gato Tareco Amorim, pelo seu apoio, companhia e amor
ii
AGRADECIMENTOS
Agradeço a todas as pessoas que directa ou indirectamente me apoiaram e incentivaram ao longo deste trabalho de investigação.
Agradeço especialmente à Professora Margarida Cardoso por tudo aquilo que me ensinou, pelo seu empenho, dedicação e pela sua orientação, sem a qual este trabalho não teria sido possível.
Agradeço ao Instituto Superior de Engenharia de Lisboa o facto de ter pago parte das propinas do doutoramento e me ter concedido equiparação a bolseiro em tempo integral durante um semestre.
iii
Abstract
This work is dedicated to the evaluation of the stability of clustering solutions, namely the stability of crisp clusterings or partitions. We specifically refer to stability as the concordance of clusterings across several samples. In order to evaluate stability, we use a weighted cross-validation procedure, the result of which is summarized by simple and paired agreement indices values. To exclude the amount of agreement by chance of these values, we propose a new method – IADJUST – that resorts to simulated cross-classification tables. This contribution makes viable the correction of any index of agreement.
Experiments on stability rely on 540 simulated data sets, design factors being the number of clusters, their balance and overlap. Six real data with a priori known clusters are also considered. The experiments conducted enable to illustrate the precision and pertinence of the IADJUST procedure and allow to know the distribution of indices under the hypothesis of agreement by chance. Therefore, we recommend the use of adjusted indices to be common practice when addressing stability. We then compare the stability of two clustering algorithms and conclude that Expectation-Maximization (EM) results are more stable when referring to unbalanced data sets than K means results. Finally, we explore the relationship between stability and external validity of a clustering solution. When all experimental scenarios’ results are considered there is a strong correlation between stability and external validity. However, within a specific experimental scenario (when a practical clustering task is considered), we find no relationship between stability and agreement with ground truth.
Keywords: Adjusted índices of agreement, Clustering evaluation, External evaluation, Clustering stability.
iv
Resumo
Este trabalho é dedicado à avaliação da estabilidade de agrupamentos, nomeadamente de partições. Consideramos a estabilidade como sendo a concordância dos agrupamentos obtidos sobre diversas amostras. Para avaliar a estabilidade, usamos um procedimento de validação cruzada ponderada, cujo resultado é resumido pelos valores de índices de concordância simples e pareados. Para excluir, destes valores, a parcela de concordância por acaso, propomos um novo método - IADJUST - que recorre à simulação de tabelas cruzadas de classificação. Essa contribuição torna viável a correção de qualquer índice de concordância.
A análise experimental da estabilidade baseia-se em 540 conjuntos de dados simulados, controlando os números de grupos, dimensões relativas e graus de sobreposição dos grupos. Também consideramos seis conjuntos de dados reais com classes a priori conhecidas. As experiências realizadas permitem ilustrar a precisão e pertinência do procedimento IADJUST e conhecer a distribuição dos índices sob a hipótese de concordância por acaso. Assim sendo, recomendamos a utilização de índices ajustados como prática comum ao abordar a estabilidade. Comparamos, então, a estabilidade de dois algoritmos de agrupamento e concluímos que as soluções do algoritmo Expectation Maximization são mais estáveis que as do K-médias em conjuntos de dados não balanceados. Finalmente, estudamos a relação entre a estabilidade e validade externa de um agrupamento. Agregando os resultados dos cenários experimentais obtemos uma forte correlação entre estabilidade e validade externa. No entanto, num cenário experimental particular (para uma tarefa prática de agrupamento), não encontramos relação entre estabilidade e a concordância com a verdadeira estrutura dos dados.
Palavras-chave: índices de concordância ajustados, avaliação de agrupamentos, validação externa de agrupamentos, estabilidade
v
Sumário Executivo
Este trabalho é dedicado à avaliação da estabilidade de agrupamentos, nomeadamente de partições. Consideramos a estabilidade como sendo a concordância dos agrupamentos obtidos sobre diversas amostras. Para avaliar a estabilidade, usamos um procedimento de validação cruzada ponderada, cujo resultado é resumido pelos valores de índices de concordância simples e pareados. Para excluir, destes valores, a parcela de concordância por acaso, propomos um novo método – IADJUST. Segundo este método são simuladas tabelas de classificação cruzada, obedecendo estas aos totais marginais da tabela de classificação cruzada observada, ou seja a tabela referida às partições que se pretendem comparar. A geração das tabelas de classificação cruzada é feita de acordo com o modelo Hipergeométrico. Utiliza-se a linguagem de programação R para implementar o método. A contribuição do IADJUST torna viável a correção de qualquer índice de concordância, superando limitações de métodos analíticos e aproximativos conhecidos à data.
A análise experimental da estabilidade baseia-se em 540 conjuntos de dados simulados, controlando os números de grupos (2, 3 e 4), dimensões relativas (grupos balanceados e não balanceados) e graus de sobreposição dos grupos (grupos bem, moderadamente e fracamente separados). As bases de dados simulados são geradas de acordo com modelos de mistura finita de normais multivariadas, utilizando o package MixSim para o efeito. A análise é também efetuada sobre seis conjuntos de dados reais, com classes a priori conhecidas (disponíveis no UCI Machine Learning Repository)
As experiências realizadas permitem ilustrar a precisão e pertinência do procedimento IADJUST e conhecer a distribuição dos índices sob a hipótese de concordância por acaso (H0). Assim sendo, recomendamos a utilização de índices ajustados como prática comum ao abordar a estabilidade de agrupamentos e, em certos casos, a utilização da mediana em vez da média (sob H0) para este ajustamento.
Comparando a estabilidade de dois algoritmos de agrupamento - K-Médias e Expectation Maximization (EM) – incorporamos o procedimento IDJUST. Verificamos que, nos cenários com grupos de dimensão balanceada as partições obtidas com o K médias são mais estáveis e nos cenários em que os grupos têm dimensões desproporcionadas são mais estáveis as soluções obtidas com o EM.
vi
Finalmente, este trabalho contribui com uma nova perspetiva para uma melhor compreensão da relação entre estabilidade de um agrupamento e a sua validade externa. Agregando os resultados dos cenários experimentais obtemos uma forte correlação entre estabilidade e validade externa. No entanto, num cenário experimental particular (para uma tarefa prática de agrupamento), não encontramos relação entre estabilidade de um agrupamento e a sua concordância com as verdadeira classes. Assim, e embora um agrupamento instável continue a ser, por isso mesmo, indesejável (senão que resultados deveria um analista escolher?), constata-se que não há uma relação credível entre a estabilidade de uma partição e a sua concordância com a verdadeira estrutura dos dados. Palavras-chave: índices de concordância ajustados, avaliação de agrupamentos, validação externa de agrupamentos, estabilidade
vii
CONTENTS
AGRADECIMENTOS ... II
ABSTRACT ... III
RESUMO ... IV
SUMÁRIO EXECUTIVO ... V
CHAPTER 1: INTRODUCTION ... 1
ON CLUSTERING VALIDATION AND RESEARCH OBJECTIVES ... 1
STABILITY AND CROSS-VALIDATION ... 3
INDICES OF AGREEMENT BETWEEN PARTITIONS ... 7
A TYPOLOGY ... 8
THE ADJUSTMENT OF INDICES FOR EXCLUDING AGREEMENT BY CHANCE ... 9
THE PROPOSED APPROACH ... 12
EXPERIMENTS ON STABILITY ... 12
THE IADJUST PROCEDURE ... 12
TESTING IADJUST ... 13
IADUST INTO PRACTICE ... 13
SIMULATED DATA SETS ... 13
REAL DATA SETS ... 14
A THESIS GUIDE ... 15
CHAPTER 2: CLUSTERING CROSS-VALIDATION AND MUTUAL
INFORMATION INDICES ... 17
INTRODUCTION ... 18
METHODOLOGICAL APPROACH ... 19
THE PROPOSED METHOD STEP-BY-STEP ... 19
viii
INDICES CORRECTED BY CHANCE- THE USE OF THRESHOLDS ... 21
DATA ANALYSIS AND RESULTS ... 22
SIMULATED DATA SETS ... 22
REAL DATA SET - SEGMENTING CLUSTERS OF A WHOLESALE DISTRIBUTOR ... 22
REAL DATA SET - SEGMENTING CLUSTERS OF A WHOLESALE DISTRIBUTOR ... 23
DISCUSSION AND PERSPECTIVES ... 25
BIBLIOGRAPHY ... 28
CHAPTER 3: PAIRED INDICES FOR CLUSTERING EVALUATION -
CORRECTION FOR AGREEMENT BY CHANCE ... 31
INTRODUCTION ... 32
INDICES OF PAIRED AGREEMENT BETWEEN PARTITIONS ... 32
CORRECTING INDICES FOR AGREEMENT BY CHANCE ... 33
THE PROPOSED METHOD ... 34
DATA ANALYSIS AND RESULTS ... 34
DISCUSSION AND PERSPECTIVES ... 37
REFERENCES ... 37
CHAPTER 4: COMPARING CLUSTERING SOLUTIONS: THE USE OF
ADJUSTED PAIRED INDICES ... 40
MOTIVATION AND OBJECTIVES ... 41
USING INDICES OF PAIRED AGREEMENT BETWEEN TWO PARTITIONS ... 43
COMMON INDICES USED IN CLUSTERING VALIDATION... 43
CORRECTING PAIRED INDICES FOR AGREEMENT BY CHANCE ... 44
THE PROPOSED IADJUST METHOD ... 48
IADJUST STEP BY STEP ... 48
EXPERIMENTAL DATA TO PROVIDE EVALUATION OF IADJUST ... 51
DATA ANALYSIS AND RESULTS ... 52
THE PRECISION OF IADJUST ... 52
THE DETAILED COMPARISON OF TWO CLUSTERING ALGORITHMS ... 52
NEW INSIGHTS ON PAIRED INDICES OF AGREEMENT ... 55
ix
REFERENCES ... 61
CHAPTER 5: CLUSTERING STABILITY AND GROUND TRUTH:
NUMERICAL EXPERIMENTS ... 63
INTRODUCTION ... 64
THE PROPOSED METHOD ... 64
WHY STABILITY? ... 64
CROSS-VALIDATION ... 65
ADJUSTED AGREEMENT BETWEEN PARTITIONS ... 65
NUMERICAL EXPERIMENTS ... 66
CONTRIBUTIONS AND PERSPECTIVES ... 68
REFERENCES ... 69
CHAPTER 6: CLUSTERING STABILITY AND GROUND TRUTH:
NUMERICAL EXPERIMENTS ... 70
INTRODUCTION ... 71
ON CLUSTERING STABILITY ... 71
WHY STABILTY? ... 71
CROSS-VALIDATION ... 71
ADJUSTED AGREEMENT BETWEEN PARTITIONS ... 72
NUMERICAL EXPERIMENTS ... 73
SYNTHETIC DATA... 73
REAL DATA ... 73
CONTRIBUTIONS AND PERSPECTIVES ... 75
REFERENCES ... 75
CHAPTER 7 - CONCLUSIONS AND FUTURE WORK ... 77
CONCLUSIONS AND DISCUSSION... 77
FUTURE WORK ... 78
x
APPENDIX A: THE EXACT ADJUSTMENT OF THE RAND INDEX . 85
APPENDIX B: THE ADJUSTMENT OF THE RAND AND
CZEKANWSKI INDICES ... 87
THE ADJUSTMENT OF THE RAND INDEX ... 88
THE IS EQUAL TO THE INDEX ... 89
THE ADJUSTMENT OF THE CZEKANOWSKI INDEX ... 92
THE IS EQUAL TO THE INDEX ... 92
APPENDIX C –DATA ANALYSIS RESULTS ... 93
ADJUSTED INDICES: COMPARATIVE RESULTS ... 93
EMPIRICAL RESULTS ... 95
THE INDICES‟ EMPIRICAL DISTRIBUTIONS UNDER THE HYPOTHESIS OF RESTRICTED AGREEMENT BY CHANCE ... 95
SUMMARIZING RESULTS OBTAINED... 97
1
CHAPTER
1:
INTRODUCTION
On Clustering Validation and Research Objectives
Cluster analysis is the partitioning of a data set into groups (clusters), so that data points within a group are similar to each other and elements of different clusters are dissimilar. A clustering is a set of clusters that covers a data set, commonly a partition.
Cluster analysis can be used in a wide variety of fields such as biology Wu (2011), ecology (Ravera, 2001), medical sciences (Marateb et al., 2014), image and market segmentation (Müller and Hamm, 2014), music (instrument recognition, find musical structure) (Krey et al., 2014), engineering (Todeschini et al., 2012; Krey et al., 2015), and many more. “Solving a clustering problem may also help solving other related problems, such as pattern classification and rule extraction from data” (Vendramin et al., 2010: 209).
“Clustering methods range from those that are largely heuristic to more formal procedures based on statistical models.” (Fraley and Raftery, 1998: 578). In any case, when we conduct a cluster analysis the assessment of the quality/validity of the solution obtained is an extremely important issue since:
- Cluster analysis is an unsupervised learning method and so, in practical applications, “there is no ground truth against which we could “test” our clustering results” (Luxburg, 2009): 236);
- Clustering methods tend to generate clusterings even for fairly homogeneous data sets” (Hennig, 2007): 258);
- The clustering solution depends on the method used, different methods emphasizing different aspects of the data and thus enforcing different structure on data;
- Clustering methods‟ parametrization influences the corresponding results since the methods “attempt to define the best partitioning of data set for the given parameters … and not necessarily the „best‟ one that fits the data set.” (Halkidi and Vazirgiannis, 2001: 111).
On Clustering Stability
2 When evaluating a clustering solution two main perspectives can be considered: internal and external.
The external evaluation of clustering results resorts to data sets with known cluster structure and measures agreement between this structure and the results obtained. The procedure allows evaluating the ability of algorithms to recover the classes known a priori.
In general, external evaluation is carried out both on synthetic data and real data. The first may be resulting from generation of finite mixture models, for example - (Maitra and Melnykov 2010). Real data (with known classes) can be obtained, for example, in the Machine Learning UCI Repository - (Bache and Lichman, 2013).
The internal evaluation of clustering results relies in the clusters cohesion and separation. These are inherent properties to the very idea of clustering, reflecting the internal homogeneity of elements in the same group and the isolation of a group when compared with others (heterogeneity between groups). The evaluation of these properties resorts to indices of cohesion-separation, which commonly are ratios between a measure of intra-groups vs. between-groups variation, e.g. (Cardoso et al., 2009). In the context of internal evaluation we can address clustering stability. Stability has been recognized as a desirable property of a clustering solution – e.g. (Jain and Dubes, 1988; Mirkin, 1996; Gordon, 1999; Everit et al., 2001; Lange et al., 2004; Alizadeh et al., 2014). A clustering solution is said to be stable if it remains fairly unchanged when the clustering process is subject to minor modifications such as alternative parameterizations of the algorithm used, introducing noise in the data or using different samples.
Ben-David and Von Luxburg (2008) warn of a possible misuse of stability noting that the goodness of this property in the evaluation of clustering results is not theoretically well founded: “While it is a reasonable requirement that an algorithm should demonstrate stability in general, it is not obvious that, among several stable algorithms, the one which is most stable leads to the best performance” (p. 379).
This work is dedicated to the evaluation of the stability of clustering solutions, namely the stability of crisp clustering solutions or partitions. We aim at contributing to provide adequate measures of agreement between partitions which should exclude agreement by
CHAPTER 1: Introduction
3 chance. In addition, the relationship between stability and external validity of a clustering solution is explored in order to improve the understanding of the role of stability when evaluating a clustering solution.
Stability and Cross-Validation
In this work we specifically consider the stability concept which refers to variability/consistency of clustering solutions across several samples. There are several contributions in this domain. Table 1 summarizes some recent works including the specification of subsampling scheme, cross-validation method and measures of
agreement quantifying the degree of a clustering solution stability.
In order to obtain the different samples to test clustering stability we can, successively, draw, with replacement or not, a random sample (with size ) of the data set (with size
).
When using bootstrap (the points of each sample drawn with replacement) we usually have and the clustering obtained with the original data set is compared with the clusterings derived from the boostrap samples. The comparison is then based on the points of the data set that are also in the samples. A disadvantage of bootstrap, in the context of clustering, is the possible occurrence of multiple points, which the algorithm can consider as mini-clusters (Monti et al., 2003).
When the points of each sample are drawn without replacement (subsetting) we can decide to obtain overlapping or disjoint samples (splits of the data set). In both cases we must decide about the sample size ( ). It is worthwhile to note that if the training sample size is too small, the structure of the data set can be overlooked. In general, we can consider (as a rule of thumb), a fraction of points of the data set sampled over 0.5 to anticipate the same general clustering structure in the subsamples (Ben-Hur et al., 2002).
When comparing two clustering solutions arising from overlapping samples, the data points which belong to both samples can be used to evaluate the agreement between the clusterings.
On Clustering Stability
6 When evaluating the agreement between two clustering solutions arising from different (disjoint) samples we have to transfer the solutions to a common sample (typically one of the original samples) so that we can measure their agreement. Such transfer may be accomplished by a cross-validation procedure.
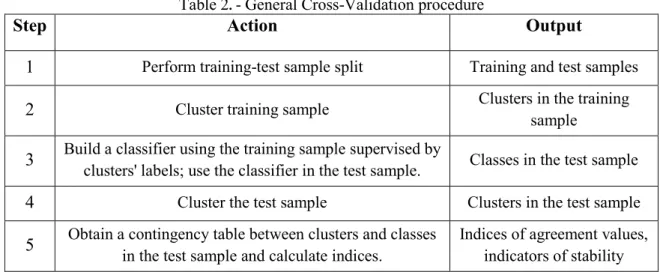
The use of cross-validation in the context of clustering evaluation is first proposed by (McIntyre and Blashfield 1980) and (Breckenridge 1989). They import a methodology commonly used in supervised analysis to the domain of unsupervised analysis - Table 2.- At the end of the cross-validation procedure, the value of an index of agreement (obtained in an holdout sample or test sample) between clustering results and supervised classification (by clusters in the training sample), is used as an indicator stability – see Indices of Agreement between partitions, p. 7.
Table 2. - General Cross-Validation procedure
Step Action Output
1 Perform training-test sample split Training and test samples
2 Cluster training sample Clusters in the training sample
3 Build a classifier using the training sample supervised by clusters' labels; use the classifier in the test sample. Classes in the test sample
4 Cluster the test sample Clusters in the test sample
5 Obtain a contingency table between clusters and classes in the test sample and calculate indices. Indices of agreement values, indicators of stability
In this work, we resort to the weighted cross-validation procedure proposed in (Cardoso et al., 2010) to evaluate the stability of clustering solutions. The use of a weighted sample overcomes the need for selecting a classifier when performing cross-validation. Furthermore, sample dimension is not a severe limitation for implementing clustering stability evaluation, since the Indices of agreement values are based on the entire (weighted) sample, and not in a holdout sample – (Amorim and Cardoso, 2015b). Studies on clustering stability summarized in Table 1 point out some issues. For example:
- “The stability of the clustering solution varies with the number of clusters that are inferred.” - (Lange et al., 2004: 1302);
CHAPTER 1: Introduction
7 - Cluster structures can be recovered although no natural clusters exist in the data – e.g. (Dolnicar and Leisch, 2010; Steinley and Brusco, 2011). In particular, “data structure (other than density clusters) can cause some number of clusters to produce more reproducible results than others.” - (Dolnicar and Leisch, 2010: 100). For example, ellipse data consisting of only one natural segment can be split into four segments in a stable manner.
In fact, despite the popularity of stability methods, its link to the underlying issue of clustering validity is still not well understood – e.g. (Shamir and Tishby, 2010; Dudoit and Fridlyand, 2002).
Luxburg (2009) discuss a series of theoretical results on clustering stability, namely the results obtained in (Ben-David et al., 2006; Ben-David et al., 2007; Ben-David and Luxburg, 2008; Shamir and Tishby, 2008a; Shamir and Tishby, 2008b) and in (Shamir and Tishby, 2010). Luxburg concludes that “While stability is relatively well-studied for the K-means algorithm, there does not exist much work on the stability of completely different clustering mechanisms.” (p. 271). In fact, (Ben-David et al., 2006) conclude that a clustering algorithm is stable if its objective function has a unique global minimizer. These authors also point out the (sub)sampling process as a source of instability and state that the instability decreases as sample sizes (m) grow. (Ben-David and Luxburg, 2008) contest the use of stability especially for large samples and end up concluding that “stability is useful in one respect: high instability can be used as an
alarm sign to distrust the clustering result, be it for sampling, algorithmic or other
reasons.” (p. 389). However, (Shamir and Tishby, 2008) show that even when the sample size increases the “convergence rate of clustering instability” may depend on K values used, the true K originating a faster convergence. These authors suggest the use the clustering distance (proportion of observations which are grouped into different clusters) scaled by √ , which rate of convergence dependent of K and is independent of the sample size used.
Indices of Agreement between partitions
Several similarity indices can be used to measure the agreement between two partitions of the same data - and with and groups, respectively - e.g. (Gower and Legendre, 1986; Milligan and Cooper, 1986). These indices are used in various domains
On Clustering Stability
8 namely, cluster validation, metaclustering, and consensus clustering - e.g. see (Jain et al., 1999; Krey et al., 2014).
A typology
When trying to measure similarity between two partitions one can resort to indices of association or simple agreement (ISA) or to indices of paired agreement (IPA), e.g. see (Cardoso, 2007; Warrens, 2008a). They are generally derived from the corresponding contingency table or cross-classification table [ ] (corresponding to and )
where and refer to the total row and column counts, respectively.
Indices of simple agreement are, essentially, measures of association between two nominal variables which indicate the two partitions and are based on the number of observation that both partitions integrate in the same group (or not) – ISA examples are presented in Table 3.
Table 3 - Indices of simple agreement
ISA Formula Reference
NMI1 Normalized mutual
information
Q K Q K P H , P H Min ) P ,I(P (Strehl and Gohosh,
2002)
NMI2 Normalized mutual
information
Q K Q K P H P H ) P , I(P(Strehl and Gohosh, 2002)
NMI3 Normalized mutual
information H
P H P ) P , 2I(P Q K Q K (Fred and Jain, 2003)
MIH information Mutual
ratio ( ) (
) ((Horibe, 1985), ((Kraskov et al., 2005)) NVI Variation of information
H
PK I(PK,PQ )
H
PQ I(PK,PQ )
(Meilã, 2007) The specific ISA examples considered (Table 3) are Mutual Information indices based in the concept of entropy. The entropy of a partition ( ) quantifies the uncertainty about which cluster an individual randomly selected from the data set belongs to.( ) ∑ . / (1) Usar nk+ e não nk. (coerente com anterior definição)
CHAPTER 1: Introduction
9 and Mutual information is defined by:
( ) ∑ ∑
( ⁄ ) (2)
It quantifies the information shared between two partitions, of the same data set. Alternative normalizations may be considered for ( ) as illustrated in Table 3. Note that the ( ) referred in is the entropy corresponding to the joint distribution of and
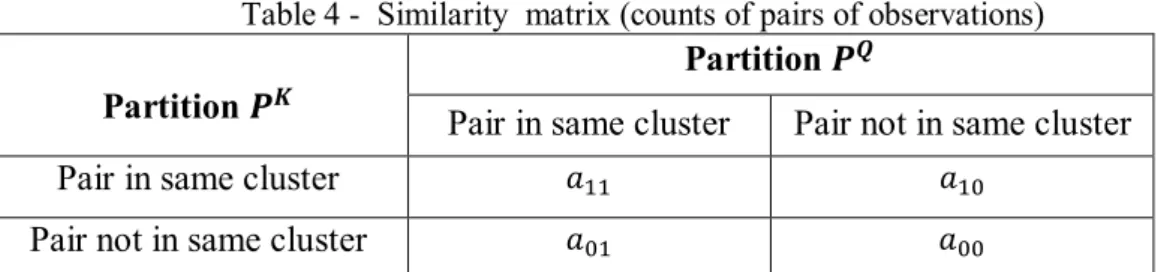
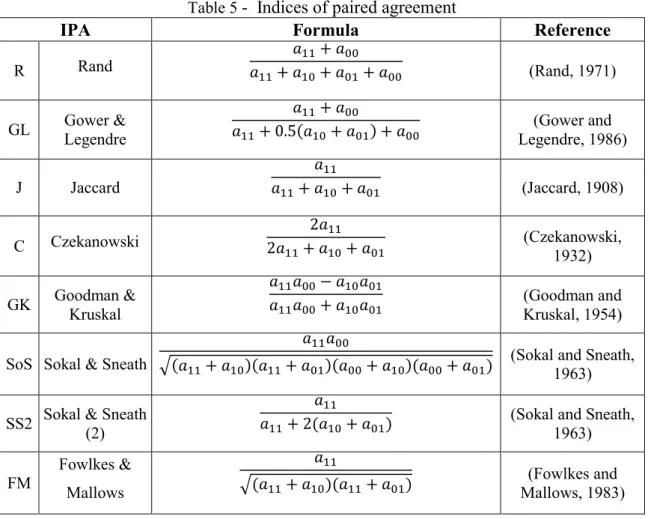
Indices of paired agreement are based on the number of pairs of observations that both partitions allocate (or not) to the same cluster and can also be written based on the elements of a similarity matrix (see Table 4). IPA examples are shown in Table 5.
Table 4 - Similarity matrix (counts of pairs of observations) Partition Pair in same cluster Partition Pair not in same cluster
Pair in same cluster
Pair not in same cluster
Finally, it is worthwhile to note that the indices of agreement between two partitions can be used not only to evaluate the stability of clustering results - resorting to diverse (sub)sampling schemes as illustrated in the literature review (Table 1) - but also to evaluate their validity, comparisons being referred to a priori known classes.
The adjustment of indices for excluding agreement by chance
Consider the cross-classification Table 6 a). The agreement between partions as sets of disjoint classes * + , and * + can be quantified resorting, for example, to the Rand index that equals 0.525. However, under the H0 hypothesis of agreement by
chance (assuming that the 2 partitions are constituted at random) the counts in the cross-classification table can be obtained by ( ) - see Table 6 b). In this
situation the Rand index value is 0.494, which is only slightly below the previously obtained value. This fact makes us wonder if the agreement quantified in Table 6 a).
On Clustering Stability
10
Table 5 - Indices of paired agreement
IPA Formula Reference
R Rand
(Rand, 1971)
GL Gower & Legendre
( ) Legendre, 1986) (Gower and
J Jaccard (Jaccard, 1908) C Czekanowski (Czekanowski, 1932) GK Goodman & Kruskal
(Goodman and Kruskal, 1954) SoS Sokal & Sneath
√( )( )( )( ) (Sokal and Sneath, 1963) SS2 Sokal & Sneath (2)
( ) (Sokal and Sneath, 1963) FM Fowlkes & Mallows
√( )( ) Mallows, 1983) (Fowlkes and
relates to a “ground truth” discovered by both partitions or it is due to chance. One should then have means to exclude the chance agreement from the Rand value. Using all the possible tables with identical marginal totals - see Table 11 - one easily finds the average Rand value (0.500).
Table 6 – a) Cross-classification data between two binary partitions (left) b) Cross-classification data between two binary partitions constituted at random (right)
C’1 C’2 Totals C1 30 20 50 C2 10 20 30 Totals 40 40 80 C’1 C’2 Totals C1 25 25 50 C2 15 15 30 Totals 40 40 80
The subtraction of the Rand from the average 0.500, followed by a convenient normalization yields the adjusted Rand index value – 0.051 – which is obtained replacing by Rand in formula (3). It quantifies the relative agreement increase compared to agreement by chance.
CHAPTER 1: Introduction
11 ( ) ( ) , (
, ( )- , ( )-
(3)
The fact that, in the Table 6 example the number of cross-classification tables with identical marginals is treatable, turns the calculation of ( ) easy and extendable to various indices – see Table 7. However, for realistic problems the dimension of cross-classification tables undermines this method of calculation.
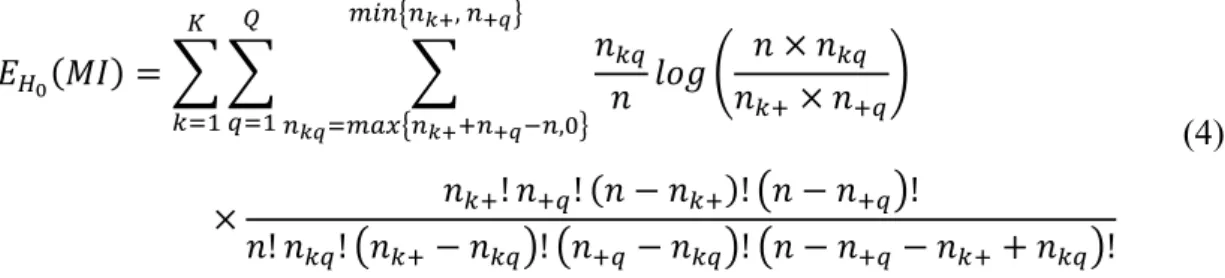
Several contributions are known to address the adjustment of indices of agreement which can be roughly categorized into: distributional approaches (DIST) and approximation methods (APPROX). The works on distributional approaches for the IPA indices can be viewed within the L family framework proposed by (Albatineh et al., 2006; Warrens, 2008; Warrens, 2008a). For example, the Rand and indices adjustment is presented in Appendix C p.87. For the ISA mutual information index, the expected value, under H0, is obtained by (Vinh et al., 2010):
( ) ∑ ∑ ∑ { } { } ( ) ( ) ( ) ( ) ( ) ( ) (4)
Alternative approximation approaches are suggested in (Albatineh and Niewiadomska-Bugaj, 2011) resorting to regression models - (Amorim and Cardoso, 2015c). The results from DIST and APPROX methods referred to the data example at hand are presented in Table 7. The missing cells illustrate the lack of means to calculate the adjusted values of several indices of agreement.
Table 7 – Indices average and adjusted values, under Ho, obtained by different methods IA Averaged values IA observed Adjusted values
TABLES LIST DIST APPROX TABLES LIST DIST APPROX
Rand 0.500 0.500 0.525 0.051 0.051 GL 0.666 0.668 0.689 0.067 0.063 J 0.341 0.340 0.364 0.035 0.036 C 0.509 0.509 0.534 0.293 0.051 SoS 0.250 0.276 0.035 NMI1 0.010 0.01 0.051 0.042 0.042
On Clustering Stability
12
The proposed approach
Experiments on stability
In this work we focus on the role of clustering stability in the evaluation of a clustering solution. For this end, we design an experiment based on synthetic data sets, with a known clustering structure, generated under 18 different scenarios.
In order to exclude agreement by chance when measuring the accordance between two partitions or crisp clustering solutions, a new method is proposed – IADJUST – that resorts to a simulation approach- (Amorim and Cardoso, 2015c).
The experimental analysis addresses:
1. The comparison between the stability of two clustering algorithms: an Expectation-Maximization algorithm (Rmixmod package (Lebret et al, 2012) for the estimation of a general Gaussian mixture model – [PKLKCK] in (Biernacki et
al., 2006)) and a K-means algorithm ((Hartigan, 1975) algorithm implemented in the IBM SPSS Statistics software.)
2. The external validity of the clusterings obtained.
The IADJUST procedure
Given that in real examples is very difficult, or impossible, to obtain all tables, conditional on the row and column totals of the observed table (review Table 6 example), in the proposed method we resort to simulated cross-classification tables. The generation of tables is based on the Hypergeometric model. According to this model and given the values in the previous rows and columns, the conditional probability of the element of the cross-classification tables is given by the
Hypergeometric distribution, e.g. (Patefield, 1981), with parameters: ∑ (
∑
) (population size) ∑ (number of successes in the population)
and ∑ (sample size). Thus, the conditional expected value, under H0, of given previous entries and the row and column totals can be calculated.
The IADJUST procedure begins by calculating the values of an , associated to the observed cross-classification table (observed indices values). Then, 17,000 tables are generated according the probabilistic method referred previously. For each generated table, the values are determined. These simulated values enable obtaining (under
CHAPTER 1: Introduction
13 H0) the empirical distribution, the corresponding descriptive statistics (average, in
particular) and the p-values estimates, i.e. the ratio between the number of simulated values greater than or equal to the observed value (see table 4 in (Amorim and Cardoso, 2015c)). According to Agresti et al. (1979) the 17,000 trials enabling to obtain estimates of the p-values with 99% confidence.
In IADJUST procedure is described in (Amorim and Cardoso, 2015b) - table 5). It is implemented in R language.
Testing IADJUST
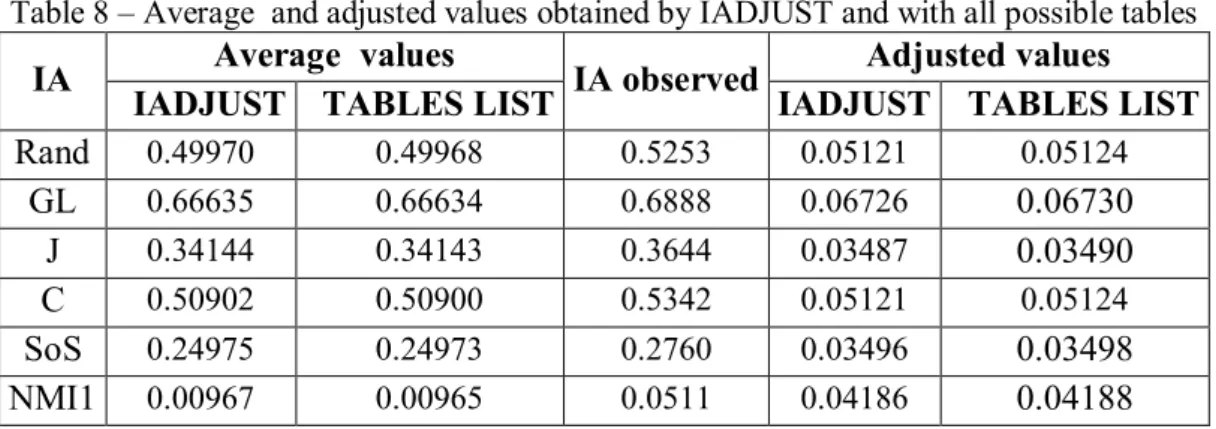
In order to evaluate the precision of IADJUST we compare its results with the ones derived from analytical and approximation approaches - (Amorim and Cardoso, 2015c). The results referred to example in Table 6 a) are presented in Table 8.
Table 8 – Average and adjusted values obtained by IADJUST and with all possible tables IA IADJUST TABLES LIST Average values IA observed IADJUST TABLES LIST Adjusted values
Rand 0.49970 0.49968 0.5253 0.05121 0.05124 GL 0.66635 0.66634 0.6888 0.06726 0.06730 J 0.34144 0.34143 0.3644 0.03487 0.03490 C 0.50902 0.50900 0.5342 0.05121 0.05124 SoS 0.24975 0.24973 0.2760 0.03496 0.03498 NMI1 0.00967 0.00965 0.0511 0.04186 0.04188
IADUST into practice
We use adjusted to measure the stability of clustering solutions in diverse scenarios and better understand the relationship with external validity. We also capitalize on the results from IADJUST to obtain new insights concerning the distributions of diverse under H0.
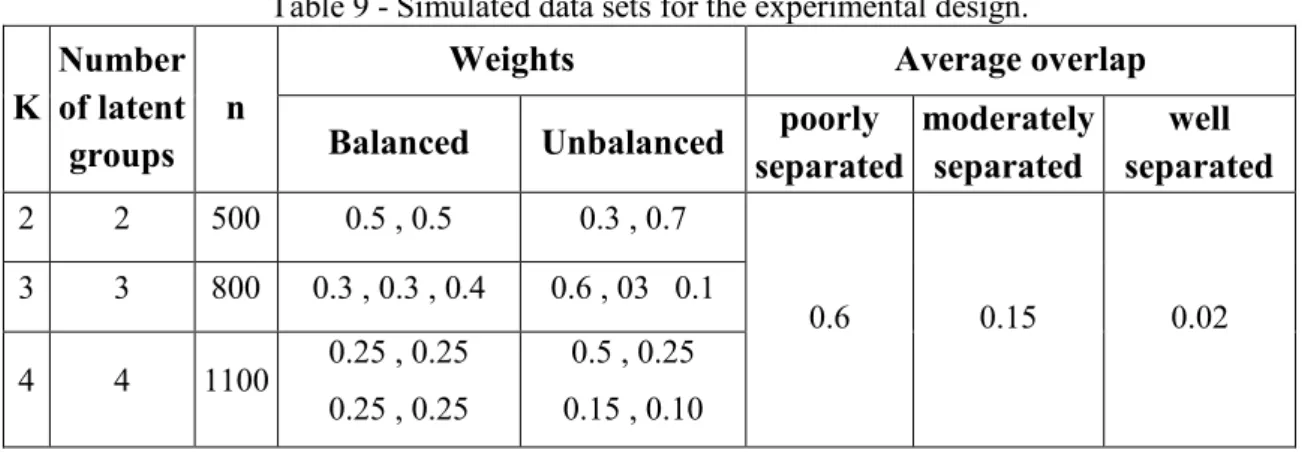
Simulated data sets
Experiments on stability rely on 540 simulated data sets. Design factors considered are the number of clusters, their balance and overlap (Table 9).
The increasing number of clusters is associated with increasing number of variables (2, 3 and 4 latent groups with 2, 3 and 4 Gaussian distributed variables) and, in order to
On Clustering Stability
14 deal with this increasing complexity, we consider data sets with 500, 800 and1100 observations, respectively.
We consider balanced settings (classes with similar dimensions) and unbalanced settings (classes with different a priori probabilities or weights).
Based on the measure of overlap between cluster adopted, (Maitra and Melnykov, 2010), we consider experimental scenarios with poorly separated, moderately separated and well separated clusters.
Table 9 - Simulated data sets for the experimental design. K Number of latent
groups n
Weights Average overlap
Balanced Unbalanced separated poorly moderately separated separated well
2 2 500 0.5 , 0.5 0.3 , 0.7 0.6 0.15 0.02 3 3 800 0.3 , 0.3 , 0.4 0.6 , 03 0.1 4 4 1100 0.25 , 0.25 0.25 , 0.25 0.5 , 0.25 0.15 , 0.10
In order to generate the datasets within the scenarios, we capitalize on the contribution in (Maitra and Melnykov, 2010) and use the R MixSim package to generate structured data according to a finite Gaussian mixture model.
Real data sets
Experiments are also made resorting to real data with an a priori known clustering structure. The data sets used are found in the UCI Machine Learning Repository (Bache and Lichman, 2013) and summarized in Table 10.
CHAPTER 1: Introduction
15
Table 10 – Real data sets.
Data set n Features Classes Overlapping Liver
Disorders 345 6 C1 (145) C2 (200) 0.016
Wholesales 440 6 C1 (298) C2 (142) 0.111
Iris 150 4 Versicolor (50) Setosa (50)
Virginica (50) 0.518 Wine recognition data 178 12 C1 (59) C2 (71) C3 (48) 0.002 Cars Silhouette 846 18 Bus (218) Saab (217) Opel (212) Van (199) 0.044 User Modeling 258 5 Very-low (24) Low (83) Middle (88) High (63) 0.028
A thesis Guide
The thesis chapters refer to the publications that are the result of the research conducted. The first publication “Clustering Cross-validation and Mutual Information Indices” applies the proposed IADJUST method to four Mutual Information indices in order to evaluate the agreement of clustering solutions with ground truth and also their stability. Based on this work we tuned the experimental scenarios to consider. The second publication “Paired Indices for Clustering Evaluation - Correction for Agreement by Chance” applies IADJUST to eight paired indices of agreement and goes one step further in evaluating the comparative performance of IADJUST with analytical and approximation approaches. The third paper “Comparing clustering solutions: the use of adjusted paired indices” capitalizes on the experimental work of the previous publication and adds theoretical support. It also produces a set of interesting results on the comparative performance of each index within experimental scenarios and also on the distributions of indices under the assumption of agreement by chance. Finally, the paper “Clustering stability and ground truth: numerical experiments” (Proceedings and
On Clustering Stability
16 Paper publications) gathers the simple and paired-agreement views to evaluate the relationship between the clustering solutions agreement with ground truth and their stability. A Mutual Information index ( in Table 3) and the Adjusted Rand index provide new insights into this relationship within and inter scenarios.
77
CHAPTER
7
- CONCLUSIONS AND FUTURE WORK
Conclusions and discussion
Data Analysis and Results
The analysis conducted first aims at providing adequate tools for the evaluation of clustering stability. The methodology proposed relies on the use of weighted cross-validation and resorts to several indices of agreement as indicators of stability.
In order to exclude agreement by chance when measuring the accordance between two partitions or crisp clustering solutions, a new method is proposed – IADJUST – that resorts to a simulation approach. This new approach overcomes limitations recognized in the literature and provides the correction of virtually any index of agreement based on cross-classification data.
The precision of IADJUST is illustrated by resorting to indices with known analytical solutions for correction – (Albatineh et al., 2006; Warrens, 2008b; Vinh et al., 2010a). We conclude that there is a negligible difference between these analytical averages and the averages provided by IADJUST– (Amorim and Cardoso, 2015c) and results of the example, in Table 8.
IADJUST is then used for correcting new indices and also to provide new insights on the indices distributions under the hypothesis of agreement by chance – (Amorim and Cardoso, 2014).
Through this contribution we make viable the correction of indices of agreement and clearly show the relevance of this adjustment, particularly for some indices – e.g. the NVI (simple) and the Gower & Legendre (paired) indices are the most affected by the adjustment. We thus advocate that the use of corrected indices of agreement should be a common practice, as opposed to the use of non-adjusted ones, not only when referring to clustering evaluation but also in the domain of consensus clustering.
What about stability
In this work we focus on the role of clustering stability in the evaluation of a clustering solution. For this end, we design an experiment in which 540 synthetic data sets are
On Clustering Stability
78 generated under 18 different scenarios. Design factors considered are the number of clusters, their balance and overlap.
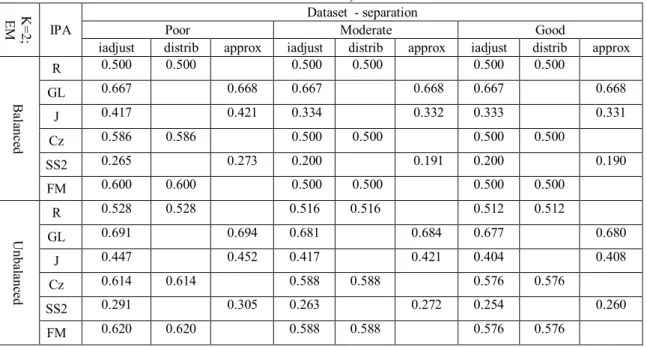
Illustrating the usefulness of the IADJUST approach, we compare the stability of two clustering algorithms - (Amorim and Cardoso, 2012). According to the obtained results for the balanced data sets, the KM clustering results exhibit more stability then the EM results. However, the EM solutions are more stable when referring to the unbalanced data sets.
Finally, we address the relationship between the stability of a clustering solution and its external validity. A macro-view of the results obtained does not contradict the current theory since it shows there is a strong correlation between stability and external validity when the aggregate results are considered (all scenarios‟ results). However, within a specific experimental scenario (when a practical clustering task is considered), we find no relationship between stability and agreement with ground truth - (Amorim and Cardoso, 2015a). This is a new perspective on the relationship between clustering stability and its external validity. To our knowledge, is the first time a study distinguishes between the macro view (all experimental scenarios considered) and the micro view (considering a specific clustering problem). Nevertheless, and despite the results obtained, it is still true that an unstable solution is, for this very reason, undesirable: if not, which results should the practitioner consider?
This thesis work gave rise to a series of contributions that have materialized in several conferences presentations (Appendix D) as well as paper publications – Chaper 2, Chaper 3, Chaper 4, Chaper 5 and Chaper 6.
Future work
The investment in the IADJUST method should, in the near future, lead to make the software available on R, writing a new package, contributing to CRAN. This package should eventually extend the list of indices of agreement (simple and paired) considered in this work. Following the conclusions drawn about the indices distribution under the hypothesis of agreement by chance, the IADJUST procedure should be able to rely not only in the indices average values, but also in the median values (under H0).
CHAPTER 7 - Conclusions and future work
79 In future works, a now more informed selection of indices of agreement may offer different perspectives on the agreement between partitions and thus of clustering stability. A new typology of indices of agreement will be a natural outcome of the present study.
Future research should also address the stability of results in discrete clustering. And, when studying the relationship between stability and validity, additional experimental factors may also be considered (e.g., the “ground truth” clusters‟ entropy).
On Clustering Stability
80
REFERENCES
Agresti, A., Wackerly, D. & Boyett, J. M. (1979), Exact conditional tests for cross-classifications: approximation of attained significance levels, Psychometrika 44, 75-83.
Albatineh, A. N. & Niewiadomska-Bugaj, M. (2011), Correcting Jaccard and other similarity indices for chance agreement in cluster analysis, Adv. Data Anal. Classification 5, 179-200.
Albatineh, A. N., Niewiadomska-BUgaj, M. & Mihalko, D. (2006), On Similarity Indices and Correction for Chance Agreement, Journal of Classification 23, 301-313.
Alizadeh, H., Mimaei-Bidgoli, B. & Parvin, H. (2014), To improve the quality of cluster ensembles by selecting a subset of base clusters, Journal of Experimental and Theoretical Artificial Intelligence 26, 127-150.
Amorim, M. J. & Cardoso, M. G. M. S. (2014), Paired Indices for clustering Evaluation. Correction for Agreement by Chance, Proceedings of the 16th International
Conference on Enterprise Information Systems, Lisboa, Portugal, 164-170.
Amorim, M. J. & Cardoso, M. G. M. S. (2015a), Clustering stability and ground truth: numerical experiments, Proceedings of the 7th International Joint Conference on
Knowledge Discovery, Knowledge Engineering and Knowledge Management (IC3K), Lisboa, Portugal, 259-264.
Amorim, M. J. & Cardoso, M. G. M. S. (2015b), Clustering stability and ground truth: numerical experiments, International Journal of Artificial Intelligence and Knowledge Discovery, to appear.
Amorim, M. J. & Cardoso, M. G. M. S. (2015c), Comparing clustering solutions: The use of adjusted paired indices, Intelligent Data Analysis 19, 1275–1296.
Amorim, M. J. P. C. & Cardoso, M. G. M. S.(2012), Clustering cross-validation and mutual information indices. Proceedings of the 20th International Conference on Computational Statistics (COMPSTAT), Limassol, Cyprus, 39-52.
Bache, K. & Lichman, M. (2013) UCI Machine Learning Repository [Online]. Irvine, CA: University of California, School of Information and Computer Science, Available: http://archive.ics.uci.edu/ml.
Ben-David, S. & Luxburg, U. V. (2008), Relating clustering stability to properties of cluster boundaries. Proceedings of the 21th Annual Conference on Learning Theory (COLT), Berlin, Germany, 379-390.
Ben-David, S., P´al, D. A. & Simon, H. U. (2007), Stability of k-Means Clustering Proceedings of the 20th Annual Conference on Learning Theory (COLT), 20–34.
Ben-David, S., Simon, H. U. & P´al, D. A. A (2006), Sober Look at Clustering Stability. Proceedings of the Annual Conference on Computational Learning Theory, 5–19.
References
81 Ben-Hur, A., Elisseeff, A. & Guyon, I. (2002), A stability based method for discovering
structure in clustered data, Pacific Symposium on Biocomputing 7, 6-17.
Biernacki, C., Celeux, G., Govaert, G. & Langrognet, F. (2006), Model-Based Cluster and Discriminant Analysis with the MIXMOD Software, Computational Statistics and Data Analysis 51, 587-600.
Breckenridge, J. (1989), Replicating Cluster Analysis: Method, Consistency and Validity, Multivariate Behavioral Research 24, 147-161
Cardoso, M. G. M. S. (2007), Clustering and Cross-Validation. IASC 07 - Statistics for Data Mining, Learning and Knowledge Extraction, 32 (CD-ROM).
Cardoso, M. G. M. S. & Carvalho, A. P. d. L. F. (2009), Quality Indices for (Practical) Clustering Evaluation, Intelligent Data Analysis 13, 725-740.
Cardoso, M.G., K. Faceli, & A.C. de Carvalho (2010), Evaluation of Clustering Results: The Trade-off Bias-Variability, in Classification as a Tool for Research, Springer, 201-208.
Cheng, R. & Milligan, G. W. (1996), Measuring the Influence of Individual. Data Points in a Cluster Analysis, Journal of Classification 13, 315-335.
Cohen, J. (1960), A coefficient of agreement for nominal scales. Educational and Psychological Measurement 51, 821-828.
Czekanowski, J. (1932), "Coefficient of racial likeness" and "durchschnittliche Differenz", Anthropologischer Anzeiger 14, 227-249.
Dolnicar, S. & Leisch, F. (2010), Evaluation of structure and reproducibility of cluster solutions using the bootstrap, Market Lett 21, 83–101.
Dudoit, S. & Fridlyand, J. (2002), A prediction-based resampling method for estimating the number of clusters in a dataset, Genome Biology 3, 1-21.
Everit, B., Landau, S. & Leese, M. (2001), Cluster Analysis. London. UK, Edward Arnold.
Fang, Y. & Wang, J. (2012), Selection of the number of clusters via the bootstrap method, Computational Statistics and Data Analysis 56, 468–477.
Fowlkes, E. B. & Mallows, C. L. (1983), A Method for Comparing Two Hierarchical Clusterings, Journal of the American Statistical Association 78, 553-569.
Fraley, C. & Raftery, A. E. (1998), How Many Clusters? Which Clustering Method? Answers Via Model-Based Cluster Analysis, The Computer Journal 41, 578-588. Fred, A. & Jain, A. K. (2003), Robust Data Clustering. IEEE Computer Society
Conference on Computer Vision and Pattern Recognition. USA.
Goodman, L. A. & Kruskal, W. H. (1954), Measures of Association for Cross Classifications, Journal of the American Statistical Associations 49, 732-764. Gordon, A. D. (1999), Classification. Chapman & Hall/CRC.
On Clustering Stability
82 Gower, J. C. & Legendre, P. (1986), Metric and Euclidean Properties of Dissimilarity
Coefficients, Journal of Classification 3, 5-48.
Halkidi, M., Batistakis, Y., & Vazirgiannis, M. (2001), On Clustering Validation Techniques, Journal of Inteligent Information Systems 17, 107-145.
Halton, J. H. (1969), A Rigorous Derivation of the Exact Contingency Formula, Proc. Camb. Phil. Soc. 65, 527-530.
Hartigan, J. A. (1975) Clustering algorithms.
Hennig, C. (2007), Cluster-wise assessment of cluster stability, Computational Statistics & Data Analysis 52, 258-271.
Hennig, C. & Liao, T. F. (2013), How to find an appropriate clustering for mixed type variables with application to socio-economic stratification, Appl. Statist. 62, 309– 369.
Hubert, L. & arabie, P. (1985), Comparing partitions, Journal of Classification 2, 193-218.
Jaccard (1908), Nouvelles recerches sur la distribuition florale, Bulletin de la Societé Vaudoise de Sciences Naturells 44, 223-370.
Jain, A. K. & Dubes, R. C. (1988), Algorithms for clustering data. Englewood Cliffs, N.J.: Prentice Hall.
Jain, A. K., Murty, M. N. & Flynn, P. J. (1999), Data Clustering: A Review. ACM Computing Surveys 31, 264-323.
Krey, S., Bratob, S., Liggesa, U., Götzeb, J. & Weihsa, C. (2015), Clustering of electrical transmission systems based on network topology and stability, Journal of Statistical Computation and Simulation 85, 47–61.
Krey, S., Ligges, U. & Leisch, F. (2014), Music and timbre segmentation by recursive constrained K-means clustering, Computational Statistics 29, 37-50.
Lange, T., Roth, V., Braun, M. L. & Buhmann, J. M. (2004), Stability-Based Validation of Clustering Solutions, Neural Computation 16, 1299–1323.
Luxburg, U. V. (2009), Clustering Stability: An Overview, Machine Learning 2, 235-274.
Maitra, R. & Melnykov, V. (2010), Simulating data to study performance of finite mixture modeling and clustering algorithms, Journal of Computational and Graphical Statistics 19 354-376.
Marateb, H. R., Mansourian, M., Adibi , P. & Farina, D. (2014), Manipulating measurement scales in medical statistical analysis and data mining: A review of methodologies, Journal of Research in Medical Sciences 19, 47-56.
Meilã, M. (2007), Comparing Clusterings - an information based distance, Journal of Multivariate Analysis 98, 873-895.
References
83 McIntyre, R.M. & Blashfield, R. K. (1980), A nearest-centroid technique for evaluating the minimum-variance clustering procedure, Multivariate Behavioral Research 2, 225-238.
Milligan, G. W. & Cooper, M. C. (1986), A study of the comparability of external criteria for hierarchical cluster analysis, Multivariate Behavioral Research 21, 441-458.
Mirkin, B. (1996), Mathematical Classification and Clustering. Dordrecht /Boston/ London,Kluwer Academic Plublishers.
Monti, S., Tamayo, P., Mesirov, J. & Golub, T. (2003), Consensus Clustering: A Resampling-Based Method for Class Discovery and Visualization of Gene Expression Microarray Data, Machine Learning 52, 91-118.
Müller, H. & Hamm, U. (2014), Stability of market segmentation with cluster analysis – A methodological approach, Food Quality and Preference 34, 70-78.
Pascual, D., Pla , F. & Sánchez, J. S. (2010), Cluster validation using information stability measures, Pattern Recognition Letters 31, 454-461.
Patefield, W. M. (19819, Algorithm As159: An Efficient Method of Generating Random R * C Tables with Given Row and Column Totals. Roayal Statistical Society, Series c, Applied Statistics 30, 91-97.
Rand, W. M. (1971), Objective criteria for the evaluation of clustering methods, Journal of the American Statistical Association 66, 846-850.
Ravera, O. (2001), A comparison between diversity, similarity and biotic indices applied to the macroinvertebrate community of a small stream: the Ravella river (Como Province, Northern Italy), Aquatic Ecology 35, 97–107.
Roth, V., Braun, M. L., Lange, T. & Buhmann, J. M. (2002), Stability-Based Model Order Selection in Clustering with Applications to Gene Expression Data. J.R. Dorronsoro (Ed.): ICANN 2002, LNCS 2415, 607–612.
Shamir, O. & Tishby, N. (2008a), Cluster stability for finite samples, In: J. C. PLATT, D. K., Y. SInger & S. Roweis ed. Advances in neural information processing systems, Cambridge:MIT Press., 1297–1304.
Shamir, O. & Tishby, N.(2008b), Model Selection and Stability in k-means clustering, Proceedings of the 21th Annual Conference on learning theory, Helsinki, Finland,.
Cambridge: MIT Press, 67–378.
Shamir, O. & Tishby, N. (2010), Stability and model selection in k-means clustering. Mach. Learn. 80, 213-244.
Sokal, R. R. & Sneath, P. H. (1963), Principles of Numerical Taxonomy. San Francisco CA:Freeman.
Steinley, D. & Brusco, M. J. (2011), Choosing the Number of Clusters in K-Means Clustering, Psychological Methods 16, 285–297.
On Clustering Stability
84 Strehl, A. & Gohosh, J. (2002), Cluster Ensembles- a Knowledge Reuse Framework for
Combinig Partitions, Journal of Machine Learning Research 3, 583-617.
Todeschini, R., Consonni, V., Xiang, H., Holliday, J., Buscema, M. & Willett, P. (2012), Similarity Coefficients for Binary Chemoinformatics Data: Overview and Extended Comparison Using Simulated and Real Data Sets, Journal of Chemical Information and Modeling 52, 2884−2901.
Vendramin, L., Campello, R. J. & Hruschka, E. R. (2010), Relative clustering validity criteria: A comparative overview, Statistical Analysis and Data Mining 3, 209-235. Vinh, N. X., Epps, J. & Bailey, J. (2010), Information theoretic measures for clusterings
comparison: Variants, properties, normalization and correction for chance, The Journal of Machine Learning Research 11, 2837-2854.
Wang, J. (2010), Consistent selection of the number of clusters via crossvalidation, Biometrika 97, 893–904.
Warrens, M. J. (2008), On association coefficients for 2*2 tables and properties that do not depend on the marginal distributions, Psychometrika 73, 777-789.
Warrens, M. J. (2008a), On Similarity coefficients for 2*2 tables and correction for chance, Psycometrica 73, 487-502.
Wu, Hang-Ming (2011), On biological validity indices for soft clustering algorithms for gene expression data, Computational Statistics and Data Analysis 55, 1969-1979.
Appendix A: the EXACT adjustment of the Rand INDEX
85
APPENDIX
A
: THE EXACT ADJUSTMENT OF THE RAND
INDEX
Under H0, the probability, conditional on the row and column totals, of observing a
specific cross-classification table (M) can be modeled by the Generalized Hypergeometric distribution (Halton, 1969),
( ) ∏ ∏ ∏ ∏
(5)
The total number of tables with identical row and column totals to the cross-classification in Table 6 a) can be easily listed considering that we have only one degree of freedom. For example, in order to keep the same marginal values the first element of the table must be between 40 and 10, change we get all possible tables.
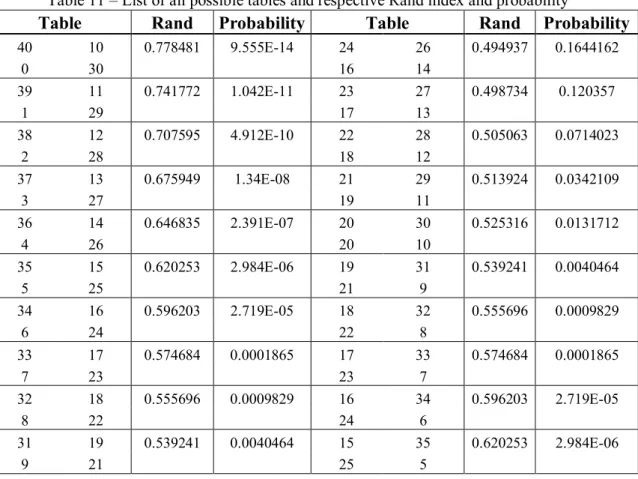
To calculate the average of the Rand index, we have to compute the Rand index value and the probability of each table (5). The results obtained are summarized in Table 11. The average is the sum of the values obtained by multiplying the index value by the probability.
Table 11 – List of all possible tables and respective Rand index and probability
Table Rand Probability Table Rand Probability
40 10 0.778481 9.555E-14 24 26 0.494937 0.1644162 0 30 16 14 39 11 0.741772 1.042E-11 23 27 0.498734 0.120357 1 29 17 13 38 12 0.707595 4.912E-10 22 28 0.505063 0.0714023 2 28 18 12 37 13 0.675949 1.34E-08 21 29 0.513924 0.0342109 3 27 19 11 36 14 0.646835 2.391E-07 20 30 0.525316 0.0131712 4 26 20 10 35 15 0.620253 2.984E-06 19 31 0.539241 0.0040464 5 25 21 9 34 16 0.596203 2.719E-05 18 32 0.555696 0.0009829 6 24 22 8 33 17 0.574684 0.0001865 17 33 0.574684 0.0001865 7 23 23 7 32 18 0.555696 0.0009829 16 34 0.596203 2.719E-05 8 22 24 6 31 19 0.539241 0.0040464 15 35 0.620253 2.984E-06 9 21 25 5
On Clustering Stability
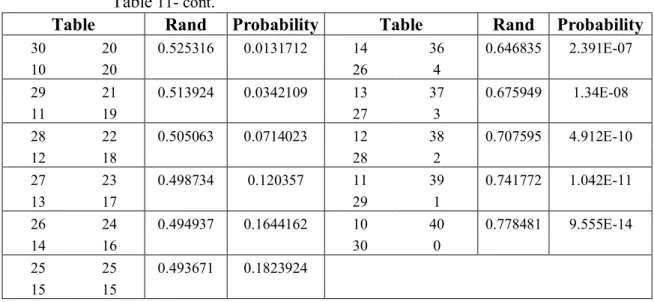
86 Table 11- cont.
Table Rand Probability Table Rand Probability
30 20 0.525316 0.0131712 14 36 0.646835 2.391E-07 10 20 26 4 29 21 0.513924 0.0342109 13 37 0.675949 1.34E-08 11 19 27 3 28 22 0.505063 0.0714023 12 38 0.707595 4.912E-10 12 18 28 2 27 23 0.498734 0.120357 11 39 0.741772 1.042E-11 13 17 29 1 26 24 0.494937 0.1644162 10 40 0.778481 9.555E-14 14 16 30 0 25 25 0.493671 0.1823924 15 15
Appendix B: the adjustment of the Rand and Czekanwski indices
87
APPENDIX
B
: THE ADJUSTMENT OF THE RAND AND
CZEKANWSKI INDICES
Considering the similarity matrix (counts of pairs of observations- Table 4:
∑ ∑ ( ) ∑ ∑ (6) ∑ ( ) ∑ ∑ ∑ (7) ∑ ( ) ∑ ∑ ∑ (8) . / (9)
- totals of pairs which are placed in the same clusters according to both partitions. - totals of pairs which are placed in different clusters according to both partitions.
- total numbers of agreements.
. / ∑ ∑ . / *∑ . / ∑ . / + (10)
∑ ( ) -totals of pairs which are placed in the same clusters of
partition .
∑ ( ) - totals of pairs which are placed in the same clusters of
partition
( ) ∑ ( ) and ( ) ∑ ( )
On Clustering Stability 88 ( ) ( )( ) (∑ ∑ . / ) ∑ ( ) ∑ ( ) ( ) (11) ( ) . / (∑ ∑ . / ) *∑ . / ∑ . / + . / ∑ ( ) ∑ ( ) ( ) *∑ . / ∑ . / + (12)
The adjustment of the Rand index
The Rand index ( Table 5, p.9) is given by :
( ) ( ) ( ) ( ) ( ) ∑ ( ) ∑ ( ) ( ) [∑ ( ) ∑ ( ) ] ( ) ( ) ( ) ∑ ( ) ∑ ( ) ( ) [∑ ( ) ∑ ( ) ] ( ) ( ) ∑ ( ) ∑ ( ) ( )[∑ ( ) ∑ ( ) ] ( ) ∑ ( ) ∑ ( ) ( ) [∑ ( ) ∑ ( ) ] ( ) (13)
Appendix B: the adjustment of the Rand and Czekanwski indices
89 The adjusted index is ( )
( ) , where: ( ) ( ) ∑ ∑ . / 0∑ . / ∑ . / 1 ( ) ( ) ∑ . / ∑ . / ( ) 0∑ . / ∑ . / 1 ( ) ( ) ( ) ∑ ∑ . / ( ) 0∑ . / ∑ . / 1 ( ) ( ) ∑ . / ∑ . / ( ) 0∑ . / ∑ . / 1 ( ) ( ) ∑ ∑ . / ∑ . / ∑ . / ( )
using equation (14) the equation of can be rewritten:
(14) ( ) ∑ ∑ ( ) ∑ ( ) ∑ ( ) ( ) ∑ ( ) ∑ ( ) ( ) 0∑ ( ) ∑ ( ) 1 ( ) ( ) ∑ ∑ ( ) ∑ ( ) ∑ ( ) ∑ ( ) ∑ ( ) ( ) 0∑ ( ) ∑ ( ) 1 (15)
Equation (15) is Hubert and Arabie (1985):198)‟ equation 5.
The is equal to the index
The index, Cohen (1960), can be given by:
( )
( )( ) ( )( )
(16)
On Clustering Stability 90 ∑ ∑ . / *. / ∑ ∑ . / ∑ . / ∑ ∑ . / ∑ . / ∑ ∑ . / + . / ∑ ∑ . / ∑ ∑ . / ∑ . / ∑ ∑ . / ∑ . / (∑ ∑ . / ) (17) (∑ . / ∑ ∑ . / ) (∑ . / ∑ ∑ . / ) ∑ . / ∑ . / ∑ ∑ . / ∑ . / ∑ ∑ . / ∑ . / (∑ ∑ . / ) (18)