UNIVERSIDADE DE LISBOA FACULDADE DE CIÊNCIAS DEPARTAMENTO DE FÍSICA
Small Animal PET Imaging Using GATE Monte Carlo
Simulations: implementation of physiological and metabolic
information
Susana Evaristo de Oliveira Branco Silva
DOUTORAMENTO EM ENGENHARIA BIOMÉDICA E BIOFÍSICA
UNIVERSIDADE DE LISBOA FACULDADE DE CIÊNCIAS DEPARTAMENTO DE FÍSICA
Small Animal PET Imaging Using GATE Monte Carlo
Simulations: implementation of physiological and metabolic
information
Susana Evaristo de Oliveira Branco Silva
Thesis supervised by:
Professor Dr. Pedro Miguel Dinis de Almeida Instituto de Biofísica e Engenharia Biomédica
Departamento de Física da Faculdade de Ciências da Universidade de Lisboa Dr. Sébastien Jan
Service Hospitalier Frédéric Joliot, Institut d’Imagerie Biomédicale
Direction des Sciences du Vivant, Commissariat à l’Énergie Atomique, Orsay, France
DOUTORAMENTO EM ENGENHARIA BIOMÉDICA E BIOFÍSICA
Resumo
O rato/ratinho de laboratório é o modelo animal de escolha para o estudo dos processos fun-damentais associados a determinadas patologias, como o cancro. Esta escolha deve-se a uma gama de factores que incluem uma grande homologia genética com o Homem. Assim sendo o rato/ratinho é amplamente utilizado em laboratórios por todo o Mundo para estudo dos processos celulares básicos associados á doença e à terapia. A comunidade laboratorial tem, nos últimos anos, desenvolvido um grande interesse pela imagiologia não-invasiva destes animais. De entre as diversas tecnologias de imagem aplicadas aos estudosin vivo de pequenos animais, a Tomografia por Emissão de Positrões (PET) permite obter informação sobre a distribuição espacial e temporal de moléculas marcadas com átomo emissor de positrões, de forma não invasiva.
Os traçadores utilizados para obter esta “imagem molecular” são administrados em baixas quan-tidades, de tal forma que os processos biológicos que envolvem concentrações da ordem do nano molar, ou mesmo inferiores, podem ser determinadas sem perturbar o processo em estudo. Muitas combinações de diferentes moléculas com diferentes radionúclidos permitem traçar uma gama de caminhos moleculares específicos (e.g. processos biológicos de receptores e síntese de trans-missores em caminhos de comunicação em células, processos metabólicos e expressão genética). A imagem pode ser executada repetidamente antes e depois de intervenções permitindo o uso de cada animal como o seu próprio controlo biológico.
A investigação já realizada em curso que aplicam a PET ao estudos de pequenos animais, tem per-mitido compreender, entre outras coisas, a evolução de determinadas doenças e suas potenciais terapias. Contudo, existem algumas dificuldades de implementação desta técnica já que a inform-ação obtida está condicionada pelos fenómenos físicos associados à interacção da radiinform-ação com a matéria, pelos instrumentos envolvidos na obtenção da informação e pela própria fisiologia do animal (por exemplo o seu movimento fisiológico). De facto, a fiabilidade da quantificação das im-agens obtidas experimentalmente, em sistemas PET dedicados aos pequenos animais, é afectada ao mesmo tempo pelos limites de desempenho dos detectores (resolução espacial e em energia, sensibilidade, etc.), os efeitos físicos como a atenuação e a dispersão, que perturbam a recon-strução da imagem, e os efeitos fisiológicos (movimentos do animal). Na prática estes efeitos são corrigidos com métodos de correcção específicos com a finalidade de extrair parâmetros quantit-ativos fiáveis. Por outro lado, as características fisiológicas dos animais a estudar e a necessidade da existência de animais disponíveis, são factores adicionais de complexidade.
Recentemente, tem sido dedicada alguma atenção aos efeitos resultantes dos movimentos fisioló-gicos, nomeadamente do movimento respiratório, na qualidade das imagens obtidas no decurso de um exame PET. Em particular, no caso do estudo dos tumores do pulmão (algo infelizmente muito frequente em humanos), o movimento fisiológico dos pulmões é uma fonte de degradação das im-agens PET, podendo comprometer a sua resolução e o contraste entre regiões sãs e doentes deste orgão. A precisão quantitativa na determinação da concentração de actividade e dos volumes fun-cionais fica assim debilitada, sendo por vezes impedida a localização, detecção e quantificação do radiotraçador captado nas lesões pulmonares. De modo a conseguir diminuir estes efeitos, existe a necessidade de melhor compreender a influência deste movimento nos resultados PET.
Neste contexto, as simulações Monte Carlo são um instrumento útil e eficaz de ajuda à optimiza-ção dos componentes dos detectores existentes, à concepoptimiza-ção de novos detectores, ao
desenvolvi-mento e à avaliação de algoritmos de reconstrução e de métodos de correcção dos efeitos físicos. Baseados em modelos matemáticos dos processos físicos, químicos e, sempre que possível, bio-lógicos, os métodos de simulação Monte Carlo são, desde há muito, uma ferramenta privilegiada para a obtenção de informação fiável da previsão do comportamento de sistemas complexos e por maioria de razão, para uma sua melhor compreensão.
No contexto da Imagiologia Molecular, a plataforma de simulação Geant4 Application for Tomo-graphic Emission (GATE), validada para as técnicas de imagem de Medicina Nuclear, permite a simulação por Monte Carlo dos processos de obtenção de imagem. Esta simulação pode mesmo ser feita quando se pretende estudar a distribuição de emissores de positrões cuja localização varia ao longo do tempo. Adicionalmente, estas plataformas permitem a utilização de modelos computacionais para modelar a anatomia e a fisiologia dos organismos em estudo mediante a utilização de uma sua representação digital realista denominada de fantôma. A grande vantagem na utilização destes fantômas relaciona-se com o facto de conhecermos as suas características geométricas (“anatómicas”) e de podermos controlar as suas características funcionais (“fisioló-gicas”). Podemos assim obter padrões a partir dos quais podemos avaliar e aumentar a qualidade dos equipamentos e técnicas de imagem.
O objectivo do presente trabalho consiste na modelação e validação de uma plataforma de sim-ulação do sistema microPET® FOCUS 220, usado em estudos de PET para pequenos animais, utilizando a plataforma de simulação GATE. A metodologia adoptada procurou reproduzir de uma forma realista, o ambiente de radiação e factores instrumentais relacionados com o sistema de imagem, assim como o formato digital dos dados produzidos pelo equipamento. Foram usados modelos computacionais, obtidos por segmentação de imagem de exames reais, para a avaliação da quantificação das imagens obtidas. Os resultados obtidos indicam que a plataforma produz resultados reprodutíveis, adequados para a sua utilização de estudos de pequenos animais em PET.
Este objectivo foi concretizado estudando os efeitos combinados do tamanho das lesões, do rá-cio de concentração de actividade lesão-para-fundo e do movimento respiratório na recuperação de sinal de lesões esféricas localizadas no pulmão em imagens PET de pequenos animais. Para este efeito, foi implementada no código GATE uma representação digital em 4D de um ratinho de corpo inteiro (o fantôma MOBY). O MOBY permitiu reproduzir uma condição fisiológica que rep-resenta a respiração em condição de "stress", durante um exame típico de PET pequeno animal, e a inclusão de uma lesão esférica no pulmão tendo em conta o movimento da mesma. Foram real-izadas um conjunto de simulações estáticas e dinâmicas usando 2-Deoxy-[18F]fluoro-D-glucose (FDG) tendo em consideração diferentes tamanhos das lesões e diferentes captações deste radi-ofármaco. O ruído da imagem e a resolução temporal foram determinadas usando imagens 3D e 4D. O rácio sínal-para-ruído (SNR), o rácio contraste-para-ruído (CNR), a relação lesão-fundo (target-to-background activity concentration ratio- TBR), a recuperação de contraste (CR) e a recu-peração de volume (VR) foram também avaliados em função do tamanho da lesão e da actividade captada. Globalmente, os resultados obtidos demonstram que a perda de sinal depende tanto do tamanho da lesão como da captação de actividade na lesão. Nas simulações estáticas, onde não foi simulado movimento, os coeficientes de recuperação foram influenciados pelo efeito de volume parcial para os tamanhos mais reduzidos de lesão. Além disso, o aumento do contraste na lesão
produz um aumento significativo no desvio padrão da média de sinal recuperado resultando numa diminuição no CNR e no SNR. Também concluímos que o movimento respiratório diminui signific-ativamente a recuperação do sinal e que esta perda depende principalmente do tamanho da lesão. A melhor resolução temporal e resolução espacial foram obtidas nas simulações estáticas, onde não existia movimento envolvido.
Os resultados simulados mostram que o efeito de volume parcial é dominante nas lesões mais pequenas devido à resolução espacial do sistema FOCUS, tanto nas imagens estáticas como nas dinâmicas. Além disso, para concentrações baixas de radiofármaco existe uma dificuldade inerente em quantificar a recuperação de sinal nas lesões comprometendo a análise quantitativa dos dados obtidos.
Palavras-chave: Tomografia por Emissão de Positrões (PET); PET de Pequenos Animais; 4D
Mouse Whole-Body (MOBY); Geant4 Application for Tomographic Emission (GATE); Detectabilid-ade de Lesões Pulmonares; Quantificação de Imagem.
Abstract
Organ motion has become of great concern in medical imaging only recently. Respiratory motion is one source of degradation of PET images. Respiratory motion may lead to image blurring, which may result in reduced contrast and quantitative accuracy in terms of recovered activity concentration and functional volumes. Consequently, the motion of lungs hinders the localization, detection, and the quantification of tracer uptake in lung lesions. There is, therefore, a need to better understand the effects of this motion on PET data outcome.
Medical imaging methods and devices are commonly evaluated through computer simulation. Com-puter generated phantoms are used to model patient anatomy and physiology, as well as the ima-ging process itself. A major advantage of using computer generated phantoms in simulation studies is that the anatomy and physiological functions of the phantom are known, thus providing a gold standard from which to evaluate and improve medical imaging devices and techniques.
In this thesis, are presented the results of a research studied the combined effects of lesion size, lesion-to-background activity concentration ratio and respiratory motion on signal recovery of spher-ical lesions in small animal PET images using Monte Carlo simulation. Moreover, background activity is unavoidable and it causes significant noise and contrast loss in PET images. For these purposes, has been used the Geant4 Application for Tomographic Emission (GATE) Monte Carlo platform to model the microPET®FOCUS 220 system. Additionaly, was implemented the digital 4D Mouse Whole-Body (MOBY) phantom into GATE. A physiological “stress breathing” condition was created for MOBY in order to reproduce the respiratory mouse motion during a typical PET exam-ination. A spherical lung lesion was implemented within this phantom and its motion also modelled. Over a complete respiratory cycle of 0.37 s was retrieved a set of 10 temporal frames (including the lesion movement) generated in addition to a non-gated data set. Sets of static (non-gated data) and dynamic (gated data) 2-Deoxy-[18F]fluoro-D-glucose (FDG) simulations were performed consider-ing different lesion sizes and different activity uptakes. Image noise and temporal resolution were determined on 3D and 4D images. Signal-to-Noise Ratio (SNR), Contrast-to-Noise Ratio (CNR), Target-to-Background activity concentration Ratio (TBR), Contrast Recovery (CR) and Volume Re-covery (VR) were also evaluated as a function of lesion size and activity uptake.
Globally, the results obtained show that signal loss depends both on lesion size and lesion activity uptake. In the non-gated data, where was no motion included (perfect motion correction), the recov-ery coefficients were influenced by the partial volume effect for the smallest lesion size. Moreover, the increased lesion contrast produces a significant increase on the standard deviation of the mean signal recover. This led to a decrease in CNR and SNR. In addition, respiratory motion significantly deteriorates signal recovery and this loss depends mainly of the lesion size. Best temporal resolu-tion (volume recovery) and spatial resoluresolu-tion was given by the non-gated data, where no moresolu-tion is involved.
The simulated results show that the partial volume effect is dominant for small objects due to limited FOCUS system resolution in both 3D and 4D PET images. In addition, lower activity concentrations significantly deteriorates the lesion signal recovery compromising quantitative analysis.
(MOBY) Phantom; Geant4 Application for Tomographic Emission (GATE); Lung Lesion Detectabil-ity; Image Quantification.
Acknowledgments
... 1589 days after ...
... my last words goes to those who have contributed for this moment!
First of all, I would like to express my deepest gratitude to my supervisor Professor Pedro Almeida for all the support. For the, sometimes hard but always productive, discussions about this work and for giving me the freedom and strength to explore new ideas. It has been an honour to work with him throughout these years.
I wish to thank to Doctor Sébastien Jan for being my supervisor and for welcoming me at the Institut d’Imagerie BioMédicale (I2BM) research group of the Service Hospitalier Frédéric Joliot (SHFJ), a fantastic place to work with their advanced facilities and technologies which gave me the necessary tools to be able to complete my work and to achieve the results shown on this thesis.
I would also like to acknowledge my colleagues and all the persons with whom I had the privilege to work with at the SHFJ, namely Doctor Régine Trébossen, Doctor Claude Comtat, Frédéric Bataille, Florent Sureau and Yoann Fontyn.
To Doctor William Seagers who has guided my developments with the MOBY phantom. To the OpenGATE collaboration and all the world wide GATE users.
To the teaching staff of the Instituto de Biofísica e Engenharia Biomédica (IBEB) da Faculdade de Ciências da Universidade de Lisboa (FCUL): Professor Eduardo Ducla Soares, Professor Pedro Cavaleiro Miranda and Professor Alexandre Andrade for their extraordinary dedication to the insti-tute and to the constant care about students well-being and good work conditions.
I would also like to especially thank the friendship and support from Mónica Martins, Nuno Matela, Nuno Oliveira, Sofia Silva, Paula Faria, Ricardo Salvador, Sandra Tecelão, Patrícia Figueiredo, Teresa Montez, Luís Janeiro, Luís Freire, Sónia Gonçalves, Paula Santos, Mai Lu, Gilberto Almeida, Liliana Caldeira, Hugo Cordeiro, Marta Correia, ..., and to everyone who contribute to make IBEB such a nice place to work.
To Ana Sousa and Beatriz Lampreia. Besides the administrative help, for the friendship and care. To my colleagues at the Escola Superior de Tecnologia da Saúde de Lisboa (ESTeSL). To Nuno Teixeira, Alexandra Carvalho, Luís Freire (again), Eduardo Alves and Nuno Machado, for their advices, help and friendship during the last year of this work.
Thanks to my friends and family who listened to my stories without ever understanding the logic behind them or why anyone would care to spend so much time trying to master it. To Ana Carina, Ana Margarida and Gabriela, for their support and friendship. A special thanks goes to António... for always being there.
To my son Pedro, who is my personal reminder of the fact that there are things by far more important in life than debugging a program or obtaining good quality simulated data.
And last, but not the least, I would like to express my thankfulness to Carlos for all the love, dedic-ation and support during all these years. For the encouragements and for always believing in me. I could not have done it without you.
Lisboa, May 8th, 2010
This work was funded by the Fundação para a Ciência e a Tecnologia (FCT) under grant nº SFRH/BD/22723/2005. I would like to offer my sincere acknowledgments to FCT for this support.
... to the memory of my father... who always believed in me. Miss you. ... to my little one: Pedro! Love you!
Contents
I
Introduction
1
1 Introduction 3
II
Background
9
2 Positron Emission Tomography 11
2.1 Physics of Positron Emission and Annihilation . . . 13
2.1.1 Positron Emission and Annihilation . . . 13
2.1.2 Positron Range and Noncolinearity . . . 15
2.1.3 Photon Interactions with Matter . . . 17
2.1.3.1 Compton Scattering . . . 17
2.1.3.2 Photoelectric Effect . . . 18
2.1.3.3 Interaction Cross-Sections in Materials . . . 18
2.2 Imaging Technology for PET . . . 20
2.2.1 PET Detectors . . . 20
2.2.2 Photomultiplier Tubes (PMTs) . . . 23
2.2.3 Block Detector Readout . . . 23
2.3 Data Acquisition . . . 26
2.3.1 Coincidence Detection . . . 26
2.3.2 Type of Events . . . 27
2.3.3 2D and 3D Acquisitions . . . 28
2.3.4 Acquisition Protocols . . . 30
2.3.5 PET System Configurations . . . 30
2.4.1 Spatial Resolution and Depth Of Interaction (DOI) . . . 32
2.4.2 System Sensitivity . . . 34
2.4.3 Noise Equivalent Count (NEC) . . . 35
2.4.4 Scatter Fraction (SF) . . . 35
2.5 Data Representation and Corrections . . . 36
2.5.1 Organizing the Data . . . 36
2.5.2 Data Normalization . . . 37
2.5.3 Photon Attenuation . . . 39
2.5.4 Scatter Correction . . . 41
2.5.5 Random Coincidences . . . 42
2.5.6 Dead Time . . . 43
2.5.7 Partial Volume Effect . . . 43
2.6 Image Reconstruction in PET . . . 44
2.6.1 Analytical Reconstruction Methods . . . 44
2.6.1.1 Backprojection . . . 44
2.6.1.2 Direct Fourier Reconstruction and Filtered Backprojection (FBP) . . 45
2.6.2 Iterative Reconstruction Methods . . . 48
2.6.3 3D Reconstruction . . . 51
2.7 PET Radiopharmaceuticals . . . 51
2.7.1 Specific Activity . . . 52
3 Small Animal PET Imaging 55 3.1 Challenges and Limitations of Small Animal PET Imaging Quantification . . . 56
3.1.1 Spatial Resolution . . . 56
3.1.2 System Sensitivity . . . 58
3.1.3 Radiation Exposure . . . 58
3.1.4 Specific Activity of Tracers . . . 59
3.1.5 Measurement of the Input Function . . . 59
3.1.6 Other Considerations... . . 60
3.2 Implementation of Small Animal PET . . . 60
3.2.1 Anesthesia . . . 60
3.2.2 Immobilisation and Positioning . . . 61
3.2.3 ROI Identification . . . 61
3.3 Small Animal PET Scanners . . . 61
4 Monte Carlo Simulations in Emission Tomography 67
4.1 Random Numbers . . . 68
4.2 Sampling Methods . . . 69
4.2.1 The Distribution Method . . . 69
4.2.2 The Rejection Method . . . 69
4.2.3 The Mixed Methods . . . 70
4.2.4 Non Analog Samplig . . . 70
4.3 Photon Transport . . . 70
4.4 Variance Reduction Techniques . . . 72
4.5 Monte Carlo Packages for Nuclear Medicine . . . 72
III
Materials & Methods
75
5 The GATE Platform 77 5.1 Main Features . . . 785.1.1 Software Architecture . . . 78
5.1.2 Geometry . . . 79
5.1.3 Systems . . . 80
5.1.4 Physics process . . . 80
5.1.4.1 Standard Energy Electromagnetic Processes (SEP) . . . 82
5.1.4.2 Low Energy Electromagnetic Processes (LEP) . . . 83
5.1.4.3 Production Cuts . . . 85
5.1.4.4 Positron Emission . . . 86
5.1.5 Radioactive Sources . . . 86
5.1.6 Voxellized Phantoms and Voxellized Sources . . . 87
5.1.7 Sensitive Detectors . . . 88
5.1.8 Time Management and Movements . . . 89
5.1.9 Digitizer and Readout Parameters . . . 90
5.1.9.1 From Particle Detection to Coincidences in GATE . . . 90
5.1.9.2 The Digitizer . . . 91
5.1.9.3 Digitizer Optimization . . . 94
5.3 Computing Resources . . . 94
5.3.1 CCRT @ CEA . . . 96
5.3.2 Cluster @ IBEB . . . 98
5.3.3 Instalation Procedure . . . 99
5.3.4 Cluster Computing for GATE Simulations . . . 99
6 The MicroPET®FOCUS 220 Scanner 103 6.1 Technical Specifications . . . 103
6.2 The Simulated Model . . . 105
6.2.1 The Geometry . . . 105
6.2.2 The Physical Process and the Acquisition Protocol . . . 108
6.2.3 Data Output and Reconstruction Set-Up . . . 112
6.2.4 Experiments . . . 114
6.2.5 Image Planes . . . 117
IV
Results and Discussion
119
7 The Digital Mouse Phantoms 121 7.1 The Phantoms Used . . . 1227.1.1 Phantoms Built from Real Data . . . 122
7.1.1.1 The [18F]-fluoride mouse phantom . . . 122
7.1.1.2 FDG mouse phantom . . . 124
7.1.2 The MOBY Phantom . . . 126
7.1.2.1 Modelling of a Stress Breathing Condition and a Tumor Motion . . . 127
7.2 Phantom Simulation Process . . . 128
8 Enhancements to the GATE Platform 137 8.1 List Mode Format . . . 137
8.2 The microPET®Focus LMF . . . 138
8.3 The Class GateToFOCUS . . . 139
9 Small Animal PET with GATE 143
9.1 Validation for the microPET®Focus Simulation . . . 143
9.1.1 Spatial Resolution . . . 143
9.1.2 Counting Rate . . . 144
9.1.3 Contrast Recovering . . . 146
9.2 Application for Small Animal PET Imaging . . . 147
9.2.1 Bone Imaging Using [18F]-Fluoride . . . 147
9.3 Metabolic Imaging Using FDG . . . 150
9.4 Physical Parameters Effects on the Quantification . . . 153
10 Evaluation of the Respiratory Motion in Lung Lesion Quantification 157 10.1 Data Analysis . . . 157
10.2 Quantification Considerations... . . 159
10.3 Motion Blurring versus Spatial Resolution . . . 162
10.4 Lesion Detectability . . . 162
10.5 Evaluation of the Contrast Recovery and Volume Recovery Coefficient . . . 169
V
Main Discussion and Conclusions
173
11 Main Discussion and Conclusions 175 11.1 The Digital Mouse Phantoms . . . 17511.2 Enhancements to the GATE Platform . . . 175
11.3 Small Animal PET with GATE . . . 176
11.4 Evaluation of the Respiratory Motion in Lung Lesion Quantification . . . 177
11.5 Perspectives for Future Work . . . 178
11.6 Concluding Remarks . . . 179
A MOBY files 181 A.1 general.samp.par . . . 181
B GateToFOCUS New Class 193 B.1 GateToFOCUS.cc . . . 193 B.2 GateToFOCUS.hh . . . 203 B.3 GateToFOCUSMessenger.cc . . . 206 B.4 GateToFOCUSMessenger.hh . . . 207 B.5 GateOutputMgr.cc . . . 208 B.6 GNUmakefile . . . 208
C Publications and Comunications 209 C.1 List of Publications . . . 209
C.2 List of Comunications . . . 210
C.2.1 Oral communications . . . 210
C.2.2 Invited Oral communications . . . 211
C.2.3 Posters in conferences . . . 211
C.3 Scientific Committee . . . 212
C.4 Conference Chair . . . 212
C.5 Organizing Committee . . . 212
C.6 Honours and Awards . . . 213
List of Figures
2.1 Positron Emission Tomography. . . 12 2.2 In a PET camera, each detector generates a timed pulse when it registers an incident
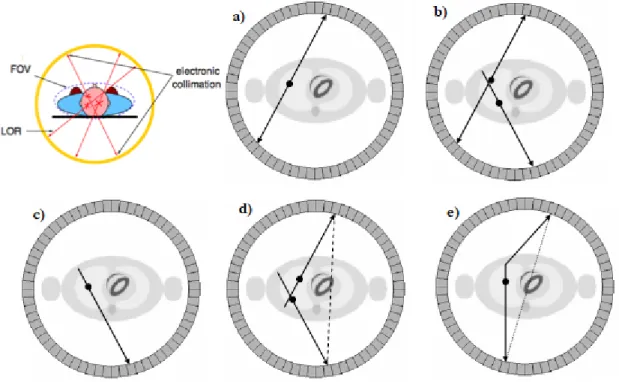
photon. These pulses are then combined in coincidence circuitry, and if the pulses fall within a short time-window, they are deemed to be coincident. A coincidence event is assigned to a LOR joining the two relevant detectors. In this way, positional information is gained from the detected radiation without the need for a physical col-limator. This is known as electronic collimation. Electronic collimation has two major advantages over physical collimation: improved sensitivity and improved uniformity of the Point Source Response Function (PSRF). . . 16 2.3 The process of positron emission and subsequent positron-electron annihilation
res-ults in two 511 keV annihilation photons emitted 180° apart. The positron range error is dependent on the energy of the emitted positrons resulting in variations of ~ 0.1 mm up to some mm. Accolinearity is independent of radionuclide, and the error is determined by the separation of the detectors. Because there is some residual momentum associated with the positron, the two annihilation photons are not emit-ted exactly at 180°, but at a slight deviation.Two detectors detect these photons in a straight line, which is slightly deviated of ±0.25° from the original annihilation line. . . 17 2.4 PET camera configuration: slits between crystals direct light photons toward PMTs.
Adapted from [Powsner & Powsner, 2006]. . . 21 2.5 Photomultiplier tube and its preamplifier and amplifier. Adapted from [Powsner &
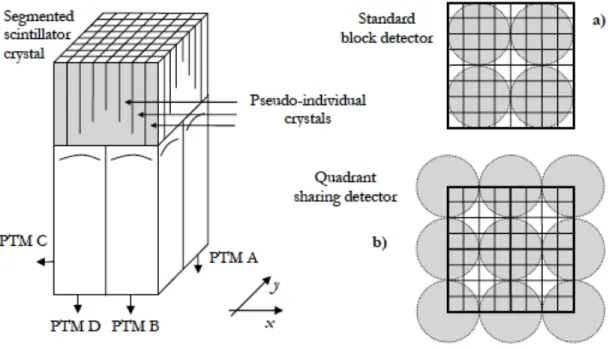
Powsner, 2006]. . . 24 2.6 A schematic representation of a block detector: a) Standard PMT arrangement in a
standard block detector and b) Quadrant-sharing detector. Adapted from [Zanzonico, 2004]. . . 25 2.7 Illustration of the main coincidence event types: a) true; b) multiple; c) single; d)
random and e) scattered. . . 28 2.8 2D and 3D PET imaging. Adapted from [Powsner & Powsner, 2006]. . . 29
2.9 The three basic geometries found in modern dedicated PET systems: (a) Array of large detectors, either continuous detectors (flat or curve-plate NaI(Tl)) or plates of discrete crystals; (b) partial ring of detector blocks that rotates and (c) full ring of discrete crystals configured as small blocks or larger detector modules. Adapted from [Lewellen & Karp, 2004]. . . 31 2.10 In a ring geometry scanner, the point spread function becomes asymmetrical with
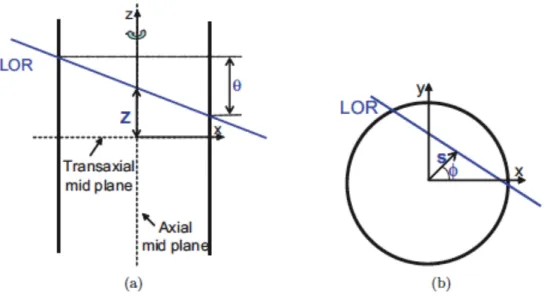
increasing radial offsets due to detector penetration and the lack of information re-garding the depth of interaction within the crystal. The result is a degrading spatial resolution and mispositioning of events towards the center of the FOV. The severity of these effects depends on detector ring diameter, detector depth, and the detector material. Adapted from [Cherry & Dahlbom, 2006]. . . 33 2.11 Representation of the coordinates of the Lines of Response in a 3D Sinogram. (a):
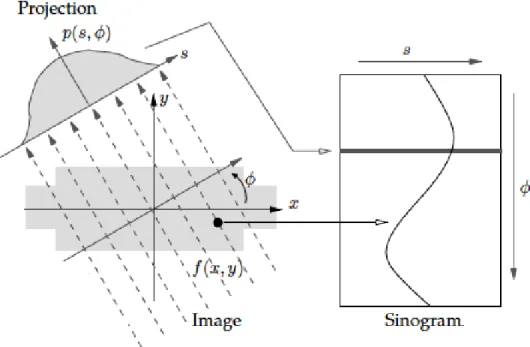
view of a LOR in a plane parallel to the scanner rotation axis. (b): view of a LOR projected into the transaxial plane. Adapted from [Jacobson M. & G., 2000]. . . 37 2.12 A parallel projection, for a particular angle φ , of an object corresponds to a row in the
sinogram. . . 38 2.13 Two 511 keV photons detected by two detectors after traversing different tissue
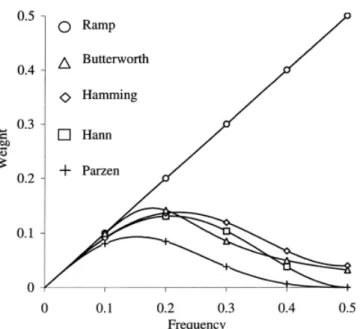
thick-nesses a and b. Attenuation is independent of location of annihilation, and depends on the total dimension of the body. Adapetd from [Saha, 2005]. . . 39 2.14 The projection slice theorem. Adapted from [Cherry & Dahlbom, 2006]. . . 46 2.15 Some filters currently used in FBP and their shape. Value on y-axis indicates to
what extent contribution of each frequency to image is modified by filters. These fil-ters reduce the amplitude at high frequencies, improving signal-to-noise but reducing spatial resolution. They also avoid “ringing” artifacts from the very sharp cut-off of the ramp filter at ν = νcut−o f f. All of them are defined as ”low-pass” filters. Adapted
from [Bruyant, 2002]. . . 47 2.16 Images reconstructed by FBP from different numbers of equally spaced projections.
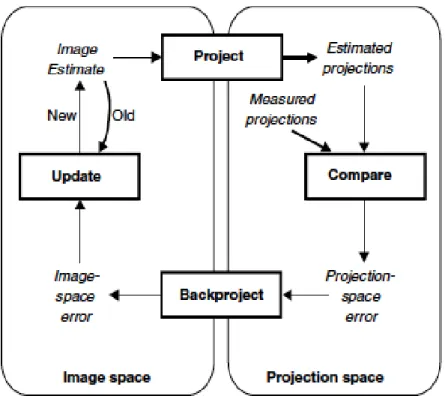
The number of views included in each reconstruction is shown above its image. Ad-apted from [Wernick & Aarsvold, 2004]. . . 48 2.17 Flowchart of a generic iterative reconstruction algorithm. Adapted from [Lalush &
Wernick, 2004]. . . 49 2.18 A projection data qi in a sinogram is estimated from all pixels along the LOR and
compared with the measured projection data pi. Adapted from [Saha, 2005]. . . 50
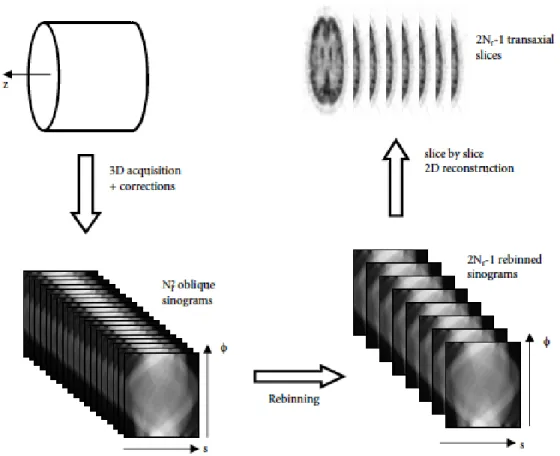
2.19 Schematic representation of the principle of a rebinning algorithm for 3D PET data. Adapted from [Defrise et al. , 2003, 2005]. . . 52 2.20 FDG tracer uptake by metabolically active cells. Adapted from [Kappor et al. , 2004]. 53
3.2 Intrinsic spatial resolution of several existing tomographs as a function of detector size. Data have been labelled according to the type of position decoding scheme used to identify the crystal of interaction. Adapted from [Lecomte, 2004]. . . 57 3.3 Dedicated animal PET scanners: a) Hamamatsu SHR-7700 scanner, a PET system
dedicated to non-human primate imaging. The position sensitive PMT-BGO detector-based ring has a diameter of 50.8 cm and an axial FOV of 11.4 cm. b) The microPET P4 scanner. This system uses fiberoptically coupled LSO scintillator elements and a position-sensitive PMT. The ring diameter is 27 cm and the axial FOV is 80 mm. c) The HIDAC system, an animal PET scanner which uses multiwire proportional chamber technology together with stacks of lead converters. All these detectors have an intrinsic spatial resolution of < 1 mm. Adapted from [Chatziioannou, 2002a]. 63 3.4 MicroPET imaging of bi-directional inducible therapeutic and reporter-gene
expres-sion. Sequential microPET imaging studies of a nude mouse carrying four tumours. Four tumour cell lines - two positive controls (constitutive reporter-gene expres-sion), one negative control and one inducible line (reporter-gene expression induced by doxycycline - were injected subcutaneously into four separate sites in a single mouse. When tumours reached a size of at least 5 mm, the mouse was imaged with 9-(4-[18F] fluoro-3-hydroxymethylbutyl)guanine (FHBG). Doxycycline was then added to the water supply for 7 days. The mouse was then scanned again with FHBG. Doxycycline was removed from the water supply for the next 7 days, and the mouse was again scanned with FHBG. The locations of the four tumours and the mouse outline are shown by the dotted regions of interest. All images are 1 to 2 mm coronal sections through the four tumours. The %ID/g (% injected dose per gram tissue) scale for FHBG is shown on the right. The negative control tumours show no gene expression, and the positive control tumours show increased expression over the time course. The tumour on the top right, with inducible gene expression, initially does not accumulate FHBG, then at 7 days after addition of doxycycline, induction of reporter-gene expression traps FHBG. Seven days after withdrawal of doxycycline, there is decreased induction and minimal trapping of FHBG.The FHBG image signal correlates well with target-gene expression (not shown). Adapted from [Gambhir, 2002]. . . 65 3.5 Whole-body bone scans ([18F]-fluoride ion) of a mouse acquired using the microPET
scanner. The image on the left was reconstructed using standard 3D FBP technique with a high resolution ramp filter. The image on the right was reconstructed from the same raw data using a maximum a posteriori (MAP) algorithm that minimizes statistical error and models the detector response. A substantial improvement in spatial resolution without noise amplification is clearly demonstrated. Adapted from [Chatziioannou, 2002b]. . . 66
4.1 Principles and main components of a Monte Carlo program dedicated to the simula-tion of cylindrical multi-ring PET imaging systems. Adapted from [Zaidi, 2006]. . . . 68
5.2 Picture of a phantom and a cylindricalPET system composed of 5 rsectors, 4 modules (repeated along Z axis), 3 submodules (repeated along Y axis), 64 crystals(8×8) and 2 layers (red and yellow). Adapted from [Jan et al. , 2008]. . 82
5.3 Particle interactions in a sensitive detector. Adapted from [Jan et al. , 2008]. . . 88
5.4 Management of time-dependent phenomena with GATE. . . 90
5.5 The digitizer is organized as a chain of several modules that processes the hits to yield a single, which represents a physical observable. Adapted from [Staelens, 2004]. 92
5.6 Actions of both the adder and readout modules. The adder module transforms the hits into a pulse in each individual volume, and then the readout module sums a group of these pulses into a single pulse at the level of depth as defined by the user. Adapted from [Lazaro, 2003]. . . 92
5.7 Example of a readout scheme. The disk icons represents the data written to the GATE output files. Adapted from [Jan et al. , 2008]. . . 95
5.8 Tantale architecture. . . 97
5.9 IBEB Mini-Cluster architecture. . . 100
5.10 The job splitter is used to generate fully resolved, non-parameterized macro files together with a platform specific submit file and a split file for error handling in the merging step. Adapted from [Beenhouwer et al. , 2005]. . . 101
5.11 A GATE simulation consisting of 3 runs. The parallelization introduces virtual time slices that update the geometry based on the original time schedule. Adapted from [Beenhouwer et al. , 2005]. . . 102
5.12 The output merger is used to merge the ROOT output data into a single output file. Adapted from [Beenhouwer et al. , 2005] . . . 102
6.1 The microPET®FOCUS 220. Adapted from [microPET FOCUS, 2010]. . . 105
6.3 Example of a set of plots produced by a ROOT macro, for the FOCUS system. The three plots in the upper row show the detection coordinates of the annihil-ation photons in the system’s detector heads. The first two plots (Transaxial detection position) are 2D histograms of the respective X and Y coordinates, one per frame. The third plot (Axial detection position) is a 1D histogram of the Z coordinate. In the left plot of the middle row illustrate the decay time curve of the F18 source. The second plot in the middle row (Axial sensitivity) il-lustrates the axial sensitivity of the scanner. For all unscattered coincidences, the axial position of the corresponding LOR is histogramed. The third plot in the middle row (Axial scatter fraction) shows the scatter fraction as a function of the axial position. The plot in the lower row (Acollinearity Angle Distribution (deg)) shows the distribution of the deviation to 180 degrees. of the angle between the two annihilation gammas. The second to last plot compare the delay coincid-ences generated with the real random selected in the prompts coincidcoincid-ences, and the last one shows the different type of decay events as a function of the time acquisition. Adapted from [Branco, 2005]. . . 115 6.4 Illustration of a simulation process. . . 116 6.5 Image planes. . . 118
7.1 Coronal, sagital and transaxial slices for the activity distribution of [18F]-fluoride mouse phantom. . . 123 7.2 The curve shows the radioactive decay of the [18F]-fluoride with a half-life of 6585.2
s, along the exam acquisition time. . . 123 7.3 Coronal, sagital and transaxial slices for the activity distribution of the FDG mouse
phantom. . . 124 7.4 The curve shows the radioactive decay for the FDG study, with a half-life of 6585.2 s. 125 7.5 Measured TACs used as input for the FDG uptake simulation. . . 125 7.6 Anterior (left) and lateral (right) views of the MOBY digital mouse phantom. Adapted
from [Segars et al. , 2004]. . . 127 7.7 Inspiratory motions of the liver (diaphragm), stomach, spleen, heart, and kidneys
simulated in the mouse phantom. Expiratory motion was simulated as the reverse of the inspiratory motion. Adapted from [Segars et al. , 2004]. . . 129 7.8 (Top) Anterior view of end-expiration (left) and end-inspiration (right) in new mouse
phantom. (Bottom) Left lateral view at end-expiration (left) and end-inspiration (right). The dotted line indicates the movement of the diaphragm. Adapted from [Segars et al. , 2004]. . . 129 7.9 Parameter curves for both respiratory (normal and abnormal breathing condition) and
lesion motion in the MOBY phantom (as a function of the non normal tidal breathing condition). . . 130
7.10 Slices of the emission map of the MOBY phantom including a spherical lesion in middle region of the left lung, generated by the MOBY program. . . 131
8.1 Systran listmode data packets. . . 138 8.2 LMF 48 bits. . . 138 8.3 Packet translation for the microPET LMF formats. . . 138
9.1 Evaluation of the FWHM and full width at the FWTM, with GATE compared with experimental values. Adapted from [Jan et al. , 2005b]. . . 144 9.2 Defined parameters, in the digitizer chain, to measure the counting rate performances.145 9.3 Evaluation of the counting rate, for single events, of the microPET®Focus with GATE
compared with experimental values. Adapted from [Jan et al. , 2005b]. . . 145 9.4 Evaluation of the counting rate, for prompt and delay coincidences, of the microPET
FOCUS with GATE compared with experimental values. Adapted from [Jan et al. , 2005b]. . . 145 9.5 Contrast recovering with the FOCUS system. Adapted from [Jan et al. , 2005b]. . . 146 9.6 Coronal, sagital and transaxial slices representing [18F]-fluoride uptake: acquired
data (top) and GATE simulation using the real data phantom as input (bottom). . . . 148 9.7 Comparison between PET image quantification using a real exam and GATE
simu-lation, for the [18F]-fluoride radiotracer with the mouse phantom generated from real
data. Black bars represent the ROI statistical error measured as the ratio standard deviation over mean for all voxels considered. . . 149 9.8 Maximum Intensity Projection (MIP) of the MOBY phantom after a simulation with an
activity distribution representative of the real [18F]-fluoride distribution. . . 149 9.9 Comparison between PET image quantification and the GATE measurements, for
the [18F]-fluoride radiotracer with the MOBY phantom. Black bars represent the ROI statistical error measured as the ratio standard deviation over mean for all voxels considered. . . 150 9.10 TACs used as input in the simulations for the FDG functional model, expressed in
%ID/cc. . . 151 9.11 Slices from the real FDG exam (top) and the simulated exam (bottom) for the FDG
mouse phantom, with an activity map distribution close to the last activity frame. . . 152 9.12 Comparison between PET image quantification and the GATE measurements, for
the FDG radiotracer with the mouse phantom generated from real data. Black bars represent the ROI statistical error measured as the ratio standard deviation over mean for all voxels considered. . . 153 9.13 Coronal, sagital and transaxial slices for FDG simulation using MOBY: top - first
activity frame (the first 60 s of the real exam), bottom - last activity frame (the last 900 s releated to the real exam). . . 154
9.14 Measured TACs from a complete FDG simulation with the MOBY phantom. . . 155 9.15 Relative differences between the quantification values obtained in the measured
TACs for the MOBY phantom, and the TACs from the real FDG exam. . . 155 9.16 Physical parameters effects on the quantification. Left: Sagital slice of the simulated
MOBY phantom with a gamma-gamma emission source. Right: Sagital slice of the simulated MOBY phantom for the18F emission source (with the inclusion of positron range and gamma accolinearity effects). Bottom: Maximum concentration profiles which illustrate the blurring or smearing effect for the18F emission source caused by the physical parameters effects. . . 156
10.1 Lesion size definition. To obtain this definition there were several steps that were executed. The first was to carefully place the lesion in the lungs and not on any other organ. Secondly there was the need to try different sizes in order to define a lesion that was entirely inside the lungs. The images on the first column of the figure show this steps using ROOT. In order to achieve this outcome we had to define activity in the lesion as well as in the lungs (in a FDG exam there is no lungs activity uptake in the image). The middle column presents the images for the static FDG simulations (for the last frame), and in the rightmost column there is presented the images for the dynamic FDG simulations (for the last farme). For the higher diameter lesions (1.25 mm, 1.5 mm and 2.0 mm) in the dynamic mode images are not show due to lesion blending into the liver. . . 160 10.2 Sagital slices through the MOBY phantom containing a 1.0 mm diameter lung lesion
or only background, illustrating the placement of the background and lesion ROIs used for data analysis. . . 161 10.3 Sagital slices, of the reconstructed MOBY phantom, for a static acquisition, where
no motion was simulated, and for the simulation of a dynamic acquisition, where res-piratory and lesion motions were considered, with a lung lesion of 1.0 mm diameter and an FDG uptake of 0.05 μCi. The maximum concentration profiles from 3D and 4D simulated exams: where the blurring or smearing effect induced by respiratory motion are represented in the right. . . 163 10.4 Coronal slices of the MOBY phantom corresponding to the simulation of a “stress”
condition breathing motion (see section 7.1.2.1) including a lung motion lesion of 1.5 mm diameter and an FDG uptake of 1.35 μCi. These coronal slices represent one respiratory cycle for an FDG exam in the last time frame. The dynamic 3D emission assumed an event collection during 900 s, where 5.65×10⁹ particles were generated. 164 10.5 Transaxial, coronal and sagital slices of the reconstructed lung lesion, in the MOBY
phantom, with 2.0 mm diameter and an FDG uptake of 0.08 μCi. No motion was simulated. . . 164 10.6 FWHM of the line spread function through the lesion centroid as a function of the
10.7 FWHM of the line spread function through the lesion centroid as a function of the FDG activity defined for static and dynamic acquisitions schemes, for the 1.0 mm diameter lesion. Data from dynamic acquisitions are represented by dashed curves and static acquisition data are represented by solid curves. . . 166 10.8 SNR of the 0.01 μCi, 0.03 μCi, 0.05 μCi, 0.08 μCi, 1.08 μCi and 1.35 μCi FDG uptakes
for the spherical lesions as a function of the lesion diameter. Results obtained for the static simulations. . . 167 10.9 CNR of the 0.01 μCi, 0.03 μCi, 0.05 μCi, 0.08 μCi, 1.08 μCi and 1.35 μCi FDG uptakes
for the spherical lesions as a function of the lesion diameter. Results obtained for the static simulations. . . 168 10.10TBR of the 0.01 μCi, 0.03 μCi, 0.05 μCi, 0.08 μCi, 1.08 μCi and 1.35 μCi FDG uptakes
for the spherical lesions as a function of the lesion diameter. Results obtained for the static simulations. . . 169 10.11TBR of a set of a dynamic and a static acquisition as a function of the FDG activity
concentration for the 1.0 mm diameter lesion. Data from dynamic acquisitions are represented with the dashed curve and static acquisition data are represented by the solid curve. . . 170 10.12Contrast of the 0.01 μCi, 0.03 μCi, 0.05 μCi, 0.08 μCi, 1.08 μCi and 1.35 μCi FDG
up-takes for the spherical lesions as a function of the lesion diameter. Results obtained for the static simulations. . . 171 10.13Contrast recover of a set of dynamic and static acquisitions as a function of the FDG
activity concentration for the 1.0 mm diameter lesion. Data from dynamic acquisitions are represented by the dashed curve and static acquisition data are represented by the solid curve. The red line represents the mean simulated contrast. . . 172
List of Tables
2.1 Selected list of radionuclides, and their physical properties, that decay by positron emission and are relevant to PET Imaging. . . 14 2.2 Linear Attenuation Coefficients for soft tissue, bone, Bismuth Germanate - BGO (a
detector material), lead, and tungsten at 511 keV. Adapted from [Cherry & Dahlbom, 2006]. . . 19 2.3 Properties of some scintillators used in PET detectors. Note that some of these
spe-cifications are subject to change as developers change dopants and trace elements in the scintillator growth. For example, the light output, peak wavelength, decay time and density for LYSO and LFS will vary somewhat for different versions of the basic scintillator. Adapted from [Lewellen, 2008]. . . 22 2.4 Some radiopharmaceuticals used in PET and their applications. Adapted from [Saha,
2005]. . . 53
5.1 Different systems available in GATE and their characteristics. In the second column are listed some of the keywords that are also used in a simulation (see also [Jan et al. , 2008] for a complete list). The shape in the third column describes the mother volume, composed of daughter volumes: a box means a box shaped mother volume containing an array of daughter boxes, a cylinder mother volumes will contains cylin-ders. Cylinders are understood here as tube sectors defined by an inner and outer radius. Adapted from [Jan et al. , 2008]. . . 81
6.1 Specifications and features of the microPET®FOCUS system. Adapted from [micro-PET FOCUS, 2010]. . . 104 6.2 Relationship between the physical components of the scanner and the hierarchical
levels of the system. . . 105
9.1 CR results for each rod. The activity ratio with the background is 2:1 for the Rod1, 3:1 for the Rod2, 4:1 for the Rod3 and 5:1 for the Rod4. Adapted from [Jan et al. , 2005b]. . . 146 9.2 Activity distribution in the MOBY phantom at the last frame, in the case of the [18
9.3 Input activity distribution for the first and the last frame in the MOBY structure for the FDG. . . 151
10.1 Statistical error obtained for the defined ROIs in the lung lesion implementation in the MOBY phantom, from the static and the dynamic simulation modes. . . 161 10.2 SNR and CNR values in the lesion with 1.0 mm diameter as a function of the FDG
activity concentration. The first columns show the CNR and the SNR from the images of the phantom in a static mode. The other results correspond to data obtained from the images of the phantom in the dynamic mode. . . 168 10.3 VRC in the static and dynamic acquisitions as a function of the lesion diameter.
The mean percent errors in volume estimates measured on simulated lesions as a function of the real lesion volume are also shown. (Note: N/A - ”not available” - is this context means that the VRC value was not possible to measure due to the blurring and to the smearing effect resulting from the respiratory motion.) . . . 171
Abbreviations
ACF Attenuation Correction Factor
AMIDE Amide is a Medical Imaging Data Examiner APD avalanche photodiode
ART Algebraic Reconstruction Technique BaF2 Barium Fluoride
BGO Bismuth Germanate BGO Bismuth Germanate BPF BackProjection Filtering
CCRT Centre de Calcul Recherche et Technologie CLHEP Class Library for High Energy Physics CNR contrast-to-noise ratio
CR Contrast Recovery CT Computed Tomography DOI Depth Of Interaction
DRM Distributed Resource Management EADL Evaluated Atomic Data Library EEDL Evaluated Electron Data Library EGS Electron Gamma Shower EPDL Evaluated Photon Data Library FBP Filtered Backprojection
FDG 2-Deoxy-[18F]fluoro-D-glucose FEE Front End Electronics
FHBG 9-(4-[18F]fluoro-3hydroxymethylbutyl)guanine fMRI functional Magnetic Resonance Imaging FOM Figure of Merit
FORE FOurier REbinning FOV Field Of View FT Fourier Transform
FWHM Full Width at Half Maximum FWTM Full Width at Tenth Maximum
GATE Geant4 Application for Emission Tomography Geant GEometry ANd Tracking
GPS General Particle Source GSO Gadolinium Orthosilicate LaBr3 Lanthanum Bromide
LEP Low Energy Electromagnetic Processes LFS Lutetium Fine Silicate
LGPL Lesser General Public License LMF List Mode Format
LOR Line Of Response LSF Load Sharing Facility LSO Leutetium Orthosilicate
LuAP Cerium doped Lutetium Orthoaluminate LuI3 Lutetium Iodide
LYSO Cerium doped Lutetium Yttrium Orthosilicate MAP MAximum a Posteriori
MCNP Monte Carlo N-Particle MIP Maximum Intensity Projection
MLEM Maximum Likelihood Expectation Maximization MOBY 4D Mouse Whole-Body
MPI Message Passing Interface MRI Magnetic Resonance Imaging MRM Magnetic Resonance Microscopy MSB Most Significant Bit
MWPC MultiWire Proportional Chambers NaI(TI) Sodium Iodide
NEC Noise Equivalent Count
NURBS Non-Uniform Rational B-Splines
OSEM Ordered Subset Expectation Maximization PDF Probability Density Function
PE Photoelectron
PENELOPE Code System to Perform Monte Carlo Simulation of Electron Gamma-Ray Showers in Arbitrary Materials
PET Positron Emission Tomography PMT Photomultiplier Tube
PSPMT Position Sensitive Photomultiplier Tube PSRF Point Source Response Function PV Partial Volume
PVI positron volume imaging RatCAP Rat Conscious Animal PET RC Recovery Coefficient
RDM Radioactive Decay Module Rmax maximum or extrapolated ranges ROI Region Of Interest
Rrms root-meansquare ranges RT Radiation Therapy SA Specific Activity
SEP Standard Energy Electromagnetic Processes SF Scatter Fraction
SimSET Simulation System for Emission Tomography SNR signal-to-noise ratio
SORTEO Simulation Of Realistic Tridimensional Emitting Objects SPECT Single Photon Emission Computed Tomography
SSRB Single Slice Rebinning Algorithm TAC Time Activity Curve
TBR Target to Background Ratio TOF Time-Of-Flight
US UltraSound VOI Volume Of Interest
VRC Volume Recovery Coefficient VRT Variance Reduction Technique
Part I
Chapter 1
Introduction
Non-invasive diagnostic imaging can be performed with different technologies: X-ray radiography, computed radiography, direct radiography, mammography, Computed Tomography (CT), UltraSound (US), and Magnetic Resonance Imaging (MRI), which all give anatomical information, and also with functional MRI (fMRI), optical imaging, thermography, planar isotope imaging, Single Photon Emis-sion Computed Tomography (SPECT), Positron EmisEmis-sion Tomography (PET), and gamma camera PET which return functional information [Kane, 2009; Wernick & Aarsvold, 2004; Gambhir, 2002; Nutt, 2002]. Since biochemical changes precede morphologic changes, PET has the potential to provide diagnostic information earlier than, for example, X-Ray, CT or MRI. Recent devices combine two modalities on the same gantry in order to achieve hardware fusion of anatomical and functional images, as PET/CT [Mawlawi & Townsend, 2009; Cherry, 2009; Townsend et al. , 2004].
In nuclear medicine examinations, a radiopharmaceutical is administered to the patient, which is marked with a radionuclide emitting one single photon with an energy of 100 - 200 keV in SPECT and a positron emitting radionuclide in PET. Positron emitting radionuclides, such as11C,13N,15O, and 18F, have been used in medicine for decades. These radionuclides are used to synthesize
an ever growing number of tracer compounds that enable measurement of regional biology and biochemistry. The emission of a positron results in two annihilation photons of 511 keV. With the advent of tomographic reconstruction methods and the development of detector technologies, im-ages generated from the detection of the two 511 keV photons from the subsequent positronium decay have become common place. Such images allow us to follow the dynamics of the tracers in the body with high sensitivity, producing quantitatively accurate images of the distribution of tracer concentration [Zanzonico & Heller, 2007; Zanzonico, 2004]. These methods are minimally invas-ive, repeatable, reproducible, and have been applied widely in the fields of oncology, cardiology and neuroscience. 2-Deoxy-[18F]fluoro-D-glucose (FDG) is the most common radiotracer used in PET to stage cancer and metastasis in many regions of the body. FDG is analogous to glucose and is taken up by living cells through the normal glucose pathway. Tumor imaging with FDG relies on the fact that malignant cells possess high metabolic rates and therefore take up greater amounts of FDG than healthy tissues [Larson & Schwartz, 2006; Couturier, 2004; Kubota, 2001; Guhlke et al. , 2007]. PET functional imaging using FDG is widely considered as the state of the art in diagnosis for a number of oncology applications [Bomanji et al. , 2001].
The rapid growth in genetics and molecular biology combined with the development of techniques for genetically engineering small animals has led to increased interest in in vivo small animal ima-ging [Cherry & Gambhir, 2001; Riemann et al. , 2008; Rowland & R., 2008]. Small animal imaima-ging has been applied frequently to the imaging of small animals (mice and rats), which are ubiquitous in modeling human diseases and testing treatments. The use of PET in small animals allows the use of subjects as their own control, reducing the interanimal variability. This allows performing longitudinal studies on the same animal and improves the accuracy of biological models [Cherry, 2004]. However, small animal PET still suffers from several limitations. The amounts of radio-traces needed, limited scanner sensitivity, image resolution and image quantification issues, all could clearly benefit from additional research [Chatziioannou, 2002b; Tai & Laforest, 2005]. Because nuclear medicine imaging deals with radioactive decay, the emission of radiation energy through photons and particles alongside with the detection of these quanta and particles in different materials make Monte Carlo method an important simulation tool in both nuclear medicine research and clinical practice. In order to optimize the quantitative use of PET in clinical practice, data- and image-processing methods are also a field of intense interest and development. The evaluation of such methods often relies on the use of simulated data and images since these offer control of the ground truth. Monte Carlo simulations are widely used for PET simulation since they take into account all the random processes involved in PET imaging, from the emission of the positron to the detection of the photons by the detectors. Simulation techniques have become an import-ance and indispensable complement to a wide range of problems that could not be addressed by experimental or analytical approaches [Rogers, 2006].
Monte Carlo methods are numerical calculation methods based on random variable sampling. This approach has been used to solve mathematical problems since 1770 and has been named “Monte Carlo” by Von Neumann because of the similarity of statistical simulations to games of chance, represented by the most well known center for gambling: the Monte Carlo district in the Monaco principality. The general idea of Monte Carlo analysis is to create a model, which is as similar as possible to the real physical system of interest, and to create interactions within that system based on known probabilities of occurrence, with random sampling of the Probability Density Functions (PDFs). As the number of individual events (called histories) increase, the quality of the reported average behavior of the system improves, meaning that the statistical uncertainty decreases. Vir-tually, any complex system can in principle be modeled: if the distribution of events that occur in a system is know from experience, a PDF can be generated and sampled randomly to simulate the real system. A detailed description of the general principles and applications of the Monte Carlo method can be found elsewhere:[Andreo, 1991; Zaidi, 1999; Ljungberg, 1998, 2004; Zaidi & Sgouros, 2002; Zaidi, 2006].
The simulation of PET imaging using Monte Carlo allows the optimization of system design for new scanners, the study of factors affecting image quality, the validation of correction methodologies for effects such as scatter, attenuation and partial volume, for improved image quantification, as well as the development and testing of new image reconstruction algorithms. Another major advant-age of simulations in nuclear medicine imaging is that they allow studying parameters that are not measurable in practice. The fraction of photons that are scattered in a phantom and their contri-bution to the image are examples of such parameters, and they can only be measured indirectly
for a very limited number of geometries. In addition, in a computer model it is possible to turn off certain effects, such as photon attenuation and scattering in the phantom, which means that ideal images, which include camera-specific parameters, can be created and used as reference images. In combination with patient-like phantoms, the Monte Carlo method can be used to produce sim-ulated images very close to those acquired from real measurements. In this context, Monte Carlo simulations are becoming an essential tool for assisting this research and some specific Monte Carlo simulation packages have been evaluated for nuclear medicine applications [Andreo & Ljun-gberg, 1998; Buvat & Castiglioni, 2002; Buvat et al. , 2005; Buvat & Lazaro, 2006]. Recently, the Geant4 Application for Tomographic Emission (GATE) platform has been developed [Jan et al. , 2004b; GATE, 2010a] and validated for the simulation of the microPET® FOCUS 220 system [Jan et al. , 2005b].
An important aspect of simulation is the possibility of having a realistic model (phantom) of the subject’s anatomy and physiological functions from which imaging data can be generated using accurate models of the imaging process [Ljungberg, 2004; Zaidi, 2006; Zubal, 1998; Poston et al. , 2002; Peter et al. , 2000]. Conceptually, the purpose of a physical or computerized phantom is to represent an organ or body region of interest, to allow modeling the biodistribution of a particular radiotracer and the chemical composition of the scattering medium, which absorbs and scatters the emitted radiation in a manner similar to biological tissues. In other terms, a phantom is a mathematical model designed to represent an organ or tissue of the body, an organ system, or the whole-body.
The widespread interest in molecular imaging spurred the development of more realistic 3D to 5D computational models based on the actual anatomy and physiology of individual humans and small animals. The advantage in using such phantoms in simulation studies is that the exact anatomy and physiological functions are known, thus providing a gold standard or truth in order to evaluate and improve imaging devices, data acquisition techniques, and imaging processing and reconstruction methods. Moreover, computer phantoms can be altered in order to model different anatomies and pathological situations. A review of the fundamental and technical challenges of designing computational models of the human anatomy can be found in [Zaidi & Xu, 2007; Zaidi & Tsui, 2009]. These reviews summarizes the latest efforts and future directions in the development of computational anthropomorphic models for application in radiological sciences.
Based on state-of-the-art computer graphics techniques, the 4D Mouse Whole Body (MOBY) phantoms provide a realistic model of the mouse anatomy and physiology for imaging studies [Segars et al. , 2004]. The phantom, when combined with accurate models for the imaging pro-cess, is capable of providing realistic imaging data from subjects with various anatomies and mo-tions (cardiac and respiratory) in health and disease. With this ability, the phantom has enormous potential to help studying the effects of anatomical, physiological, physical, and instrumentation factors on small animal imaging and to research new instrumentation, image acquisition strategies, image processing and reconstruction methods as well as image visualization and interpretation techniques.
It is known that the localization and detection of thoracic and abdominal lesions in PET imaging is often perturbed due to the displacement of the organs during normal breathing [Bajc et al. , 2007]. The respiratory motion compromise image quality and quantification in PET [Buvat, 2007],
and affect clinical diagnosis. Motion can actually introduce large biases, for instance tracer uptake underestimation greater than 50% in the case of lung lesions [Nehmeh et al. , 2002]. Moreover, respiratory motion can induce resolution degradation (blurring effect) for PET imaging. Contrast loss of small lesions in PET images due to the above motion blurring effect can adversely affect the lesion detection sensitivity for PET imaging in the case of lung or liver cancer imaging [Visvikis et al. , 2004, 2006a]. The degree of motion blurring and contrast loss depends on the lesion size and location [Visvikis, 2004]. To compensate respiratory motion, simulation using software packages may provide a valuable tool for the assessment of respiratory motion detection and correction. In order to contribute for the full understanding of this problem, the GATE Monte Carlo platform was used to model the microPET® FOCUS 220 system and the MOBY phantom to produce realistic simulated mouse scans. GATE is a well validated and very versatile application for Monte Carlo simulations in emission tomography that can be used for highly realistic simulations. MOBY was developed to provide a realistic and flexible model of the mouse anatomy and physiology to be used in molecular imaging research.
Time Activity Curves (TACs), for the FDG radiotracer, were extracted from mouse studies and activity was transposed in the MOBY phantom. The dynamic respiratory feature available in the MOBY phantom, was used, and a lung lesion was modelled in order to evaluate the effect of the respiratory motion on image quantification. These simulated data will be useful to evaluate the degradation on lesion detection due to normal breathing in whole-body mouse PET imaging, and hopefully shed some additional light on dealing with this problem in human exams.
The major aim of the work discussed in this dissertation was to contribute for the full understanding of this problem in small animal PET imaging, and hopefully shed some additional light on dealing with this problem in human exams.
This thesis is composed for eleven main chapters, organized in five parts, as follows:
ThePart I − Introductionis composed of the present Chapter 1 − Introduction, where the context,
motivations and general organization of the work are provided.
ThePart II − Background, comprises three chapters, which include a review of the state of the
art on the main knowledge fields that are related to the work developed in the present thesis. In
Chapter 2 − Positron Emission Tomography, are present an overview of PET:how PET has
de-veloped both as a tracer method and as a physical tomographic detection method. Basic labelling and physiological aspects are touched upon in the choice of suitable positron emitting nuclides and how gamma emission in the decay may affect detection. The physics of the PET detector is de-scribed in some detail as well as data collection and data handling.The Chapter 3 − Small Animal PET Imaging, presents the challenges facing PET technology as applied to small animal imaging,
provides a historical overview of the development of small animal PET systems, and discusses the current state of the art in small animal PET technology. The final chapter of the second part of this work,Chapter 4 − Monte Carlo Simulations in Emission Tomography, presents an overview of
the fundamental characteristics of the Monte Carlo method and details the relevance of accurate Monte Carlo modelling in emission tomography.
ThePart III − Materials & Methods, is composed of two chapters that describe the materials that
work. Chapter 5 − The GATE platform, is devoted to providing a detailed overview of the GATE
software package and its features and capabilities. A description of the computer resources used is also provided. Chapter 6 − The microPET® FOCUS 220Scanner, describes the development
of an accurate model of the microPET®FOCUS 220 system using GATE based on system perform-ance measurements. It includes a general overview of the design of the FOCUS system.
ThePart IV − Results and Discussionbegins with Chapter 7 − The Digital Mouse Phantoms,
describes the mouse phantoms generated from real data, and provides a detailed description of the physiological and metabolic information implemented in the MOBY phantom. The simulation settings used and the image reconstruction process are described in these chapters. The following chapter,Chapter 8 − Enhancements to the GATE Platform, describes the new features that were
introduced in the GATE platform in order to provide the data output format of the microPET®FOCUS
220 system: the LMF 48 bits. TheChapter 9 − Small Animal PET with GATE, describes a
val-idation and a verification of the GATE simulation package versus measurements in the microPET®
FOCUS 220 system, as well as the results obtained for the simulations of the different mouse phantoms. The final chapter of Part IV is Chapter 10 − Evaluation of the Respiratory motion in Lung Lesion Quantification, which describes the quantitative evaluation of the degradation on
lesion detection due to normal breathing in whole body mouse PET imaging.
Finally, the work presented in this thesis and related conclusions are summarized inChapter 11 − Main Discussion and Conclusions, Part V − Main Discussion and Conclusions, together with
a discussion of the main findings and the perspectives of future work.
Detail information about parameters choose in the digital MOBY phantom are presented in Ap-pendix A. Moreover, all the attenuation coefficients related to the mouse phantom is listed in the
same appendix.
A separate appendix section - Appendix B - includes all the code files implemented inside the
GATE platform to provide the data output format of the microPET®FOCUS 220 system.
Research performed within the context of this PhD thesis resulted in 2 articles as a first author in peer reviewed high-impact international journals and in 9 publications (8 as a first author) in international conference proceedings. References to these publications are given in Appendix C at the end of this dissertation. Moreover, a list of all comunications, honours and awards are
Part II
Chapter 2
Positron Emission Tomography
Positron emission tomography (PET) is a noninvasive imaging technique that uses the unique decay characteristics of radionuclides that decay by positron emission (e.g. 11C, 13N, 15O, 18F, 64Cu,
etc.). These radionuclides are produced in a cyclotron and are then used to label compounds of biological interest. The labeled compound is introduced into the body, usually by intravenous injection, and is distributed in tissues in a manner determined by its biochemical properties. The required concentration of radiotracers can be extremely low, in the order of 10-9Mole, in contrast with radiographic or magnetic resonance agents that require much higher concentrations, in the range of 10-3 Mole. When the radioactive atom on a particular molecule decays, a positron is ejected from the nucleus. These proton rich radionuclides spontaneously convert a proton to a neutron, resulting in the emission of a positron and a neutrino. The emitted positron, equal in mass and opposite in charge to an electron, slows down through a series of collisions with the surrounding matter, then combines with an electron before it annihilates. The mass of positron and electron is converted to two high energy photons of 511 keV each that travel in approximately opposite directions. Coincidence detection of these gamma rays, which are highly penetrating and can escape from the subject, and reconstruction of the location of the annihilation events using analytical or statistical methods form the basis of PET. The output of the reconstruction process is a 3D image volume, where the signal intensity in any particular image voxel is proportional to the amount of the radionuclide (and, hence, the amount of the labeled molecule to which it is attached) in that voxel. By taking a time sequence of images, the tissue concentration of the radiolabeled molecules as a function of time is measured, and with appropriate mathematical modeling, the rate of specific biological processes can be determined (Figure 2.1).
With its dynamic imaging capability, PET provides both spatial and temporal measurements of the distribution of biomolecules within a living subject. Combined with kinetic modeling, PET provides quantitative measurements of biological processes in vivo without disturbing the underlying bio-chemical process. This unique feature and the wide variety of biomolecules that can be labeled with positron emitting nuclides of different half-lifes make PET an extremely powerful tool to study normal development (e.g. maping normal human brain and heart function) and diseases in humans (e.g. linical diagnosis of certain diffuse brain diseases such as those causing various types of de-mentias). PET is also used in pre-clinical studies using animals models of human disease, where
(a) Schematic representation of a PET scanner and data processing principles.
(b) Maximum intensity projection (MIP) image from a FDG PET scan demonstrates intense uptake in known lung cancer in left upper lobe (arrow) as well as within 2 small ipsilateral mediastinal lymph nodes (arrowheads). Adapted from [of a PET exam, 2010].