Universidade de Lisboa
Faculdade de Medicina de Lisboa
The role of NRARP in the pathogenesis of T-cell
Acute Lymphoblastic Leukemia
Inês Garcia Brandão e Silva Pinto
Orientador: Doutora Ana Rita Matos Fragoso
Coorientador: Prof. Doutor João Taborda Barata
Dissertação elaborada para obtenção do Grau de Mestre em Oncobiologia
2
Universidade de Lisboa
Faculdade de Medicina de Lisboa
The role of NRARP in the pathogenesis of T-cell
Acute Lymphoblastic Leukemia
Inês Garcia Brandão e Silva Pinto
Orientador: Doutora Ana Rita Matos Fragoso
Coorientador: Prof. Doutor João Taborda Barata
Dissertação elaborada para obtenção do Grau de Mestre em Oncobiologia
3
Todas as afirmações efetuadas no presente documento são da exclusiva
responsabilidade do seu autor, não cabendo qualquer responsabilidade à
Faculdade de Medicina de Lisboa pelos conteúdos nele apresentados.
A impressão desta dissertação foi aprovada pelo Conselho
Científico da Faculdade de Medicina de Lisboa em reunião de 21
de Fevereiro de 2017
4
Acknowledgments (Agradecimentos)
Em primeiro lugar, o meu maior agradecimento vai para a minha orientadora Dr.ª Rita Fragoso, por me ter guiado e ensinado tanto ao longo deste percurso, pela paciência, apoio incondicional, transmissão de conhecimento, motivação e, acima de tudo, pela confiança que depositou em mim. Um enorme agradecimento ao Prof. Dr. João Barata por me ter acolhido na sua equipa fantástica, por todo o incentivo, críticas e sugestões, que me fizeram aumentar o gosto pela Ciência e evoluir enquanto estudante, indo certamente contribuir para o meu futuro como investigadora.
Logicamente um agradecimento gigante para a maravilhosa equipa da Unidade de Sinalização em Cancro do Instituto de Medicina Molecular, que foi sem dúvida essencial para eu concluir mais esta etapa da minha vida. Um enorme obrigada Joana, Daniel, Padma (I promise I’ll translate this for you!), Carlos, Eunice, Cláudia, Teresa, Tiago, Afonso, Isabel, Raquel, Bruno, Alice e Mariana, por estarem presentes no desenvolvimento deste projecto e terem sido fundamentais, não só por toda a ajuda técnica, mas também pelo apoio e diversão (que também é precisa!), que fizeram com que cada dia deste percurso fosse mais feliz. Agradeço também à Unidade de Citometria de Fluxo, Ana Vieira, Andreia e Mariana, por toda a ajuda prestada. Às minhas colegas de Mestrado em Oncobiologia, com quem aprendi imenso, com um especial agradecimento à minha companheira de luta Inês Correia, pela partilha de conhecimento e, essencialmente, pela enorme amizade que sempre nos uniu.
Às pessoas mais importantes na minha vida, a minha Família, muito obrigada. Mãe, Pai, obrigada por todo o carinho, por me terem tornado na pessoa que sou e me terem ensinado a seguir sempre os meus sonhos. À minha Avó que contribuiu sempre para o meu crescimento e me deu todo o amor deste mundo. Ao meu chato irmão João, que por vezes não suporto e me apetece colocá-lo num avião para longe, mas que no fundo já não sei o que seria da minha vida sem ele. Amo-vos muito.
Um agradecimento especial ao meu Diogo, a minha rocha, que nunca deixou de estar lá para mim mesmo com o meu mau feitio (eu sei que às vezes sou difícil de aturar…!). Muito obrigada à minha segunda família, os meus fantásticos amigos sem os quais era impossível percorrer este trajecto sempre com um sorriso no rosto: Inês V., Inês S., Andreia, Inês V., João R., João G., Diogo A., Pedro, Bruno, Margarida, Alicia e a todos os que em tempos se cruzaram no meu caminho e contribuíram, mesmo que indirectamente, para o meu futuro.
Por último, obrigada a todos os que me ajudaram a concluir esta etapa e aos que, em algum momento da minha vida, cultivaram o meu gosto pela Ciência e me tornaram uma pessoa mais persistente e curiosa.
5
Resumo
A leucemia linfoblástica aguda de células T (LLA-T) é uma neoplasia hematológica severa, resultante da expansão clonal de progenitores linfóides de células T, representando cerca de 15% dos casos de adultos e 25% dos casos pediátricos de leucemia linfoblástica aguda (LLA). Apesar do prognóstico de doentes com LLA-T ter melhorado significativamente ao longo dos anos, a taxa de recidiva é ainda elevada e o prognóstico dos doentes com doença resistente à terapia ou recidivante é muito reservado.
A via de sinalização NOTCH é fundamental para a regulação de processos de homeostasia e regeneração de tecidos e desempenha funções muito importantes na hematopoiese. O compromisso de progenitores linfóides para com a linhagem T e os passos iniciais do desenvolvimento de células T no interior do timo são processos regulados pela sinalização da via NOTCH. Desta forma, não é de estranhar que a sua desregulação seja uma característica da patogénese de LLA-T, e que mutações em NOTCH, levando a uma activação constitutiva da via, se verifiquem em mais de 50% dos casos. A identificação destas mutações levou ao desenvolvimento de terapias dirigidas para esta via. A inibição da via NOTCH foi alcançada essencialmente pelo uso de inibidores da γ-secretase. Estes inibem a via NOTCH ao bloquearem a clivagem final do receptor NOTCH, impedindo desta forma que a sua forma activa seja translocada para o núcleo e, consequentemente, que actue como factor de transcrição. No entanto, verificou-se posteriormente que a sua utilização terapêutica tem efeitos anti-leucémicos reduzidos, associados a efeitos secundários graves, a nível intestinal. Outras abordagens terapêuticas, tais como a utilização de anticorpos que têm como alvo receptores e ligandos da via NOTCH, foram desenvolvidas, mas também estas apresentam efeitos secundários severos, tais como a indução de tumores vasculares e toxicidade hepática. Desta forma, uma melhor compreensão dos mecanismos envolvidos na sinalização via NOTCH em LLA-T poderá originar terapias mais eficazes e seguras.
Recentemente, foi demonstrado que a perda de expressão do microRNA miR-181ab1 inibe o desenvolvimento de LLA-T induzido pela activação de NOTCH1, em parte devido ao aumento da expressão de NRARP. Este último é um alvo transcricional da via de sinalização NOTCH e um regulador negativo da mesma. É também importante realçar que a sobre-expressão deste gene em células estaminais hematopoiéticas de ratinho compromete a especificação de células na linhagem T e a sua posterior diferenciação em timócitos. Igualmente importante é o facto de ter sido demonstrado que NRARP está associado à via de sinalização WNT através da estabilização do factor de transcrição LEF1, capaz de induzir transformação maligna de timócitos de ratinho. Desta forma, a desregulação da função de NRARP pode desempenhar um papel na patogénese de LLA-T. Assim, o principal objectivo da presente dissertação é estudar o papel de NRARP no desenvolvimento desta doença.
6 Começámos por caracterizar a expressão de NRARP em células de LLA-T, quantificando para tal os níveis de expressão de mRNA e proteína de NRARP em linhas celulares e amostras primárias. Além disso, para investigar a sua função nestas células, NRARP foi sobre-expresso em algumas linhas celulares de LLA-T, por transdução lentiviral. Estas células foram usadas para avaliar os efeitos de NRARP na sinalização de NOTCH, através da quantificação da expressão da forma intracelular de NOTCH, bem como de alvos a jusante desta via. Foram ainda executados ensaios funcionais nas mesmas células, nomeadamente ensaios de proliferação e viabilidade, bem como de progressão do ciclo celular.
Verificámos que os níveis de proteína de NRARP estão significativamente mais elevados em células de LLA-T, comparando com timócitos saudáveis. Este resultado é consistente com o facto de NRARP ser um alvo transcricional da via NOTCH, comumente hiper-activado num contexto de LLA-T. Por outro lado, sendo NRARP um regulador negativo da via NOTCH, estes resultados sugerem que os níveis de NRARP não são suficientes para bloquear os sinais oncogénicos produzidos por esta via. Para testar essa hipótese, procedemos à sobre-expressão de NRARP em linhas celulares humanas de LLA-T e analisámos os efeitos na via NOTCH. No geral, observámos que a sobre-expressão de NRARP suprime a via NOTCH, resultando não só numa diminuição dos níveis da forma intracelular e activa de NOTCH, bem como no decréscimo da maioria dos alvos transcricionais analisados. Contudo, é importante realçar que os níveis do oncogene cMYC, um importante alvo desta via, estavam diminuídos num grupo de linhas celulares, mas aumentados num outro grupo.
Curiosamente, a análise funcional da sobre-expressão de NRARP revelou que, apesar da via de sinalização NOTCH estar bloqueada, em algumas linhas celulares NRARP inibe a proliferação, mas noutras promove a sua expansão. A análise da viabilidade e do ciclo celular, demonstrou que a sobre-expressão de NRARP não tem um impacto significativo a nível da viabilidade na maioria das linhas celulares analisadas, mas afecta a progressão do ciclo celular. Estes resultados são consistentes com as observações a nível proliferativo e com as diferenças observadas na expressão de cMYC. Ou seja, nas linhas celulares em que a sobre-expressão de NRARP induz uma diminuição na proliferação, observámos atrasos na progressão do ciclo celular e uma diminuição da expressão de cMYC. Nas linhas celulares em que a sobre-expressão de NRARP resulta num aumento da proliferação, verificámos uma progressão mais rápida no ciclo celular e um aumento na expressão de cMYC.
Uma observação interessante é o facto de as linhas celulares cujo crescimento é diminuído por NRARP apresentarem mutações em NOTCH, enquanto as linhas cujo crescimento é favorecido por NRARP, não apresentarem mutações neste gene.
Com base nestes resultados, formulámos a hipótese de que a sobre-expressão de NRARP, para além de bloquear a via de sinalização NOTCH, pode afectar directa ou indirectamente outra(s) via(s).
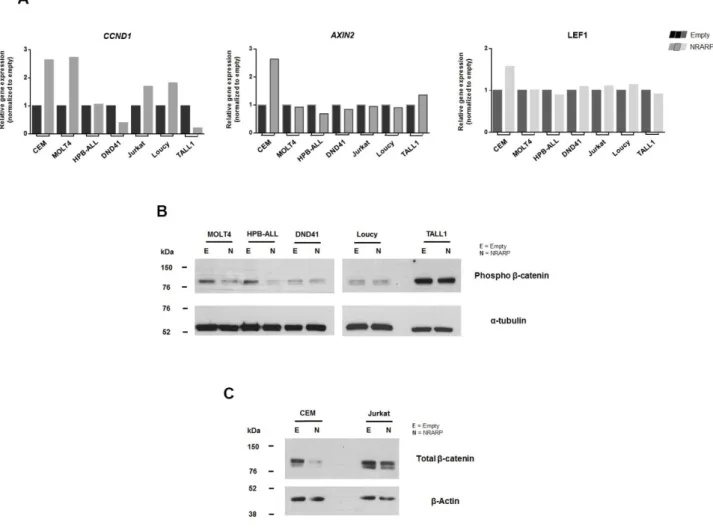
7 Uma vez que NRARP regula LEF1, um factor de transcrição da via WNT, investigámos os efeitos da sobre-expressão de NRARP na via de sinalização WNT. Ainda que bastante preliminares, os nossos resultados sugerem uma diminuição na activação da via WNT nas linhas celulares com um crescimento mais lento. Curiosamente, observámos ainda nestas linhas uma ligação entre NRARP e uma isoforma de LEF1, descrita como tendo um papel negativo na via WNT. Por outro lado, nas linhas celulares com crescimento mais rápido. observámos a interacção de NRARP com outra isoforma de LEF1, possivelmente a isoforma full-lenght. Contudo, é importante ressalvar que estes resultados são preliminares e necessitam de ser validados.
Em suma, os resultados obtidos sugerem que NRARP pode desempenhar funções opostas em LLA-T. Apesar de NRARP ser capaz de bloquear a via NOTCH em todas as linhas celulares analisadas, em células que não dependam de sinais oncogénicos produzidos por NOTCH (NOTCH wild-type), NRARP poderá afectar outra via de sinalização, tendo um papel oncogénico. Em células dependentes dos sinais oncogénicos de NOTCH (NOTCH mutado), NRARP terá um papel de supressor tumoral. A importância da via WNT e o envolvimento de LEF1 nesta dualidade na função de NRARP requer estudos mais extensivos.
Palavras-chave
Leucemia Linfoblástica Aguda de Células T (LLA-T); Via de sinalização NOTCH; Via de sinalização WNT; NRARP; LEF1
8
Abstract
T-cell acute lymphoblastic leukemia (T-ALL) is a severe hematologic malignancy, commonly associated with high frequency of relapse. NOTCH signaling is a hallmark of T-ALL pathogenesis and more than 50% of T-ALL cases harbor NOTCH activating mutations. Despite considerable clinical advances throughout the years, NOTCH signaling inhibition cannot be efficiently achieved, due to weak therapeutic effects and severe toxicity.
NRARP is a negative regulator of the NOTCH pathway and a transcriptional target of NOTCH. It
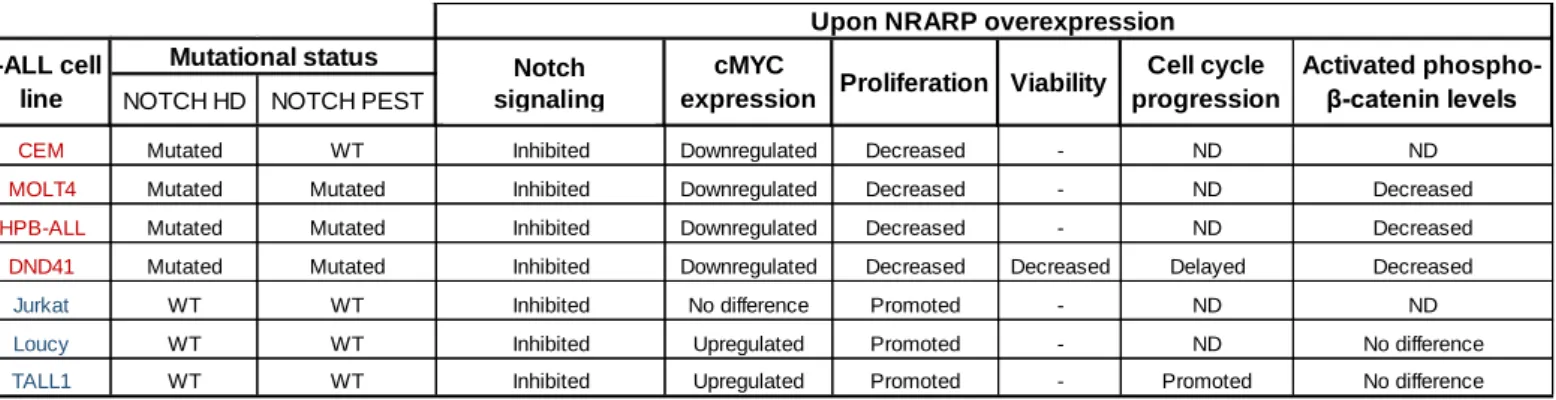
is known to regulate both T-cell lineage commitment and early differentiation. Importantly it has been shown that in NOTCH-induced T-ALL, loss of the microRNA181ab1 inhibits T-ALL development, partly by de-repressing NRARP. NRARP further modulates WNT signaling, by stabilizing LEF1, a transcription factor acting downstream of WNT pathway, shown to induce the malignant transformation of murine thymocytes. Altogether, these findings suggest that a deregulation of NRARP function may play a role in T-ALL. Thus, the main goal of this project is to understand the role of NRARP in T-ALL pathogenesis and evaluate its therapeutic potential. We started by determining NRARP expression in human T-ALL cells. We observed that NRARP protein levels are significantly increased in T-ALL comparing with human thymocytes. This result, although consistent with the fact that NRARP is a transcriptional target of NOTCH, suggests that NRARP is not sufficient to block NOTCH oncogenic signals. To test this hypothesis, we overexpressed NRARP in human T-ALL cell lines. Intriguingly, even though we observed a block in NOTCH signaling in all cell lines analyzed, functional studies revealed that while some T-ALL cells proliferate less upon NRARP overexpression, some proliferate more. Importantly, this suppression or promotion of cell expansion correlated with the changes observed in cell cycle progression (delayed or accelerated, respectively) and cMYC expression (downregulated or upregulated, respectively) in NRARP overexpressing cells and, curiously, with the mutational status of NOTCH (mutated or wild-type, respectively).
Altogether, our results suggest that NRARP is capable of blocking NOTCH signaling independently of NOTCH mutational status. Nonetheless, in T-ALL cells that depend on NOTCH oncogenic signals (NOTCH mutated cells), NRARP overexpression has a “tumor-suppressor”-like function, whereas in leukemia cells that do not depend on NOTCH oncogenic signals (NOTCH wild-type) it plays an oncogene-like role. Further studies are necessary to understand if WNT signaling contributes to this dual role of NRARP in T-ALL.
Keywords
9
Contents
Acknowledgments (Agradecimentos) ... 4
Resumo ... 5
Abstract ... 8
Index of figures ... 10
Abbreviations index ... 11
1. Introduction ... 13
Abridging T-Cell Development ... 13
T-Cell Acute Lymphoblastic Leukemia ... 14
NOTCH signaling: Central pathway in development ... 15
The Dark Side of NOTCH ... 18
Targeting NOTCH signaling in T-ALL ... 20
NRARP: A fascinating regulator of NOTCH signaling ... 21
Objectives ... 23
2. Materials and Methods ... 24
Cell culture ... 24
Lentiviral production and transduction of T-ALL cell lines ... 24
RNA analysis ... 25
Extraction and quantification ... 25
cDNA synthesis ... 25
Real-time/Quantitive PCR ... 25
Proteasome inhibitor treatment ... 26
Protein analysis ... 26
Extraction and quantification ... 26
Immunoprecipitation ... 27
Western Blot ... 27
Membrane stripping ... 28
Cell growth assays ... 28
Viability analysis ... 28
Cell cycle analysis ... 28
Statistics ... 29
3. Results ... 30
A. Characterization of NRARP expression in human T-ALL ... 30
B. Functional analysis of NRARP in T-ALL ... 32
Effects of NRARP overexpression on NOTCH signaling ... 33
NRARP effects on T-ALL cell growth, viability and cell cycle ... 34
Effects on WNT signaling ... 38
4. Discussion and conclusions ... 43
10
Index of figures
Figure 1.1: Schematic overview of T-cell development in the thymus (from Germain et al., 2002). Figure 1.2: Schematic representation of the proteolytic processing of NOTCH receptor and signal transduction of the core NOTCH pathway.
Figure 1.3: NOTCH receptors and ligands.
Figure 2.1: Map of pCDH-EF1-MCS-T2A-copGFP lentiviral vector. Figure 3.1: NRARP expression in T-ALL cells.
Figure 3.2: NRARP overexpression in T-ALL cell lines by lentiviral transduction. Figure 3.3: Effect of NRARP overexpression on NOTCH signaling.
Figure 3.4: Effects of NRARP overexpression on T-ALL cell proliferation and viability. Figure 3.5: Effects of NRARP overexpression on T-ALL cell cycle progression. Figure 3.6: LEF1 protein expression profiles in T-ALL cell lines.
Figure 3.7: Effects of NRARP overexpression on LEF1 protein expression. Figure 3.8: NRARP binding to LEF1 by immunoprecipitation.
Figure 3.9: Effects of NRARP overexpression on WNT signaling.
Tables:
11
Abbreviations index
7AAD: 7-Aminoactinomycin D
AEBSF: 4-(2-Aminoethyl) Enzenesulfonyl Fluoride Hydrochloride
ALL: Acute Lymphoblastic Leukemia AXIN2: Axis inhibition protein 2 BM: Bone Marrow
BSA: Bovine Serum Albumin CB: Cord Blood
CD: Cluster of differentiation CMJ: Cortico-medullary junction DN: Double negative
DNA: Deoxyribonucleic Acid dNTP: deoxyribonucleotide DMSO: Dimethyl sulfoxide DP: Double Positive
ECD: Extracellular domain (of NOTCH) EDTA: Ethylenediamine tetraacetic acid FACS: Fluorescence Activated Cell Sorting FBS: Fetal Bovine Serum
GFP: Green Fluorescent Protein GSI: Gamma-secretase inhibitor HBSS: Hank’s Balanced Salt Solution HD: Heterodimerization domain (of NOTCH)
HEPES: 4-(2-hydroxyethyl)-1-Piperazineethanesulfonic Acid HES: Hairy and Enhancer of Split 1
HSC: Hematopoietic Stem Cells JME: Juxtamembrane expansion KD: Knockdown
LEF1: Lymphoid enhancer-binding factor-1 MYC: Myelocytomatosis Viral Oncogene Homolog
NaCl: Sodium chloride
NaOV: Sodium Orthovanadate NICD/ICD: NOTCH Intracellular Domain/Intracellular Domain
NRARP: NOTCH-regulated ankyrin repeat protein
OE: Overexpression
PBS: Phosphate Buffered Saline PI: Propidium iodide
PI3K-Akt: phosphoinositide-3-kinase– protein kinase B/Protein kinase B
PTEN: Phosphatase and tensin homolog RNA: Ribonucleic Acid
RT-qPCR: Real Time Quantitive Polymerase Chain Reaction
SDS-PAGE: Sodium Dodecyl Sulfate-Polyacrylamide Gel Electrophoresis SKP2: S-phase kinase-associated protein 2
T-ALL: T-cell Acute Lymphoblastic Leukemia
TAN1: Translocation-associated NOTCH homolog
12 TBS: Tris Buffered Saline
TCF: T Cell Factor TCR: T Cell Receptor TEC: Thymic epithelial cells WB: Western Blot
13
1. Introduction
Abridging T-Cell Development
Constant input from thymic microenvironment is fundamental for supporting and guiding T cell development from hematopoietic stem cells (HSC) (Petrie & Zúñiga-Pflücker, 2007). Committed hematopoietic precursors from adult bone marrow (BM) are continuously recruited to the thymus, where T-lineage specification and further development take place (Koch & Radtke, 2011). The thymus is divided into four regions, which guide different stages of T cell maturation. T cells travel throughout the adult thymus, in a highly coordinated migration process (Figure 1.1) and can be distinguished by alterations in several cell-surface markers’ expression (Shah & Zúñiga-Pflücker, 2014). Thymic epithelial cells (TEC) play key roles in T cell development and different subsets of these cells are responsible for helping different phases of T cell maturation, contributing to positive and negative selection of T cells (Klein et al., 2014).
As hematopoietic precursors migrate towards the thymus, they become more restricted in their fate options. Only a small number of precursors enter the thymus, through the cortico-medullary junction (CMJ) (Lind et al., 2001). These early thymic progenitors generate a double-negative (DN) CD4- CD8- population that gives rise to γδ or αβ TCR-expressing cells (Starr et al., 2003).
DN cells development occurs over four stages, DN1 through DN4, distinguished by the differential expression of CD25, CD44 and CD117 (Koch & Radtke, 2011). DN1 cells proliferate in the CMJ (process promoted by NOTCH1-mediated signals) (Zúñiga-Pflücker, 2004) and then migrate to the cortex en route to the subcapsular zone where they differentiate into DN2 (Germain, 2002). These cells start the rearrangement of the TCR gene loci (Ciofani & Zúñiga-Pflücker, 2007) and the ones that succeed TCRβ rearrangement further proceed beyond DN3 stage (β-selection) (Takahama, 2006), a process mediated by NOTCH3 signals, for example (Bellavia et al., 2002). The cells then rearrange the TCRα locus to give rise to a functional αβ T cell receptor (TCR) (Starr et al., 2003). Past DN3 stage, DN4 cells migrate back towards the medulla, upregulating CD4 and CD8, and giving rise to double positive (DP) αβ TCR expressing cells (CD4+CD8+) (Germain,
2002). These undergo positive and negative selection, originating ultimately mature thymocytes that proceed to circulation (Takahama, 2006).
14
T-Cell Acute Lymphoblastic Leukemia
Acute Lymphoblastic Leukemia (ALL) refers to a set of malignant disorders originated from clonal expansion of lymphoid progenitors at different developmental stages. ALL is the most common leukemia among children, accounting for about 80% of childhood leukemias and 20% of adult leukemias (Durinck et al., 2015; Fullmer et al., 2009). It is the leading cause of death for patients under 20 years and has a peak of incidence between 3 and 5 years of age. An increased risk of ALL can be associated with genetic aspects but usually it is not related to inherited factors (Hunger & Mullighan, 2015).
When malignant transformation occurs in T-cell progenitors, it originates an arrest at the early stages of T cell development. This form of ALL is referred to as T-Cell Acute Lymphoblastic Leukemia (T-ALL). T-ALL covers 10%-15% of pediatric and 25% of adult ALL cases and patients usually manifest bone marrow infiltration with immature T cell lymphoblasts, high white blood cell counts and, frequently, infiltration of the central nervous system at time of diagnosis (Van Vlierberghe et al., 2012).
T-cell malignant transformation involves the occurrence of multi-step genetic alterations that can cooperate leading to the malfunction of the normal pathways that regulate cell proliferation, survival or cell cycle during thymocyte development. In this context, there are some oncogenic hallmarks associated with T-ALL, being the most meaningful, the alterations in NOTCH genes. For example, NOTCH3 is found overexpressed in almost all T-ALL cases (Bellavia et al., 2002) and genetic alterations in NOTCH1 such as translocations or mutations, which lead to the constitutive activation of NOTCH signaling, contribute to the onset and development of T-ALL (Ferrando et al., 2002; Weng et al., 2004).
15 Moreover, gene expression alterations in specific T-ALL transcription factors and their aberrant activation can lead to malignant transformation of T cells. These alterations can involve chromosomal abnormalities or abnormal genetic expression due to mutations. The chromosomal rearrangements normally place T-ALL-associated transcription factors under the control of strong TCR promoters or enhancers, resulting in their aberrant expression. Among those oncogenic factors are the basic helix-loop-helix (bHLH) family members such as TAL1, LMO family members and MYC or HOXA homeobox (HOX) genes (Ferrando et al., 2002; Van Vlierberghe et al., 2012). In addition, gain-of-function/loss-of-function mutations in oncogenes/tumor suppressor genes, respectively, can also promote T cell transformation. These comprise activating mutations in genes such as JAK1/3 or IL7 receptor (IL7R) or inactivating mutations in PTEN or GATA3 genes (Durinck et al., 2015).
Currently, the prevailing treatment of T-ALL involves multi-drug chemotherapy regimens, with specific sequences of dose and time intensity, promoting the reconstitution of normal hematopoiesis and preventing the emergence of resistant clones. This allowed T-ALL cure rates to improve dramatically over the last decades (Fullmer et al., 2009) with 75% of children and 50% of adult T-ALL cases (Oudot et al., 2008) now considered curable. Nonetheless, despite the advances in the development of T-ALL targeted therapies, it is associated with a high rate of relapse, often related to chemotherapy resistance, having these patients a worse prognosis (Bhojwani & Pui, 2013). Furthermore, current chemotherapy regimens can lead to long term severe complications (Roti & Stegmaier, 2014). Therefore, the development of more efficient and less toxic drugs is urgent and a deep knowledge of the molecular mechanisms involved in T-ALL pathogenesis is required.
NOTCH signaling: Central pathway in development
The NOTCH signaling pathway is critical to regulate normal embryonic development as well as adult tissue renewal and homeostasis through the regulation of cell fate decisions and cellular processes, such as differentiation, proliferation and apoptosis in different cellular contexts (D’Souza et al., 2010). The basis for NOTCH signaling activation is cell-to-cell interaction, promoting the link between the fate of one cell to its neighbor. Consequently, it must be able to generate appropriate signaling outputs in a variety of tissues (Andersson et al., 2011). Activation of the pathway can be obtained in a canonical or non-canonical manner (Guruharsha et al., 2012). For the purposes of this dissertationwe will only refer to the canonical cascade (Figure 1.2).
16 The key players in NOTCH signaling are the NOTCH ligands and receptors. There are five known type I transmembrane NOTCH ligands: Jagged 1 and 2 (JAG1/2) and Delta-like 1, 3 and 4 (Dll1/3/4), often referred to as DSL proteins. Jagged and Delta-like ligands differ in the presence of a C-rich domain and, in some cases, of a DOS (Delta and OSM-11) domain, which precondition the affinity to different NOTCH receptors (Kopan & Ilagan, 2009), as described in Figure 1.3B. Regarding NOTCH receptors, the mammalian NOTCH receptor family is composed by four type I transmembrane receptors (NOTCH1-4) (Figure 1.3A) (Ranganathan et al., 2011). The precursor form of these four receptors is identical and is characterized by several domains. The extracellular domain (ECD) of the receptor integrates epidermal growth factor (EGF)-like, LIN12 and NOTCH repeats, responsible for the interaction with ligands. These repeats are followed by the heterodimerization (HD) domain, which is cleaved, leading to receptor activation (Kopan & Ilagan, 2009; Ranganathan et al., 2011). The transmembrane domain is followed by the intracellular domain (ICD), comprised of protein interaction domains, nuclear localization signals and the PEST domain, known to be the target to ubiquitination for degradation (Andersson et al., 2011). Despite the common structure of NOTCH receptors, some differences in length and composition, essentially in ECD and PEST domain of NOTCH ICD (NICD), distinguishes the 4 members of this receptor family (Kopan & Ilagan, 2009).
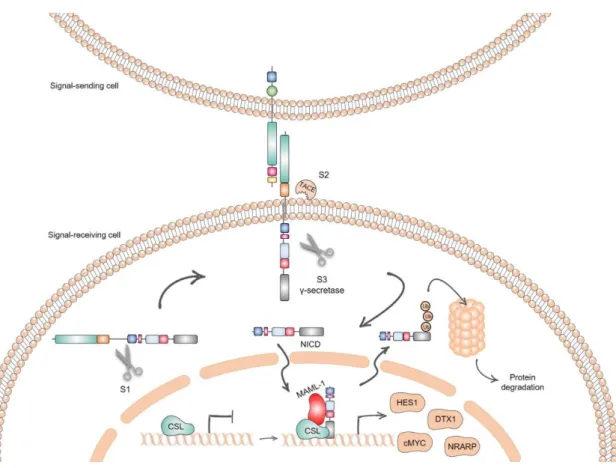
Figure 1.2 - Schematic representation of the proteolytic processing of NOTCH receptor and signal transduction of the core NOTCH pathway
17 Before signaling initiation, NOTCH precursor proteins undergo cleavage by a furin-like convertase, in the HD domain (S1 cleavage), generating the mature receptor, comprised of ECD and ICD subunits held together by non-covalent interactions (Ranganathan et al., 2011).
NOTCH signaling initiates by the engagement of NOTCH ligand to NOTCH receptor, mediated by cell-to-cell contact. This binding promotes conformational changes in the ECD of the receptor, making it prone to cleavage by the metalloproteinase Tumor Necrosis factor-α-Converting Enzyme (TACE) (S2 cleavage). This step is followed by a third, intramembrane, cleavage (S3), mediated by the presenilin–γ-secretase complex, which allows the release of the NICD from the membrane and its translocation to the nucleus. Once in the nucleus, NICD mediates the conversion of CSL repressor complex, into a transcriptional activation complex, recruiting co-activator proteins such as MasterMind-like 1 (MAML1) (Ranganathan et al., 2011). This allows the initiation of a transcriptional cascade that involves both activation and repression of target genes related to basic cellular processes.
The best-characterized NOTCH targets are the basic-helix–loop–helix (bHLH) transcriptional repressors of the hairy enhancer of split (HES) family, involved in the repression of key cell fate determinants and cell cycle regulators. An also important target of NOTCH signaling is DTX1, which encodes an ubiquitin-ligase (DELTEX1) that guides NOTCH trafficking, acting as signaling regulator in many tissues (Bray & Bernard, 2010). NOTCH signaling is also known to control
cMYC transcription, a positive regulator of cell proliferation processes (Palomero et al., 2006) and
cyclin D1 (CCDN1), involved in cell cycle progression (Ronchini & Capobianco, 2001). Recently,
NRARP gene was also identified as a target, acting as a NOTCH signaling inhibitor (Lamar et al.,
2001).
Although NOTCH signaling is one of the most remarkably simple core pathways, it is tightly regulated by complex synergistic mechanisms, enabling distinct patterns of gene expression, that are tissue and context specific (Bray, 2006).
As NOTCH signaling relies on interactions between the main pathway elements, a small difference in receptor and/or ligand surface expression will have an important impact in restricting
Figure 1.3 - NOTCH receptors and ligands. A | Structure of NOTCH receptor precursor and of the four NOTCH receptors. B | Structure of the five NOTCH ligands
18
signaling (Artavanis-Tsakonas & Muskavitch, 2010). In addition, receptor-ligand interactions in
cis or in trans can regulate signaling direction (Guruharsha et al., 2012) and post transcriptional
modifications (such as ubiquitination, glycosylation, phosphorylation or hydroxylation) of both NOTCH receptors and ligands have a major importance in modulating the signaling cascade. Moreover, regulation of NOTCH receptor endocytosis and trafficking, by proteins known to promote receptor degradation and regulate post endocytic events, such as DELTEX1 or Numb, is also an important step in signal transmission modulation (Andersson et al., 2011). Finally, the crosstalk between NOTCH and other signaling pathways such as WNT, TGFβ (Andersson et al., 2011) or PI3K-Akt (Ranganathan et al., 2011) and the cooperation with tissue-specific activators (Bray, 2006) can contribute to the induction of NOTCH signaling in different cell types and contexts. Impairment of any of these regulation layers may have a huge impact in NOTCH signaling, leading to several diseases.
In adult mammals NOTCH has decisive roles in intestinal tissue turnover, skin self-renewal, neurogenesis and synaptic plasticity, skeletal muscle regeneration and hematopoiesis (Sato et al., 2012). Regarding the latter, the best studied role for NOTCH signaling concerns T cell lineage commitment, whose major checkpoints seem to be critically regulated by this pathway. NOTCH signaling, mainly NOTCH1/Dll4 axis, is known to play a critical role during commitment of lymphoid progenitor cells into the T cell lineage, continuing to act throughout the early stages of intrathymic T-cell development (Li & von Boehmer, 2011). Besides its role during the early stages of thymopoiesis, later on, NOTCH signaling continues to regulate T-cell development, for instance during the decision between αβ or γδ lineage at DN3 stage (NOTCH1-mediated) (Taghon et al., 2009) or β-selection process (NOTCH3-mediated) (Bellavia et al., 2002). The differentiation into
single positive CD4+ or CD8+ T cells is also thought to be controlled by this pathway (Deftos &
Bevan, 2000).
Therefore, any fluctuation in any of these T cell development regulation steps can have a significant effect in tissue homeostasis, leading to several known human diseases, such as T-ALL.
The Dark Side of NOTCH
Given the role of NOTCH signaling in T cell development, it is not surprising that deregulation of NOTCH proteins was found to be involved in T-ALL. The first evidence came from the observation of a translocation between chromosome 7 and 9, juxtaposing the ECD region of the human
NOTCH1 gene to the strong promoter/enhancer of the TCRβ. This translocation originates a
truncated, ligand-independent form of NOTCH1 termed Translocation-associated NOTCH homolog (TAN1), known to induce T-ALL-like disease in mice (Hales et al., 2014; Li & von Boehmer, 2011). In humans, the frequency of this translocation is <1%.
Later on, it was shown that more than 50% of T-ALL cases harbor NOTCH1 activating mutations. These mutations cluster mainly in the HD and PEST domains. HD gain-of-function mutations lead
19 to conformational changes that destabilize heterodimers, facilitating the ligand-independent proteolysis of the receptor; PEST partial or complete deletion, promotes a decrease in NICD degradation, enhancing NOTCH1 signaling (Weng et al., 2004). Thus, both types of mutations lead to constitutive activation of the NOTCH signaling pathway, resulting in the transcription of genes involved in cell proliferation, survival and cell cycle. More recently, another type of mutation has been described, resulting in extracellular juxtamembrane expansions (JMEs), which increase the distance between HD complex and the membrane, promoting ligand-independent NOTCH signaling (Sulis et al., 2008).
Associated to NOTCH1 mutations are often mutations or deletions in FBXW7 (found in 15% of T-ALL cases). This gene encodes an F-box protein known to interact with NOTCH1, promoting is ubiquitination via the PEST domain. Mutations in this gene lead to impaired substrate recognition function, promoting the stability of NOTCH1 activated protein and, therefore, the enhanced activation of the NOTCH signaling pathway. Likewise, mutated FBXW7 performs a defective mediation of proteasomal degradation of additional oncoproteins such as cMYC, Cyclin E and mTOR (Ferrando, 2009).
As discussed above, the constitutive activation of the NOTCH pathway leads to the increased transcription of NOTCH downstream targets, with consequences in several cellular processes. However, the way these downstream targets relate to T-ALL pathogenesis is far from being completely understood.
A large body of evidence indicates that cMYC is a critical direct target of NOTCH signaling in T-ALL context, being responsible for regulating cell growth and proliferation and promoting cell cycle progression (Li & von Boehmer, 2011). Other proteins involved in cell cycle have also been associated with NOTCH signaling in T-ALL development. Cyclin D3, encoded by the CYCD3 gene, was identified as a direct target of NOTCH, and its expression contributes to cell-cycle progression in NOTCH-mediated T-ALL (Joshi et al., 2009). Furthermore, the protein SKP2, a subunit of the ubiquitin-ligase SCFSKP2, responsible for the degradation of p27Kip1 and p21Cip1, was
identified as a direct transcriptional target of NOTCH in T-ALL. Importantly, up-regulation of SKP2 by NOTCH signaling accelerates the entry in the S phase of the cell cycle, due to increased degradation of p27 and p21 (Sarmento et al., 2005).
Finally, the crosstalk of NOTCH aberrant signaling with other signaling pathways is key for its oncogenic role in T-ALL. In this regard, it has been shown that NOTCH1 induces PI3K-AKT activation via upregulation of HES1 (NOTCH downstream target), which negatively controls the expression of PTEN, a PI3K-AKT signaling pathway negative regulator. These studies demonstrated an indirect regulation of PTEN by NOTCH signaling, which contributes to secondary oncogene addiction to PI3K-AKT signaling during T-ALL development and treatment resistance (Palomero et al., 2008).
In addition, NOTCH signals are known to positively regulate the activity of the mTOR pathway in T-ALL (Chan et al., 2007), as well as to induce cell transformation through several signaling
20 pathways such as NF-κB (Vilimas et al., 2007), Ras-MAPK/ERK (Li & von Boehmer, 2011), and possibly WNT signaling (Weerkamp, van Dongen, et al., 2006).
Regarding the latter, it is known to regulate several developmental processes and it was found, similarly to NOTCH signaling, to be required for the first stages of T-cell development in the thymus (Weerkamp, Baert, et al., 2006). The oncogenic role of WNT signaling has been identified in several types of cancers. Surprisingly, despite WNT signaling role in T cell development, there are opposing evidences regarding its function in T-ALL.
Some studies point WNT signaling as having a tumor suppressive role in T-ALL. In this context, increased β-catenin-mediated WNT signaling was shown to promote the anti-leukemic effects of histone deacetylase inhibitors in T-ALL cells (Shao et al., 2012). Supporting these data, LEF1 inactivating mutations were described in approximately 15% of T-ALL patients (Gutierrez et al., 2010). Arguing the opposite, some studies suggest WNT signaling as an oncogenic event in ALL. Abnormal WNT pathway activation was shown to occur in a significant fraction of human T-ALL cases, in a NOTCH-independent manner (Ng et al., 2014), with significant upregulation of WNT target genes. Supporting these data, LEF1 was shown to be highly expressed in T-ALL patients, in association with a high mutation rate of NOTCH1 and JAK1, suggesting its involvement in leukemogenesis (Guo et al., 2015).
It was further demonstrated that TCF1 and LEF1 might have cooperative and opposing roles in T cell malignancy. TCF1-deficient mice develop an aggressive T cell malignancy, similar to human T-ALL. Interestingly, LEF1 was found highly upregulated in pre-malignant TCF1-deficient thymocytes and its conditional inactivation prevented disease development (Yu et al., 2012). Targeting NOTCH signaling in T-ALL
The discovery of NOTCH mutations provided a rationale for therapeutic targeting of NOTCH signaling. In this regard, Weng and colleagues demonstrated that T-ALL cell lines are sensitive to γ-secretase inhibitors (GSI). These, originally developed as a therapy for Alzheimer’s disease, block signaling at S3 cleavage, thus avoiding NICD release to the nucleus and, therefore, transcription activation. However, given NOTCH signaling crucial role in diverse tissues’ homeostasis, the use of GSI results in severe side effects, particularly gastrointestinal toxicity (due to off-target effects) (Andersson & Lendahl, 2014). Nonetheless, combinational therapy with GSIs and glucocorticoids can improve the anti-leukemic effects of these inhibitors and reduce their toxicity, in mice (Real et al., 2009). Other approaches to target NOTCH signaling have been developed. These include the inhibition of NOTCH receptors or its ligands individually, a strategy used for example to target NOTCH1 in leukemias (Wu et al., 2010) and NOTCH ligand DII4 in solid tumors (Briot & Iruela-Arispe, 2015). Yet, these strategies lead to long-term off-target effects, associated with intestinal and hepatic toxicity and the development of vascular tumors (Andersson & Lendahl, 2014). Thus, improved knowledge on the oncogenic mechanisms controlled by NOTCH in T-ALL is crucial to develop more effective and less toxic therapeutic approaches. One possibility to target effectively NOTCH signaling is to explore its downstream targets and their
21 specific role in T-ALL pathogenesis. An interesting candidate is the recently described NOTCH target NRARP, NOTCH Regulated Ankyrin Repeat Protein. This protein is known to negatively regulate NOTCH signaling and positively regulate WNT signaling (by LEF1 protein stabilization). Moreover, it was recently found that loss of microRNA181ab1 in NOTCH-induced T-ALL inhibits leukemia development, partly by de-repressing the expression of NRARP (Fragoso et al., 2012). These data make NRARP into an attractive candidate to study in T-ALL context.
NRARP: A fascinating regulator of NOTCH signaling
NRARP is a gene that encodes a conserved small protein containing two ankyrin repeats. Its
transcription is activated by CSL-dependent NOTCH signaling and can modulate NOTCH-mediated transcription by binding to NICD and promoting its degradation, acting, therefore, as negative feedback regulator of the pathway (Lamar et al., 2001). NRARP was first identified in
Xenopus embryos and afterwards in mammals, namely mouse embryos. Mouse’s NRARP was shown to share great homology with human NRARP (Krebs et al., 2001) and was confirmed as a direct target of NOTCH signaling, process mediated by Su(H) protein (Pirot et al., 2004).
NRARP was firstly shown to play an important role in embryogenic processes such as development of the central nervous system and somite formation (Krebs et al., 2001). During neurogenesis, NRARP is expressed in regions where NOTCH signaling is active, such as the neural plate. It was found that its overexpression decreases NOTCH signaling, leading to an increase in the number of primary neurons forming within the neural plate (Lahaye et al., 2001). Moreover, in mouse somitogenesis, NRARP is expressed in a cycling manner and contribute to severe Dll3 (NOTCH ligand) mutant phenotype, not only by NOTCH signaling regulation but also WNT pathway modulation (Sewell et al., 2009).
NRARP was confirmed as a NOTCH signaling downstream target in mouse hematopoietic stem
cells (HSC) and T cells (Yun & Bevan, 2003) and in CD34+ human umbilical cord blood (CB) cells
(Van Walle et al., 2009; Weerkamp, Luis, et al., 2006). In vitro studies with mouse HSC and T cells showed that NRARP overexpression is capable of inhibiting NOTCH-mediated activation and, in vivo, to specifically inhibit T cell development, by blocking T lineage commitment and progression through the DN stages (Yun & Bevan, 2003). In fact, studies with human CD34+ cells
show that NRARP expression is high in extrathymic CB progenitors and maintained in uncommitted thymocyte, butupon T-cell commitment, its expression is sharply downregulated. This allows further progression into T-cell development, confirming NRARP role as a negative regulator of NOTCH signaling in this context (Van Walle et al., 2009).
NRARP was also shown to regulate WNT signaling. In zebrafish’s embryonic development, NRARP was shown to stabilize LEF1 protein by blocking its ubiquitination and consequently to positively regulate WNT signaling (Ishitani et al., 2005). These studies are important because they revealed that NRARP independently regulates canonical NOTCH and WNT signaling (through NICD and LEF1 respectively). This role of NRARP as a molecular link between NOTCH signaling and LEF1-dependent WNT signaling was further demonstrated, in endothelial cells, in
22 both mice and zebrafish studies. During sprouting angiogenesis, Dll4-mediated NOTCH signaling induces NRARP expression in stalk cells, which will limit NOTCH signaling and promote WNT signaling (through interaction with LEF1), to maintain stability during the angiogenic process (Phng et al., 2009). These data demonstrate that NRARP can regulate both NOTCH and WNT signaling, which might be valid in other cellular contexts.
Considering the importance of NRARP in T cell lineage commitment and the involvement of NOTCH and WNT signaling in T-cell leukemogenesis, these observations suggest that deregulation of NRARP may contribute to T-ALL pathogenesis. Moreover, the discovery of miR-181ab1 regulation of NRARP in T-ALL (Fragoso et al., 2012), make it a prone candidate to be involved in disease development.
All together, these data indicate that NRARP deregulation or mutated expression may impair its function, contributing to T-ALL development. Due to the adversities in targeting NOTCH signaling with the available drugs, we believe that understanding the role of NRARP in T-ALL pathogenesis might have considerable clinical relevance. Targeting NRARP as a therapeutic approach represents an unexplored strategy to modulate NOTCH signaling, which may improve the current panorama of T-ALL targeted therapies.
23
Objectives
Despite the improvement on the survival of T-ALL patients over the years, patients with relapsed or resistant disease show decreased survival. This makes it imperative to find alternative therapeutic strategies, more specific and effective.
Different therapeutic NOTCH-targeting approaches have been explored but all have been associated with high toxicity and insufficient anti-leukemic effects. For that reason, a better understanding of the oncogenic mechanisms underlying NOTCH signaling in T-ALL is necessary to develop novel targeted therapies, to ultimately improve patients’ outcome.
Therefore, in this project, we aimed to understand a possible role for NRARP in T-ALL pathogenesis and to investigate its therapeutic potential to target NOTCH oncogenic signaling. This project will improve our understanding of the leukemogenic process and potentially overcome the challenging inhibition of NOTCH signaling. Our main goals were to:
1. Characterize NRARP expression in human T-ALL by:
a. Analyzing NRARP mRNA and protein levels in T-ALL cell lines and primary cells and comparing it with total thymocytes;
b. Investigating a correlation between NRARP levels and NOTCH signaling activation (NICD levels).
2. Investigate the functional role of NRARP in T-ALL cells, in vitro, by:
a. Dissecting the effects of NRARP overexpression on NOTCH signaling;
b. Exploring the effects of NRARP overexpression on cell proliferation, viability and cell cycle.
To address these goals, we used several T-ALL cell lines, corresponding to different differentiation stages and presenting diverse genetic alterations, as well as human primary leukemia samples.
24
2. Materials and Methods
Cell culture
T-ALL cell lines, corresponding to different developmental stages and presenting distinct mutational profiles, were used in the in vitro studies (CEM, MOLT4, HPB-ALL, DND41, Jurkat, Loucy and TALL1). These were cultured in RPMI-1640 medium with L-glutamine (Gibco), supplemented with 10% of fetal bovine serum (FBS) (Biowest), 1% penicillin/streptomycin (Gibco) and 1% 4-(2-hydroxyethyl)-1-piperazineethanesulfonic acid (HEPES) (Gibco) (hereafter referred
to as R10 medium). Cells were kept in culture at a density of 0,5x10⁶ cells/mL (with the exception
of HPB-ALL cultured at a density of 1x10⁶ cells/mL), at 37ºC in 5% CO2 environment.
The cell lines established during this project by the stable transduction of pCDH empty vector and pCDH cloned with NRARP ORF vector (see subchapter “Lentiviral production and Transduction of T-ALL cell lines”) were cultured in the same conditions as the parental cell lines.
Lentiviral production and transduction of T-ALL cell lines
Lentiviral vectors, derived from HIV-1, are capable of infecting a wide variety of dividing and nondividing cells, and to stably integrate their RNA into the host genome, resulting in the long-term expression of a transgene. These vectors can be designed to express (constitutively or conditionally) both transgenes and shRNAs in single units or multiple combinations (Tiscornia et al., 2006).
To address the functional effects of NRARP in T-ALL we performed overexpression studies. For that purpose, we transduced T-ALL cells (CEM, MOLT4, HPB-ALL, DND41, Jurkat, Loucy and TALL1) with lentiviruses produced using the lentiviral vector pCDH-CMV-MCS-T2AcopGFP from SBI (Figure 2.1) with NRARP ORF cloned in, as described in Fragoso et al., 2012. This vector contains a Green Fluorescent Protein (GFP) tag to allow transduced cells to be detected by flow cytometry.
Figure 2.1 - Map of pCDH-EF1-MCS-T2A-copGFP lentiviral vector. The expression vector contains, for example, a constitutive Elongation factor 1α (EF1) promoter (for transcription of reporter and cloned cDNA insert), a T2A peptide (to mediate protein cleavage from a single open reading frame to generate multiple proteins from a single promoter) and a copepod green fluorescent protein as a reporter for the transduced cells. (Figure from SBI Cloning and Expression Lentivectors Manual)
25 Cells transduced with the pCDH Empty vector will be referred to as ‘Empty’ and cells transduced with pCDH NRARP vector will be referred to as ‘NRARP OE’.
Cell infection was performed by spinoculation (centrifugation at 2300 rpm, 120 minutes at room temperature) of 2x10⁶ cells per mL of viruses, in the presence of 8µg/mL of polybrene.
Transduction efficiency was accessed by Fluorescence Activated Cell Sorting (FACS) analysis of GFP expression, using a LSRFortessa flow cytometer (FITC channel, Blue laser, 488nm), 48-72h after infection. Cells were sorted for 100% GFP-positive purity using a BD FACSAria™ cell sorter.
RNA analysis
Extraction and quantification
Harvested cells were centrifuged at 3200 rpm for 5 minutes at 4ºC and the pellet resuspended in 1mL of TRIzol® Reagent (Ambion™, ThermoFisher Scientific) and stored at -80ºC. RNA extraction was performed according to the TRIzol® RNA isolation protocol (ThermoFisher Scientific). RNA pellets were resuspended in DNase/RNase free H2O and stored at -80ºC. RNA
quantification was performed using a NanoDrop 2000 UV-Vis spectrophotometer (Thermo Scientific) and absorbance measurements at 230, 260 and 280nm were taken to evaluate RNA purity. Only the RNAs with an A260/280 ratio between 1.8 and 2 and an A260/230 ratiohigher than 1.8
were used to proceed with cDNA synthesis protocol. cDNA synthesis
cDNA synthesis was performed using 500ng of RNA (in a volume of 10µL). Upon denaturation at 65ºC for 10 minutes, 10µL of cDNA synthesis mix was added to the RNAs (Random Primers 50ng/µL, mix dNTPs 10 mM, Dithiothreitol (DTT) 0,1M, 5x First Strand Buffer, Recombinant Ribonuclease Inhibitor (RNase Out) 400U/µL, Super Script II Reverse Transcriptase 200U/µL (Invitrogen)). Synthesis was performed in a T100™ Thermal Cycler (Bio-Rad), programmed for 10 minutes at 25ºC plus 50 minutes at 42ºC and 15 minutes at 70ºC. cDNA was stored at -20ºC. Real-time/Quantitive PCR
In order to quantify gene expression in NRARP overexpressing T-ALL cell lines (and respective control cells), Quantitive/Real-time PCR was performed using TaqMan or SYBR Green methods. The expression of NRARP was quantified using TaqMan Gene Expression assays and Master Mix (Applied Biosystems), following manufacturer’s instructions (Thermo Fisher Scientific). The expression of the remaining genes was quantified using Power SYBR Green PCR Master Mix (Applied Biosystems, Life Technologies) and specific primers, as follows:
hHES1 Forward: 5’ GCA GAT GAC GGC TGC GCT GA 3’
Reverse: 5’ AAG CGG GTC ACC TCG TTC ATG C 3´
hDTX1 Forward: 5’ CAG CTT GTG CCC TAC ATC ATC 3’ Reverse: 5’ ACG ACG GGT CGT AGA AGT TG 3’
26 hcMYC Forward: 5’ GGC TCC TGG CAA AAG GTC A 3’
Reverse: 5’ CTG CGT AGT TGT GCT GAT GT 3’
hNOTCH1 Forward: 5’ GAG GCG TGG CAG ACT ATG C 3’ Reverse: 5’ CTT GTA CTC CGT CAG CGT GA 3’ hCCND1 Forward: 5’ CAA TGA CCC CGC ACG ATT TC 3’
Reverse: 5’ CAT GGA GGG CGG ATT GGA A 3’ hLEF1 Forward: 5’ TGC CAA ATA TGA ATA ACG ACC CA 3’
Reverse: 5’ GAG AAA AGT GCT CGT CAC TGT 3’
hAXIN2 Forward: 5’ CTC CCC ACC TTG AAT GAA GA 3’
Reverse: 5’ GTT TCC GTG GAC CTC ACA CT 3’
h18S Forward: 5’ GGA GAG GGA GCC TGA GAA ACG 3’ Reverse: 5’ CGC GGC TGC TGG CAC CAG ACT T3’
The PCR reactions were performed using ViiA™ 7 Real-Time PCR System (ThermoFisher Scientific). Gene expression was normalized using the gene 18S, and relative mRNA expression was calculated using the 2-∆∆Ct method (according to manufacturer’s instructions).
Proteasome inhibitor treatment
To analyze the expression of proteins with fast turnover, we used a proteasome inhibitor in order to block protein degradation.Cells were treated with 1µL/mL of MG-132 inhibitor (10mM in DMSO, Calbiochem), at a cell density of 1x10⁶ cells/mL and incubated for 8h at 37ºC.Cells were then
harvested, centrifuged at 3200 rpm for 5 minutes at 4ºC and lysed as described below.
Protein analysis
Extraction and quantification
Cells were harvested and centrifuged at 3200 rpm for 5 minutes at 4ºC. Cell pellet was resuspended by repetitive pipetting with Lysis Buffer (50mM Tris-Base pH 8.0, 150 mM NaCl, 5mM EDTA, 1 mM NaOV (Sigma), 10 mM NaF, 10mM Sodium Pyrophosphatase (Sigma), 1% NP-40), supplemented with protease inhibitor cocktail Complete Mini (Roche) and protease inhibitor AEBSF (1 mM). Lysates were then centrifuged at 13000 rpm for 20 minutes at 4ºC and supernatants were collected and stored at -20ºC. Total protein quantification was accessed using Bradford reagent (Bio-Rad), at a 1:500 v/v dilution in H2O. Quantification was obtained using
GeneQuant pro (Amersham Biosciences) spectrophotometer at a 595nm wavelength (Protein595 Program).
27 Immunoprecipitation
Cells were harvested and washed twice with PBS (3200 rpm, 5 minutes, 4ºC). Cell pellet was resuspended by repetitive pipetting with RIPA Buffer (50mM Tris-Base pH 8.0, 150 mM NaCl, 0,5% SDS, 0,5% Sodium Deoxycholate, 0,1% NP-40), supplemented with protease inhibitor cocktail Complete Mini (Roche) and protease inhibitor AEBSF (1 mM). Lysates were then centrifuged at 13000 rpm for 20 minutes at 4ºC and supernatants were collected. Total protein quantification was accessed using Bradford reagent and GeneQuant pro, as described above. 250µg of total protein were diluted in RIPA buffer to a final volume of 492µL and incubated overnight at 4ºC with 8µL of a specific antibody (Santa Cruz Biotechnology), with rotation. To allow antibody precipitation, beads (25µL/sample) Protein A/G (sc-2003, Santa Cruz Biotechnology) were washed in PBS, equilibrated for 1h at 4ºC with rotation and added to the samples, rotating afterwards for 3h30 at 4ºC. Samples were then centrifuged at 5000rpm for 5 minutes and the supernatants were collected and stored at -20ºC (for later confirmation of the immunoprecipitation efficiency). The pellets were washed four times in RIPA buffer, rotating for 15 minutes in the first two. Supernatants were then discarded and pellets stored at -20ºC. Western Blot
Protein extracts were resuspended in Laemmli buffer and denatured at 90ºC for 5 minutes. Samples (50µg-100µg of protein depending on the protein to be analyzed), were loaded in a SDS-PAGE gel (10%, 12%, 14% or 16% of acrylamide depending on protein molecular weights), ran at a constant voltage for variable periods of time and then transferred onto a nitrocellulose membrane for 90 minutes at 400 mA. The Ponceau S solution (Sigma) was used to evaluate the protein’s content. Membranes were blocked during 1 hour with 3% w/v skimmed milk or 5% w/v Bovine Serum Albumine (BSA), diluted in Tris-Buffered Saline with 0.1% Tween 20 (TBS-T buffer). Immunoblotting was then performed using desired diluted primary antibodies: Cleaved NOTCH1 (Val1744) (1:1000), LEF1 (C18A7) (1:1000), α-Tubulin (1:10000) (Cell Signaling Technology), NRARP (E-13) (1:200), phospho-β-catenin (Ser675) (1:1000), total β-catenin (1:1000), Histone H3 (1:1000) and β-Actin (1:1000) (Santa Cruz Biotechnology). This incubation was done overnight at 4ºC, under soft agitation. In the following day, membranes were washed for variable time intervals in TBS-T and incubated for 1 hour, at room temperature, with the respective horseradish peroxidase-conjugated secondary antibodies (anti-rabbit IgG (1:5000, Promega), anti-mouse IgG (1:5000, Promega) or anti-goat IgG (1:5000, Santa Cruz Biotechnology)), diluted 1:5000 v/v in 3% milk/TBS-T buffer solution or TBS-T buffer alone, as adequate. Membranes washed after secondary antibody incubation were stained using Pierce ECL Plus Western Blotting Substract (Thermo Fisher Scientific Inc.) and immunodetection was carried by chemiluminescence using Curix60 (AGFA HealthCare).
28 Membrane stripping
In order to re-blot the membranes, priorly incubated antibodies were removed by stripping process. Membranes were incubated in Stripping Buffer (15 mM Tris Base, 100 mM 2-β- Mercaptoethanol (Sigma), 2% SDS, pH=6.7), supplemented with 1:1000 v/v dilution of 2-β- Mercaptoethanol and incubated at 56°C for 30 minutes, with agitation. Membranes were then thoroughly washed with H2O and TBS-T (twice, for 10 minutes each time, with agitation). After
the stripping process and washing, a new immunoblot was performed, starting from the blocking step, as described above.
Cell growth assays
To access the cell growth potential of NRARP overexpressing T-ALL cell lines, expansion and proliferation assays were carried out. Expansion assays were performed by culturing a fixed number of “Empty” and “NRARP OE” cells at optimal density (see subchapter “Cell culture”) and determining cell number using a hemocytometer and trypan blue stain (for dead cells exclusion) at days 3, 6, 9, 12 and 15, only in some cases. For proliferation experiments, 1,5x10⁵ cells were
plated at optimal culture conditions and then harvested at 24, 48, 72 and 96h. Cell number was determined by FACS analysis (LSR Fortessa, APC channel, Red laser, 633nm) using counting beads (Beckmon Coulter, 10µm, diluted and counted using a hemocytometer before use).
Viability analysis
Cell viability was accessed in NRARP overexpressing T-ALL cell lines at several time points: 24, 48, 72 and 96h. Apoptosis was determined using AnnexinV-APC (since transduced cells contain a GFP tag, read in FITC channel) and necrosis evaluated using the 7AAD dye. 1,5x10⁵ cells were
plated at optimal culture conditions and then harvested at determined time points, washed with ice-cold PBS and resuspended in 100 µL Annexin V Buffer 1x (eBioscience). 2 µL of 7AAD (BD Pharmingen) and 1 µL Annexin V-APC (eBioScience) were added to cell suspension and incubated for 15 minutes at room temperature, in the dark. Afterwards, 200 µL Annexin V Buffer were added and viability was accessed by FACS analysis (LSR Fortessa, APC channel, Red laser, 633nm).
Cell cycle analysis
To analyze cell cycle profiles of NRARP overexpressing T-ALL cell lines (as comparing with empty control vectors), 1x10⁶ cells were incubated for 1h at 4°C and plated afterwards into 12-well plates
at optimal density. Cells were then collected, washed, resuspended in cold PBS and fixed with equal volume of 80% ethanol in PBS (drop by drop, vortexing gently). Before staining, cells were washed twice with cold PBS and incubated with RNase A solution of 50 µg/mL in PBS, for 30 minutes at 37ºC. Propidium iodide (PI) was added at a concentration of 2,5x10⁻³µg/µL and
incubated overnight. Cell cycle profile was accessed the following day by FACS analysis (using a FACSCalibur, FL2 channel, 585/42nm).
29 We have further characterized the cell cycle profiles of NRARP overexpressing cells but starting with cells in the same phase of the cell cycle. To avoid chemical synchronization, we have sorted DND41 and TALL1 NRARP OE and Empty cells in G1 cell cycle phase, using for that purpose the Vybrant® DyeCycle™ Violet Stain. This is a non-fluorescent DNA dye that allows the use of the violet laser of flow cytometers to determine the DNA content in living cells. Cells were resuspended in Hank's Balanced Salt Solution (HBSS) buffer (Thermo Fisher Scientific) and Vybrant® DyeCycle™ Violet stain was added at the following concentrations: for TALL1, 19µL/mL with 19x106 cells and for DND41, 5µL/mL with 15x106 cells (adjusted based on TALL1 sorting
assay). Cells stained were incubated for 30 minutes at 37ºC, protected from light and finally analysed/sorted on a BD FACSAria™ Cell Sorter (containing a violet laser, 407nm), without being washed nor fixed.
Data was analyzed using FlowJo™ or ModFit LT™ software, as appropriate.
Statistics
Statistical analysis was performed using GraphPad Prism 6.01 (Windows). Differences between values were calculated using Student’s t-test, One-way ANOVA or Two-way ANOVA, as appropriate. P values were considered statistically significant when lower than 0,05.
30
3. Results
A. Characterization of NRARP expression in human T-ALL
The first goal of this project was to characterize NRARP mRNA and protein expression in human T-ALL cells. For that purpose, we analyzed NRARP expression in several T-ALL cell lines and human primary samples (collected at patients’ diagnosis) and compared it to that in normal thymocytes, collected from healthy donors. In order to analyze NRARP expression at both mRNA and protein levels we used real-time PCR and Western Blot (WB), respectively.
We started by exploring NRARP expression in T-ALL cell lines and primary cells, presenting diverse genetic alterations, in order to have a biologically relevant range of samples. Since
NRARP is a transcriptional target of NOTCH signaling, which is aberrantly activated in T-ALL,
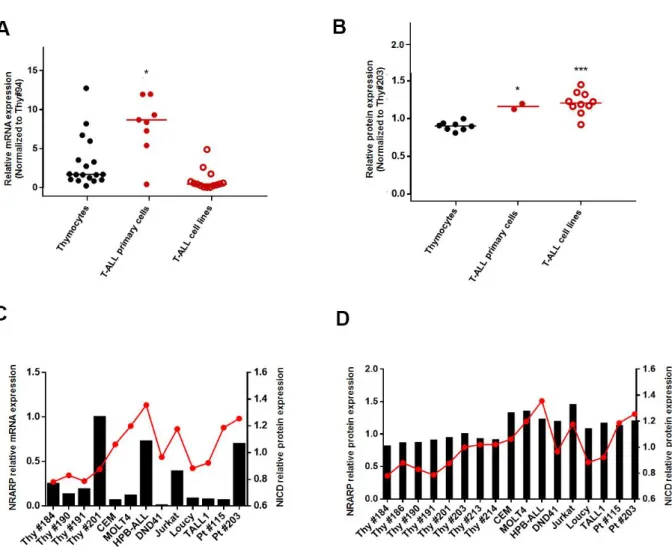
one could expect NRARP expression to be upregulated. However, since NRARP is also a target of miR-181ab1, which is upregulated in T-ALL (Fragoso et al., 2012), it was possible that NRARP would be downregulated instead. We started by analyzing NRARP expression at the transcriptional level. We observed that NRARP mRNA expression is higher in T-ALL primary samples than in control thymocytes (Figure 3.1A). At the protein level, NRARP levels are significantly higher in both T-ALL cell lines and primary cells comparing with control thymocytes (Figure 3.1B). These results are consistent with the hypothesis that, as a NOTCH target, NRARP is overexpressed as a result of NOTCH signaling aberrant activation in T-ALL cells.
Afterwards, and given that NRARP is not only a transcriptional target of NOTCH1, but also a negative regulator of this pathway, we sought of determining NICD levels, in order to explore a possible correlation with NRARP levels.
As observed in Figure 3.1C, although some T-ALL samples present both high levels of NRARP mRNA and of NICD protein, others (for example Pt#115) present high levels of NICD protein but low levels of NRARP mRNA. We did not observe also an association between NRARP and NICD protein levels (Figure 3.1D). Thus, we found no statistically significant correlation between NICD protein levels and NRARP mRNA expression or NRARP protein levels (Figure 3.1).
31
The observation that NRARP protein levels are high and NICD is still active, raises an important question: If NRARP levels are increased, why is it unable to block NOTCH signaling? One hypothesis, given the abnormal levels of NOTCH signaling, is that NRARP levels are not sufficient to block NOTCH oncogenic signals. Another hypothesis is that the occurrence of mutations in
NOTCH or NRARP may impair their interaction and, consequently, NRARP function.
Figure 3.1 – NRARP expression in T-ALL cells. A | NRARP mRNA relative expression in T-ALL primary samples, T-ALL cell lines and human thymocytes, determined by RT-qPCR and calculated using the 2-∆∆Ct method. Ct values were normalized against the 18S gene and NRARP expression was normalized against a control thymocyte sample. B | NRARP protein relative expression in T-ALL primary samples, T-ALL cell lines and human thymocytes, determined by Western Blot. Expression levels were normalized to their respective loading control and relative protein levels were obtained by normalization against a control thymocyte sample. Statistical analysis was performed using One-way ANOVA. *p≤0.05; ***p<0.001. | Correlation graphs between
NRARP mRNA (C) and protein relative levels (D) and NICD protein levels.
32
B. Functional analysis of NRARP in T-ALL
To understand if NRARP levels are not enough to downregulate NOTCH signaling in T-ALL, we overexpressed NRARP in T-ALL cells and studied its functional effects on NOTCH signaling activation and cell proliferation and viability. Thus, we generated several stable T-ALL cell lines (CEM, MOLT4, HPB-ALL, DND41, Jurkat, Loucy and TALL1) overexpressing NRARP by lentiviral transduction of pCDH NRARP vector or the Empty vector (to establish the correspondent control cell lines).Cells transduced and sorted for a 100% GFP-positive purity were used for subsequent studies. NRARP overexpression was confirmed by analysis of NRARP mRNA (by RT-qPCR) and protein expression (by Western Blot) (Figure 3.2). In order to obtain a clearer visualization of NRARP protein in the WB, we decided to use a proteasome inhibitor, MG-132, to block ubiquitin-mediated degradation. The detection of NRARP by WB revealed two bands at the protein level (Figure 3.2B). The higher band (full arrow) should correspond to the endogenous ubiquitin-conjugated NRARP protein and the lower sized band (dashed arrow), to the NRARP exogenous form.
After confirming NRARP overexpression in T-ALL cells we proceeded to the analysis of NOTCH signaling.
Figure 3.2 – NRARP overexpression in T-ALL cell lines by lentiviral transduction. A | NRARP mRNA relative expression in T-ALL cell lines after stable transduction, determined by RT-qPCR and calculated using the 2-∆∆Ct method. Ct values were normalized against the 18S gene and NRARP expression was normalized against the respective empty vector control. B | NRARP protein expression in T-ALL cell lines after transduction, determined by Western Blot. Two NRARP forms were identified. The higher band corresponds to endogenous NRARP (full arrow) and the lower band might correspond to exogenous NRARP (dashed arrow). β-Actin was used as loading control.
33
Effects of NRARP overexpression on NOTCH signaling
To analyze the functional effects of NRARP overexpression in T-ALL cells we started by analyzing its effects on NOTCH signaling, not only in what regards NICD levels but also NOTCH downstream targets.
Using NRARP overexpressing cell lines, we started by assessing NICD protein levels by Western Blot. We observed that, overall, NRARP overexpression leads to a decrease in NICD protein levels in T-ALL cell lines (Figure 3.3A). Interestingly, we noticed that in most cell lines (CEM, Jurkat, Loucy, HPB-ALL and TALL1), NRARP overexpression leads to NICD degradation via the proteasome, since inhibition of the proteasome with MG-132 inhibitor restores NICD levels. By contrast, in DND41 and MOLT4 cells, NRARP overexpression decreases NICD levels in a proteasome-independent manner (NICD levels upon NRARP overexpression are maintained low in the presence of MG-32 inhibitor) (Figure 3.3A).
We next analyzed the mRNA expression of NOTCH signaling downstream targets upon NRARP overexpression, to understand how it would affect the pathway. Evaluating mRNA levels of HES1,
DTX1 and NOTCH1, we observed that there is an overall block on NOTCH signaling. In particular, cMYC levels are decreased by NRARP overexpression in a group of cell lines (CEM, MOLT4,
HPB-ALL and DND41), whereas in other cells (Jurkat, Loucy and TALL1) they are maintained or increased (Figure 3.3B).
34
These results suggest that the impaired ability of NRARP to block NOTCH signaling, does not seem to stem from putative mutations in the NOTCH domain that interacts with NRARP. If that was the case, NRARP overexpression should not result in a block of NOTCH signaling transcriptional activity and/or promote NICD degradation.
NRARP effects on T-ALL cell growth, viability and cell cycle
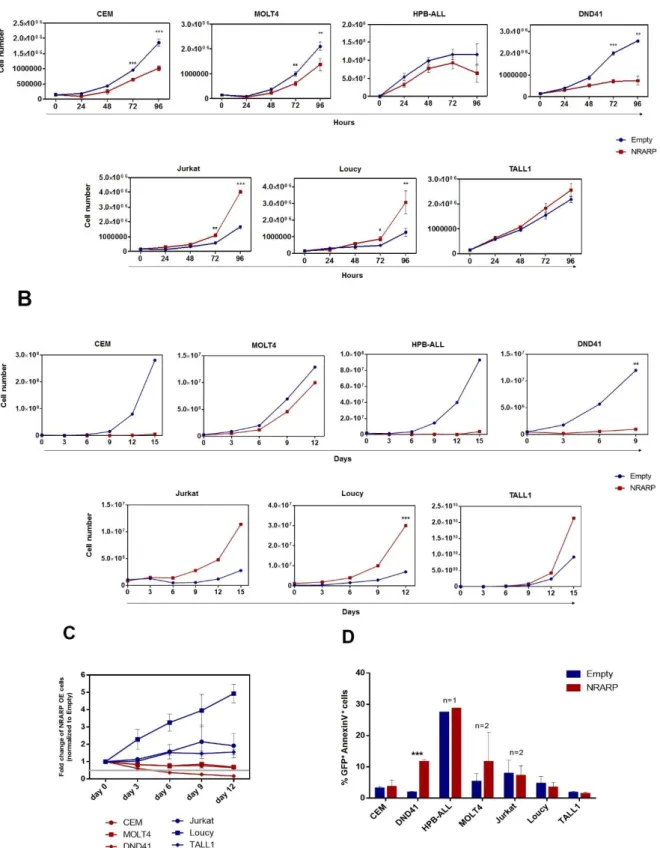
Besides exploring NRARP overexpression effect on NOTCH signaling, we also wanted to understand if NRARP overexpression has a functional impact in terms of cell proliferation, viability and cell cycle.
We started by performing proliferation assays to evaluate the effects of NRARP overexpression in T-ALL cells. Cell proliferation potential was assessed by flow cytometry using counting beads
Figure 3.3 – Effect of NRARP overexpression on NOTCH signaling. A | NICD protein expression in T-ALL cell lines overexpressing NRARP, determined by Western Blot. To better analyze protein levels, samples were stimulated with proteasome inhibitor MG-132. The same cells were stimulated with DMSO, as a mocking control. β-actin was used as loading control. B | Human HES1, DTX1, cMYC and NOTCH1 mRNA expression in T-ALL cell lines overexpressing NRARP, determined by RT-qPCR and calculated using the 2-∆∆Ct method. Ct values were normalized against the 18S gene and gene expression was normalized against the respective empty vector control.