APPLICATION OF SDMA WITH SCHEDULING FOR MIMO MC-CDMA
Valdemar Monteiro(1), Jonathan Rodriguez(1), Atílio Gameiro(2)(1) Instituto de Telecomunicações, Univ. Aveiro, 3810-193, Aveiro, Portuga, Email:{vmonteiro|jonathan}@av.it.pt
(2) Dept. Electrónica & Telecomunicações Univ. Aveiro, 3810-193, Aveiro, Portugal Email: amg@det.ua.pt
ABSTRACT
Incoming Beyond 3G systems provides high data rates by using several techniques including Beamforming. Convenient DRA design is required to optimize the capabilities offered by smart antennas. This paper is to presents a DRA algorithm based on the HSDPA of UMTS, including scheduling that exploit SDMA technique that was implemented in the ambit of the IST 4MORE project. Results shown cell throughput gain of SDMA compared to sectorized cells about 76%, and that SDMA gain will increase with user diversity within the cell.
1. INTRODUCTION
Demand for high bandwidth multimedia services targeting high mobility provided the impetus to supersede legacy technologies, such as UMTS and HSDPA that can currently target a peak data rate at 2 Mbps, and 12 Mbps respectively. The ITU-R (International Telecommunication Union Radio communication Sector) responsible for setting the evolutionary roadmap towards B3G has defined the next milestone [1]: a beyond IMT 2000 system (International Mobile Telecommunications) that can support up to 100 Mbps peak bit rate in high mobility scenarios. The MATRICE (MC-CDMA Transmission Techniques for Integrated Broadband Cellular Systems) project was a European candidate solution for B3G cellular communications that investigated the feasibility of MC-CDMA to provide broadband access on-the-move in a cost-effective manner. The MATRICE vision targeted a maximum information bit rate of more than 2-20Mbps in a vehicular environment and possibly 50-100Mbps in indoor to pedestrian environments, using a 50-100MHz bandwidth [2]. Especially in the downlink, high throughput is needed since the number of downloads of large data files from web sites and servers will increase and broadcast / multicast services may become a reality that has to be accommodated by 4G systems. To support the transport of variable size IP packet over the radio, a Dynamic Resource Allocation (DRA) [3-5] scheme was designed that uses a HARQ (Hybrid Automatic Repeat ReQuest) transmission protocol based on Chase Combining, link adaptation scheme, code allocation policy and scheduling to select the appropriate transmission format according to the channel conditions and service requirements. However, to progress towards
a spectrally efficient communication systems with increased cell capacity through MTMR techniques (Multiple Transmit Multiple Receiver), the 4MORE project investigated a cost effective, low power System on Chip (SoC) solution for multi-antenna MC-CDMA mobile terminals based on the joint optimization of L1 (Layer1) and L2 (Layer 2) functions [6].
In order to fully utilise the potential offered by MIMO (Multiple Input Multiple Output) signal processing techniques at L1, we propose a cross-layer design that uses Dynamic Resource Allocation (DRA) with SDMA (spatial division multiple access) to ensure the seamless transport of variable size IP packets over the air-interface. SDMA has been addressed extensively [7-9] as a means of tapping into the high data rates on offer by using multiple antennas. The joint application of smart antennas with MIMO has the ability to allocate selected users a common radio resource given that they can be spatially separated.
In this paper, we aim to address the system level aspect of the 4MORE air-interface in an attempt to quantify the broadband capabilities of the system thanks to the MIMO signal processing techniques introduced at L1. We propose an integrated dynamic resource allocation architecture that exploits cross-layer parameters to facilitate the allocation of users in the spatial domain in a cost effective manner whilst still ensuring Quality of Service.
This paper considers the following sections: section 2 provides an overview of the SDMA principle considered in this work; Section 3 describes the Dynamic Resource Allocation (DRA) that exploits SDMA using MIMO transmission techniques, specifically we emphasize the main design assumptions that were targeted for the simulation scenarios; in section 4 the system level simulation parameters for the targeted scenarios and simulation results are presented; and the conclusions are given in section 5.
2. SYSTEM MODEL WITH SDMA 2.1. SDMA principle
SDMA exploits MIMO transmit techniques to increase cell capacity by facilitating the allocation of users in the spatial domain. Beamforming is based on the principle that an antenna pattern is steered by applying a weight, i.e. a complex number to each antenna element. The
pattern weight is represented by a weight vector, which contains one weight per antenna element. The linear nature and number of antenna elements enables the end user to point the antenna beam to a selected direction, maximising the Signal-to-Interference plus Noise ratio (SINR) for the desired data stream, whilst minimising potential co-channel interference.
The application of smart antennas at the system level allows two users to be allocated the same resource as long as they can be spatially separated, the separation distance dependant on the antenna radiation pattern as shown by Fig. 1. By adjusting the antenna weights to maximise the SINR, two antenna beams can be pointing at the desired co-channel users MSi, and MSj, and will
suffer minimal cross talk between beams as long as their angular separation (AoS) θi,j is sufficiently apart; a
value dependent on the on the antenna beamwidth. This principle can be applied to both the downlink (DL) and the uplink (UL).
Figure 1 SDMA principle based on angular separation 2.2. Antenna pattern
Fig. 2 shows the antenna pattern used by the transmitter. This pattern is obtained theoretically with an array with four antennas separated by 0.5 wavelengths. This pattern consists in a 3dB beamwidth of about 35 degrees and a maximum side lobe of -13.46dB. Although, in the simulations we assume that no co-channel interference exists for θi,j ≥ 45 degrees.
Figure 2. Smart Antenna beamforming pattern
Fig. 3 presents the antenna pattern proposed by 3GPP for a 3-sector cell with a 3dB beamwidth of 70 degrees. The gain for this antenna is 14dBi. By reducing the beamwidth by half, to 35 degrees, the corresponding gain will be 3dB higher resulting in 17dBi [10]. This is the corresponding antenna gain used for the SDMA simulations.
3 Sector Antenna Pattern
-25 -20 -15 -10 -5 0 -120 -100 -80 -60 -40 -20 0 20 40 60 80 100 120 Azimuth in Degrees G a in in d B .
Figure 3 Antenna pattern for 3 sectors cells proposed by 3GPP
3. DYNAMIC RESOURCE ALLOCATION DRA is the entity located at the Medium Access Control (MAC) layer responsible for mapping the user logical channels to the available transport channels in a cost effective manner. DRA is designed so as to optimize the radio resource usage whilst maintaining service quality. The proposed DRA architecture targeted in 4MORE is based on [11] and [12]. It constitutes Link Adaptation, Link Layer Interface, Scheduling and Hybrid Automated Request (H-ARQ), each described in the next subsections.
3.1. Link Adaptation
Link adaptation is used to adjust transmission parameters due to wireless channel and offers several challenges. Adaptive Modulation and Coding (AMC) falls under a category of link adaptation by adapting the appropriate modulation and channel coding rate to the variations of the wireless channel. First of all, AMC is sensitive to channel measurement error and delay. In order to select the appropriate modulation the scheduler must be aware of the channel quality. Errors in the channel estimation will cause the scheduler to select the wrong data rate and either, in some cases transmit at too high power, wasting system capacity, or too low power, raising the block error rate. Delay in reporting channel measurements also reduces the reliability of the channel quality estimation due to the constantly varying mobile channel. Furthermore, changes in the interference add errors to the measurement. HARQ enables the implementation of AMC by reducing the number of
BS MS
MS θi j
required Modulation and Coding Scheme (MCS) levels and the sensitivity to measurement error and traffic fluctuations.
3.1.1. Channel Quality Indicator
Concerning the quality of the wireless channel, in the proposed Radio Resource Management (RRM) scheme it is assumed that the Node-B will select the transport format according to the Channel Quality Indication (CQI) reported by the user equipment (UE) [12]. It is also assumes perfect channel estimation by the UE. However there is an associated delay between the channel estimation and reporting to the Node-B. The delay between channel estimation by the UE and reporting to the Node-B is two frames. An IIR (Infinite Impulse Response) filter was used to smooth the channel estimations, with new data being weighted by 70% and the previous filter estimate being weight by 30%.
3.1.2. MCS selection algorithm
The Modulation and Coding Scheme selection is defined by the following statement which allows a 90% probability of successful transmission at the highest MCS according the Channel Quality Indicator (CQI) in the transmission interval (TTI) t:
() ( ((1-BLER(CQI(t))) 0.9) arg ≥ =MAX MCSi t MCS i (1) where the BLER is the predicted Block Error probability related to the CQI identification during the TTI t. 3.2. Link Layer Interface
The interfacing to the link layer is based on a set of look-up tables (LUT) simulated using the 4MORE air interface [13]. The mapping between SIR and BLER is based on the EESM methodology [14]. The LUT (Fig. 4) covers the transport formats based on UMTS convolutional channel coding having the constraint length K=9 and rates equal 1/2, 2/3 and 3/4 rate encoding using QPSK and 16QAM modulations, with the respective payloads presented in Tab. 1.
4More LUT 1.E-05 1.E-04 1.E-03 1.E-02 1.E-01 1.E+00 -16 -14 -12 -10 -8 -6 -4 -2 SIR (dB) BL E R MCS0 (QPSK, R=1/2) MCS1 (QPSK, R=2/3) MCS2 (QPSK, R=3/4) MCS3 (16QAM, Rc=1/2) MCS4 (16QAM, Rc=2/3) MCS5 (16QAM, Rc=3/4)
Figure 4 EESM LUT
Table 1. MCS and respective payloads Modulation and Coding Rate Block Size (bits) Max. Bit rate (Mbps) QPSK, R=1/2 504 15.12 QPSK, R=2/3 672 20.16 QPSK, R=3/4 756 22.68 16QAM, R=1/2 1008 30.24 16QAM, R=2/3 1344 40.32 16QAM, R=3/4 1512 45.36 3.3. Scheduling Policy
The DRA is based on a TDD system, with the resource space illustrated by Fig. 5. Resource space is defined in terms of time slot, code and space. The frame size is three slots, two slots allocated to DL and one slot allocated to the UL. The system evaluation however will consider only DL.
In the DL, each time slot and spatial bin consists of 32 codes, where 30 codes are allocated for data transmission, one code is allocated to the common pilot channel (CPICh) and one code is allocated to the broadcast channel (BCH).
Figure 5 SDMA resource space definition.
In order to exploit spatial diversity the resource allocation mechanism evaluates the Mobile Stations (MSs) AoA on every scheduling period resulting in a
spatial diversity list. The packet scheduler is a max C/I
scheduler that assigns a priority to each packet according to channel strength. Therefore associated with each packet we have 2-samples, i, and σi , where i
represents the packet order in the maxC/I list (where the users are ordered in terms of decreasing channel strength) and σi is the associated AoA.
Let us define the following parameters • Nc: number of available codes
• Ns: maximum number of spatially separable
channels (number of beams supported in the sector) • ∆θmin: Minimum required AoS for the PHY
(Physical) layer to be able to separate two MSs It is clear that due to the introduction of the spatial dimension, we can increase the number of scheduled packets in one time slot from Nc which is the maximum
allowable codes with a SISO channel up to a maximum number equal to Ns Nc .
Let us define an array of dimension Ns Nc , where Nc is
the number of codes and Ns the number of spatial
columns. The elements of the array will contain packet indices of the packets to be scheduled.
3.4. H-ARQ
The type II Automatic repeat request (ARQ) with Chase’s combining is adopted as an error control technique. In this hybrid ARQ scheme, all retransmitted packets are combined at the receiver in order to form a more reliable estimate of the transmitted data. The ARQ scheme will be only applied to traffic that is tolerant to delays (web traffic).
4. NUMERICAL RESULTS 4.1. Simulation Scenario
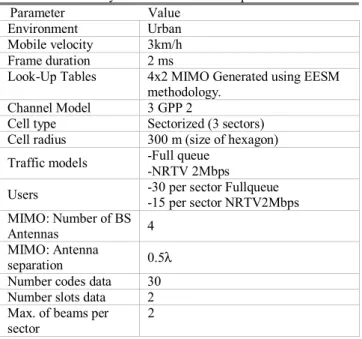
Tab. 2 summarizes the simulation parameters based on the 4MORE target scenario detailed in [15]. Concerning the traffic models, the full-queue traffic option is characterized by an always-full user transmission buffer; this is the commonly adopted model for evaluating system capacity. For the Near Real Time Video option, the source rate is 2Mbps and is based on the modelling approach in [16].
Table 2. System-level simulations parameters Parameter Value Environment Urban
Mobile velocity 3km/h
Frame duration 2 ms
Look-Up Tables 4x2 MIMO Generated using EESM
methodology.
Channel Model 3 GPP 2
Cell type Sectorized (3 sectors)
Cell radius 300 m (size of hexagon)
Traffic models -Full queue -NRTV 2Mbps
Users -30 per sector Fullqueue -15 per sector NRTV2Mbps
MIMO: Number of BS
Antennas 4
MIMO: Antenna
separation 0.5λ
Number codes data 30
Number slots data 2
Max. of beams per sector
2
Scheduler type Max C/I
Link Adaptation BLER ≤ 0.1
Some simplifying assumptions were assumed in the simulations. No spatial beam interference is taken into account for two MSs MSi and MSj separated by angle of
separation θi,j≥ θmin, that is 45 degrees.
4.2. Results
4.2.1. Full queue traffic
Fig. 6 shows the average Over-The-Air (OTA) throughput and average service sector throughput; where the OTA is the total number of bits transmitted over the air-interface, and the service throughput is the number of successfully transmitted bits within the simulation time [12].
Average cell throughput
0 10 20 30 40 50 60 70 80 90 100 Theoretical Capacity OTA Service Thr oug hpu t(m bps
) DRA using SDMADRA w ithout SDMA
Figure 6 Full queue average sector throughput for DRA with SDMA vs. non-SDMA case
Results have shown that with SDMA, the Over-The-Throughput (OTA) for the full-queue case can reach up to 72 Mbps resulting in a throughout gain of 31 Mbps over non-SDMA DRA case. Lack of diversity gain due to low number of users reduces the simulated SDMA gain. Service Throughput is around 58 Mbps for SDMA and 38 Mbps without SDMA. The discrepancy between service and OTA, although slight, is due to users being serviced at the cell edge which will normally experience poor signal quality.
4.2.2. NRTV 2 Mbps
Fig. 7 presents the results of DRA under NRTV traffic for SDMA vs. non-SDMA case. The use of service traffic models means that the effect of SDMA is less pronounced as in the case of the full queue case, especially for NRTV. Furthermore, we notice a 4Mbps drop in service throughput compared to the OTA. Using traffic models with a pronounced activity factor and large packet sizes will increase the SDMA cell throughput since users with the highest channel
propagation conditions would be continuously served with the highest MCS option (16 QAM, ¾ rate encoder) avoiding under utilization of resources.
Fig. 8 presents the percentage of satisfied users. Improved results can be attained by using: greater density of users to improve multi-user diversity gain, and a priority –based scheduler to increase the number of satisfied users. The scheduling policy will affect the trade-off between maximization the cell throughput using SDMA, and keeping the number of satisfied users at an acceptable level.
Average sector throughput
0 5 10 15 20 25 30 OTA Service Thr o ugh pt ( M bps ) With SDMA Without SDMA
Figure 7. NRTV 2Mbps average sector throughput for SDMA vs. non-SDMA Satisfied Users 48.5% 49.0% 49.5% 50.0% 50.5% 51.0% 51.5% 52.0%
With SDMA Without SDMA
Figure 8. Percentage of satisfied users for NRTV Obtained results lead to conclude that the performance of SDMA is affected by the likelihood of finding a user pair that has an angle of separation greater than the required separation, in this case 45 degrees. User density will affect the amount of multi-user diversity that can be exploited by the scheduler, a low density will reduce the average MCS utilization option (lowest option corresponds to QPSK with ½ rate encoder). A radiation pattern with a lower angular beamwidth will increase the likelihood of finding a user pair within a given coverage area.
We also provide the spectral efficiency of the system for the given deployment strategy and scheduler configuration for SDMA vs. non-SDMA. We define the
Spectral Efficiency as the ratio of correctly transmitted
bits over the air-interface to the amount of useful
bandwidth; units given in b/s/Hz. Although there are several variations to this definition, we adopt the 3GPP definition as presented in Tab. 3.
Table 3. 4MORE Spectral Efficiency
Symbol Quantity Value
Weff Effective system bandwidth 41.7 MHz
Ltdd TDD Loss 0,67
EBand Weff * Ltdd 27,93 MHz
Lguard Loss due to guard times,
UL/DL round trip time etc.. 0,718
E´Band EBand * Lguard 20.06 MHz
Lcontrol No. of data codes /Total no.
of codes
0,9375
Uband Useful Band (EBand * Lguard*
Lcontrol)
18.80 MHz
Smax Achievable Service Sector
Throughput 38.5 Mbps
Smax (SDMA) Achievable Service Sector
Throughput (SDMA)
58.5 Mbps
SEmax Spectral efficiency (effective
bandwidth)(Smax/ E´Band) 1.92
SEmax Spectral efficiency (Useful
bandwidth) (Smax/Uband) 2.05
SEmax(SDMA) Spectral efficiency (effective
bandwidth) (Smax/ E´Band) 2.92
SEmax(SDMA) Spectral efficiency (Useful
bandwidth) (Smax/Uband) 3.11
5. CONCLUSION
A DRA architecture that uses smart antenna to facilitate SDMA was proposed for the 4MORE air-interface. Simulation results have shown that significant capacity gain can be achieved by employing SDMA in the cross-layer design for DRA operating over MC-CDMA MTMR techniques. In this SDMA case study we conclude that user density will affect the amount of multi-user diversity that can be exploited by the DRA. Also, the number of antenna elements will define the theoretical capacity gain, and the radiation pattern will dictate the user SIR distribution in the cell.
In summary, the application of SDMA to DRA led to a 1.5 increase in the spectral efficiency compared to the non-beamforming case.
ACKNOWLEDGEMENT
The work presented in this paper was partially supported by the IST ACE2 026957 and the FCT CROSSNET POSC/EEA-SRI/57503/2004 projects. 6. REFERENCES
1. ITU-R, “Vision, framework and overall objectives of the future development of IMT-2000 and systems beyond IMT-2000”, draft new recommendation ITU-R M. [imt-vis] [doc. 8/110], Feb. 2003.
2. IST MATRICE, http://www.ist-MATRICE.org/, IST-2001 32620
3. Liang Xu, Xuemin Shen,and Jon W. Mark, Dynamic bandwidth allocation with fair scheduling for WCDMA systems, IEEE Wireless Communications, vol. 9, no. 2, April 2002, pp. 26-32
4. A. Stamoulis, N. D. Sidiropoulos, G. B. Giannackis, Time-varying fair queueing scheduling for multicode CDMA based on dynamic programming, IEEE transactions on Wireless Communications, vol. 3, Issue 2, March 2004, pp. 512-523
5. L. Xu, X Shen, J. W. Mark, Aggressive Code-Division Generalized Processor Sharing for QoS guarantee in Multimedia CDMA Cellular Networks, Proc. IEEE Globecom02 – ieeeplore.ieee.org
6. IST 4MORE, http://www.ist-4more.org/, IST-2002 507039
7. Godara, L., “Application of Antenna Arrays to Mobile Communications, Part II: Beamforming and Direction-of-Arrival Considerations”, Proceedings of the IEEE, Aug. 1997, vol. 85, No 8, pp.1195-1245
8. Hara, Y. “Time Slot Assignment Algorithm for SDMA/TDMA System Based on Estimated SINR”, IEICI Trans. Commun., Vol E84-B, No. 2, Feb 2001
9. C. Hoymann, H. Meng, “Influence of SDMA-Specific MAC Scheduling on the Performance of IEEE 802.16 Networks”, 12th Europeean Wireless
Conference, Athens, 2-5 April 2006
10. 3GPP, TR25.996 "Spatial channel model for multiple Input Multiple Output (MIMO) simulations," v6.1.0, 2003-09
11. D. T. Phan Huy, V. Monteiro, A. Gameiro, J. Rodriguez, “System level performance evaluation of MATRICE air interface”, Proceedings of IST-Summit 2004
12. 3GPP, TR25.848 " Physical layer aspects of UTRA High Speed Downlink Packet Access ," v4.0.0, 2001-03
13. J. Rodriguez, V. Monteiro, R. Legouable, n. Ibrahim, M. Shateri, “4MORE System Level
Performance”, VI International
Telecommunications Symposium (ITS2006), September 3-6, 2006, Fortaleza-CE, Brazil
14. Ericsson, “Effective SNR mapping for modelling frame error rates in multiple-state channels,” 3GPP2-C30-20030429-010
15. IST-4MORE, ‘‘Intermediate version evaluation platform including a description of simulation library,’’ Deliverable D2.2a, 4MORE IST-2002 507039
16. 3GPP, TR25.892, "Feasibility Study for Orthogonal Frequency Division Multiplexing (OFDM) for UTRAN enhancement," v6.0.0, 2004-06.