Does Trade Help to Explain Tourism Demand?
The Case of Portugal
Nuno Carlos LEITÃO Polytechnic Institute of Santarém, ESGTS, Portugal nunocarlosleitao@gmail.com
Abstract. The tourism industry has expanded in recent years due to internal and external environmental forces. These forces, income, trade, consumer price, and geographical distance are interconnected.
Accounting for imperfect competition and increasing returns to scale, the new trade theory offers the explanation of dynamic gains from international trade. A large number of studies attempt to test the hypothesis that there is a link between trade and tourism. Most of the studies show that trade and tourism are positively correlated.
This paper specifies static and dynamic panel demand models for tourism in Portugal and estimates demand equations using tourist inflow data for the period 1995-2006. We find that bilateral trade, immigration, border, and geographical distance between Portugal and countries of origin are the main determinants of tourism to Portugal. The dynamic panel data approach indicates that trade, population, and income are more important determinants than relative price.
Keywords: trade; tourism demand; panel data; tourism forecasting; qualitative methods; Portugal.
JEL Code: M21. REL Code: 14F.
Introduction
International trade researchers such as Gray (1982), Kulendran and Wilson (2000), Eliat and Einav (2004), and Phakdisoth and Kim (2007) typically explained tourism demand by income in tourist generating countries, price of tourist services, transport costs and promotional expenditures.
International trade is the most important player in economics. Little mention is made of tourism. Tourism is a significant source of export revenues for any country. It is important that policymakers and economists understand the factors affecting foreign tourism demand. In other words, this export commodity allows us to understand international economics. Poor quality of data has been a persistent problem in tourism studies. The majority of studies focus on travel flows among developed countries.
This paper argues and provides evidence that bilateral trade has a positive impact on tourism demand. Recent literature, including Phakdisoth and Kim (2007), Mervan and Payne (2007), and Vogt (2008), considers that tourism demand is a dynamic phenomenon.
Tourism suffers from a lack of recognition as a discrete subject area; consequently, understanding this dynamic phenomenon requires an exploration of the interactions between and among variables like groups or stakeholders, who posses the power to influence governmental and community action.
However, this study uses a static and dynamic panel data set between Portugal and the European Union (EU) for the period 1995-2006. In static panel data models, Pooled OLS, fixed effects (FE) and random effects have some problems, like serial correlation, heteroskedasticity and endogeneity of some explanatory variables. In dynamic panel data models, the GMM-SYS (Arellano, Bover, 1995, Blundell, Bond, 1998, 2000) estimator eliminates the unobserved specific effects through the equations in differences. The GMM-SYS estimator also controls for the endogeneity of explanatory variables.
We also introduced the Tobit model to forecast tourism demand. This methodology is important in forecasting policy implications.
Our panel data applies Newton’s gravitational law. Gravity models are based on the gravity law of spatial interaction. These models have been popular in tourism studies.
This paper argues and provides evidence that trade has a positive effect on tourism demand. Because trade can influence tourism demand, bilateral trade brings a preference for home-country products and can reduce transaction costs between home and host country.
How can trade increase tourism demand?
In this section, we present theoretical reasons to argue that bilateral trade has a positive effect on the share of tourism demand.
We consider that trade can influence tourism demand for two reasons. First, bilateral trade brings with it a preference for home-country products. Second, bilateral trade can reduce transaction costs between home and host country.
The mechanism of trade links
Cultural, historical and geographical proximity can also reduce transaction costs and promote tourism. Eilat and Einav (2004) and Phakdisoth and Kim (2007) found a positive impact of trade on tourism demand. Tourism demand could be explained by different factors. It is assumed that consumers rank alternatives.
The trade and tourism demand
In general, the literature on tourism demand focuses on the determinants, as in cost of transport, price, income in tourism generating countries, and population. The last proxy is very important to analyse the population changes. According to the literature, this variable is correlated with immigration (Witt, Witt, 1995; Oigenblick, Kirschenbaum, 2002). We consider that immigrants bring with them a preference for home-country products. For that reason, this phenomenon can reduce trading transaction costs. Tourism can be thought of as a form of temporary international migration. Some studies show that immigrants could promote the tourism of their host country with their family and friends (Oigenblick, Kirschenbaum, 2002; Dwyer et al., 1992).
In 1933, Bertil Ohlin concluded his seminal book on international trade theory. Ohlin believed that international trade theory is simply international localisation theory.
When economists discuss tourism, they normally think of many sectors linked through an input-output matrix.
Following Carey (1991), Fuji and Mark (1997), we consider that demand for travel exports is equal to:
(
GDP PR TRADE POP DIST)
f TOURit = , , , , (1) where: 0 DIST / f , 0 POP / f , 0 fTRADE / f , 0 PR / f , 0 GDP / f ∂ > ∂ < ∂ ∂ > ∂ > ∂ ∂ < ∂
and:
TOURit is the number of tourist arrivals;
GDP is the income in tourist generation countries; PR is the relative price;
TRADE is the bilateral trade;
POP is the total population in tourist generation countries; DIST is the geographical distance.
Empirical studies
In this section, we present a survey of empirical studies. The review of the empirical literature on tourism demand by Crouch (1994), Witt and Witt (1995), Mervan and Payne (2007), Carrey (1991), and Lim (1997) suggests that tourist demand is measured as in tourist arrivals and departures, with tourist receipts as the dependent variable. The number of nights spent in the country has also been included, but much less frequently. For explanatory variables, the empirical models of tourism demand use consumer’s income, the price of services, exchange rate, and distance.
The study by Vanegas Sr M. (2009) applied to Latin American countries and specifies an autoregressive model. The author incorporated lagged variables to evaluate the determinants of international tourism demand. The econometric model was formulated to evaluate the international tourism demand by residents of Argentina, Brazil, Colombia and Venezuela to Aruba.
Previous empirical studies on tourism, such as Carrey (1991), Jud and Joseph (1974), or Fuji and Mark (1981), have found income to be the most significant variable.
Some studies, including Mervan and Payne (2007), incorporate the dynamics of tourism demand for lagged effects on supply constraints. These authors study the demand for tourism for Croatian destinations. We can refer to other studies like Carey (1991), who studied Caribbean tourism demand.
Daniel and Ramos (2002) studied the cointegration to Portugal, including five countries of origin: France, Germany, Netherlands, Spain and UK. The authors concluded that forecasting tourism demand is important to analyse the country’s economy. The econometric methodology showed that cointegration is non-existent in Portuguese tourism demand.
More recently, Phakdisoth and Kim (2007) specify static and dynamic panel data (GMM-DIF) models for tourism in Laos and estimate tourism demand equations. The authors concluded that communication for transportation infrastructures, destination risk, bilateral trade, and geographical distance are the main determinants of tourism in Laos.
Shareef and McAleer (2005) analysed the link between tourism demand and volatility as in ethnic diversity, political and economic system and environment.
The study of Vogt (2008) estimates real income and relative price of demand for US exports and imports of tourism. The author concluded that US trading partners appear to be more sensitive to the determinants of international tourism than in the US.
Econometrical model
Tourist visits can take place for various reasons: holidays, business trips, visits to friends and relatives, and others.
The dependent variable used is the number of arrivals at destination (i) from origin (j) in a given year staying in hotels (TOUR). Tourist nights spent in the destination country are an alternative measure. The data explanatory variables are sourced from the World Bank, World Development Indicators (2008), and the Bank of Portugal. The source used for the dependent variable was INE (National Institute of Statistics).
Explanatory variables and testing of hypothesis
Hypothesis 1: Tourism demand will be influenced by income in the country of origin of the tourists.
LogGDP is the logarithm of GDP per capita in tourist countries (PPP, in current international dollars). According to the literature, we expected a positive sign. Income in the origin country is the most frequently used explanatory variable. Most researchers have relied on nominal or real (per capita) personal or national income and GDP or GNP as measures (or proxies) for income in the origin. The studies consider that income is highly significant as a determinant of demand.
Hypothesis 2: Trade partners are an important vehicle to expand tourism.
Following Eliat and Einav (2004) and Phakdisoth and Kim (2007), we consider: ⎟ ⎟ ⎠ ⎞ ⎜ ⎜ ⎝ ⎛ + + = k Portugal i i it GDP GDP M X LogTRADE (2) where:
Xi represents the annual exports of Portugal to the country of origin of
Mi represents the annual import of Portugal from each tourist’s country of
origin at time t;
GDPk is the GDP per capita in tourist countries (PPP, in current
international dollars).
Eilat and Einav (2004) and Phakdisoth and Kim (2007) found a positive sign when the authors used this proxy.
Hypothesis 3: Population changes are a result of high immigration from a particular country.
According to the literature (Witt and Witt, 1995, and Oigenblick and Kirschenbaum, 2002), we expected a positive sign. The authors show the level of tourism depends not only on the population of the origin country, but also on the immigrants from the destination country.
Population of the country of origin is also included as an explanatory variable, LogPOP, although it is theoretically incorrect to exclude population. This proxy is important to analyse the impact of population changes. Most studies do not consider this variable, because population tends to be highly correlated with income (multicollinearity problems). Jud and Joseph (1974) and Fuji and Mark (1981) found a positive sign.
Hypothesis 4: Macroeconomic variables influence the price of tourist service. k Portugal k Portugal it E E CPI CPI LogPR = × (3) where:
LogPRit, is the logarithm of relative price, CPI is the index of consumer
price (Portugal and partner) and Eit represents the exchange rate (Portugal
and partner). According to the literature, a negative sign is expected.
Hypothesis 5: Tourism increases if the transportation cost decreases.
LogDIST is the logarithm of geographical distance between and the partner country. The cost of transports is important as a policy variable. According to the literature, we expected a negative sign.
Model specification it i it 1 0 it X t TOUR =β +β × +δ +η +ε (4) where:
TOURit is the number of tourist arrivals, X is a set of explanatory variables. All variables are in the logarithm form; ηit is the unobserved time-invariant specific effects; δ captures a common deterministic trend; t εit is a random disturbance assumed to be normal and identically distributed (IID) with E (εit)=0; Var (εit)=σ2 >0.
The model can be rewritten in the following dynamic representation:
it i 1 it 1 it 1 1 it it TOUR X X t TOUR =ρ× − +β × −ρ×β × − +δ +η +ε (5)
Estimation results: static panel
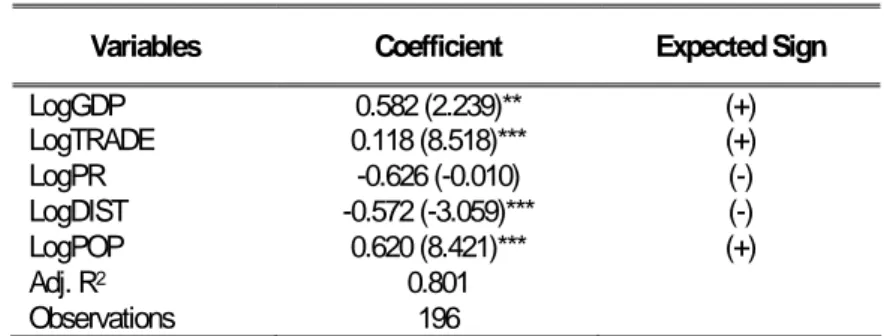
In Table 1, we see the results with the fixed effects estimator. The explanatory power is very high (Adjusted R2=0.851). All explanatory variables are significant (LogGDP at 5%, LogTRADE, LogDIST, and LogPOP at the 1% level), with the exception of LogPR.
The variable GDP is statically significant, with an expected positive sign. One of the main determinants of tourism demand is the positive impact in the Portuguese economy. Vanegas Sr M. (2009) and Phakdisoth and Kim (2007) also found this result.
The variable LogTRADE is statistically significant with a correct sign. This result demonstrates that trade partners are an important vehicle to expand tourism. The studies of Eilat and Einav (2004) and Phakdisoth and Kim (2007) found this result.
The coefficient of LogDIST (Distance) is negative, as expected. This result confirms the gravitational model and the importance of the neighbourhood.
The variable population (LogPOP) finds a positive sign. Jud and Joseph (1974) and Fuji and Mark (1981) also found a positive sign.
Table 1 The impact of trade on Portuguese tourism demand:
Fixed effects
Variables Coefficient Expected Sign
LogGDP 0.582 (2.239)** (+) LogTRADE 0.118 (8.518)*** (+) LogPR -0.626 (-0.010) (-) LogDIST -0.572 (-3.059)*** (-) LogPOP 0.620 (8.421)*** (+) Adj. R2 0.801 Observations 196 T-statistics (heteroskedasticity corrected) are in round brackets. ***/** - statistically significant, at the 1% and 5% levels, respectively. Tobit model
The original model was suggested by James Tobin (1958).
In Table 2, we present the tobit estimator. Our analysis pretends to evaluate the signs of the coefficients and their significances. Comparing the Tobit estimates with the fixed effects, we note that relative price (PR) becomes significant with a correct sign (negative sign). This result is according to the finds of Vanegas Sr. (2009), Naude Saayman (2005), and the theoretical models.
The variable GDP is statically significant with an expected positive sign. As expected, the variable LogTRADE has a significant and positive effect on tourism demand (Eliat and Einav, 2004, and Phakdisoth and Kim, 2007). The coefficient of LogDIST (Distance) validates Hypothesis 5. This result confirms again the importance of the neighbourhood. The proxy of population (Log POP) validates the theoretical models.
Table 2 The impact of trade on Portuguese tourism demand:
Tobit model
Variables Coefficient Expected Sign
LogGDP 0.579 (2.842)*** (+) LogTRADE 0.079 (5.891)*** (+) LogPR -2.058 (-2.302)** (-) LogDIST -0.829 (-6.139)*** (-) LogPOP 0.619 (11.890)*** (+) C 0.949 (0.819) SIGMA 0.381 (19.799)*** Observations 196 Log likelihood -89.2710
T-statistics (heteroskedasticity corrected) are in round brackets. ***/** - statistically significant, at the 1% and 5% levels, respectively.
Dynamic panel data
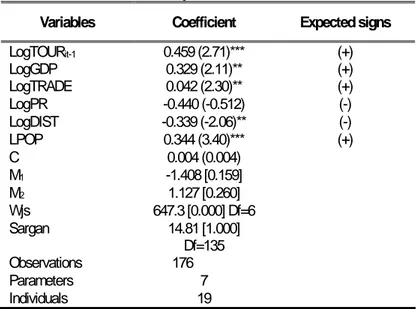
The dynamic panel data model, presented in Table 3, is valid if the estimator is consistent and the instruments are valid. The equations present consistent estimates, with no serial correlation (m1, m2 statistics). The Specification Sargan test shows that there is no problem with the validity of the instruments used.
Table 3 The impact of trade on Portuguese tourism demand:
GMM-system estimator
Variables Coefficient Expected signs LogTOURit-1 0.459 (2.71)*** (+) LogGDP 0.329 (2.11)** (+) LogTRADE 0.042 (2.30)** (+) LogPR -0.440 (-0.512) (-) LogDIST -0.339 (-2.06)** (-) LPOP 0.344 (3.40)*** (+) C 0.004 (0.004) M1 -1.408 [0.159] M2 1.127 [0.260] Wjs 647.3 [0.000] Df=6 Sargan 14.81 [1.000] Df=135 Observations 176 Parameters 7 Individuals 19
The null hypothesis that each coefficient is equal to zero is tested using a second-step robust standard error. T-statistics (heteroskedasticity corrected) are in round brackets. ***/**/* - statistically significant, at the 1%, 5%, and 10% level, respectively. P-values are in square brackets. Year dummies are included in all specifications (this is equivalent to transforming the variables into deviations from time means, i.e., the mean across the fourteen countries for each period). M1 and M2 are tests for first-order and second-order serial correlation in the first-differenced residuals, asymptotically distributed as N(0,1) under the null hypothesis of no serial correlation (based on the efficient two-step GMM estimator). WJS is the Wald statistic of joint significance of independent variables (for first steps, excluding time dummies and the constant term). Sargan is a test of the over-identifying restrictions, asymptotically
distributed as χ2 under the null of the instruments’ validity (with the two-step estimator).
The instruments in used are: LogTOURit (3,7), LogGDP (3,7), and
LogTRADE (3,7) for first differences. For the levels equations, the instruments used are the first differences of all variables lagged t-2. The equations present
five significant variables: (TOURt.-1, TRADE, PR, DIST (or BORDER), POP).
Other results relating to Portuguese tourism demand include:
i) Lagged dependent variable (TOURt-1): a positive sign was expected,
and the results confirm this. So we can infer that the proxy has a positive impact on the Portuguese economy;
ii) The variable GDP is statistically significant with an expected positive sign;
iii) Bilateral trade (TRADE): the expected sign is positive, which is confirmed by the dynamic panel data;
iv) Geographical distance (DIST): the dominant paradigm predicts a negative sign. The result confirms the dominant paradigm;
v) BORDER: we expected a positive sign, and the result confirms this; vi) Population: Our results confirmed that the proxy tends to be highly
correlated with income per capita (GDP). According to the literature
(see for example Witt and Witt, 1995), this result expresses population changes and indicates a high immigration flow.
Conclusions
The objective of this study was to analyse some of the determinants of Portuguese tourism demand. Comparing our findings with other studies, we obtained similar results. Econometric estimations support the hypothesis formulated. Our results are robust with static and dynamic panel data.
The paper argues and puts forth results supporting that bilateral trade has a positive effect on the share of tourism demand. For this, we use a gravity model. Tourism is of a dynamic nature. In order to understand this phenomenon, in this paper we build a dynamic econometric model. The dynamic results confirm this hypothesis. The lagged tourism demand presents an expected positive sign.
Other explanatory variables such as geographical distance and relative price are statistically significant. These results prove the dynamic nature of tourism demand and suggest that a dynamic approach is needed in order to better understand the demand for tourism determinants. In the static model, we find empirical evidence for the effect of economic variables on Portuguese tourism demand.
The high growth rate in the number of international arrivals in recent years indicates the opportunities that Portugal has to develop as a tourist destination. This study has some limitations. In the future, we need to include for other variables such as language, culture, and immigration.
References
Arellano, M., Bover, O. “Another Look at the Instrumental Variable Estimation of Error- Components Models”, Journal of Econometrics, 68(1), 1995, pp. 29-51
Blundell, R., Bond, S. “Initial conditions and moment restrictions in dynamic panel data models”, Journal of Econometrics Review, 87(1), 1998, pp. 115-143
Blundell, R. Bond, S. “GMM estimation with persistent panel data: An application to production functions”, Econometrics Review, 19 (3), 2000, pp. 321-340
Carey, K. “Estimation of Caribbean Tourism Demand: Issuers and Methodology”, Atlantic Economic Journal, 19, (3), 1991, pp. 32-40
Crouch, G. “The Study of International Tourism Demand: A Review of Findings”, Journal of Travel Research, 33 (1), 1994, pp. 12-23
Daniel, A, Ramos, F. “Modelling Inbound International Tourism Demand Portugal”, International Journal of Tourism Research, 4, 2002, pp. 193-2009
Dwyer, L, Burnley, I, Murphyand, P. Forsyth, P. “Tourism – Immigration Interrelations”, Report Prepared for Bureau of Immigration Research, 1992
Eilat, Y., Einav, L. “The Determinants of International Tourism: A Three - Dimension Panel Data Analysis”, Applied Economics, 36, 2004, pp. 1315-1327
Fuji, E. Mark, J. “Forecasting Tourism Demand: Some Methodological Issues”, The Annals of Regional Science, 15(2), 1981, pp. 72-82
Gray, H. P. “The Demand for International Travel by United States and Canada”, International Economic Review, 7, 1982, pp. 83-92
Kulendran, N, Wilson, K. “Is there a relationship between international trade and international travel”, Applied Economics, 32, 2000, pp. 1001-1009
Jud, G., Joseph, H. “International Demand for Latin American Tourism”, Growth and Change, 5(1): 1974, pp. 25-31
Lim, C. “Review of International Tourism Demand Models”, Annals of Tourism Research, 24 (4), 1977, pp. 835-849
Mervar, A. Payne, J. “An Analysis of Foreign Tourism Demand for Croatian Destination: Long-run Elasticity Estimates”, Working Paper, 2007, pp. 1-20
Naude, A, Saayman, A. “The Determinants of Tourists Arrivals in Africa: A Panel Data Regression Analysis”, Tourism Economics, 11 (3), 2005, pp. 365-391
Oigenblick, L and Kirschenbaum, A. “Tourism and Immigration Comparing Alternative Approaches”, Annals of Tourism Research, 29 (4), 2002, pp. 1086-1100
Payne, J. Mervan, A. “A Note and Modelling Tourism Revenue in Croatia”, Tourism Economics, 8 (1), 2002, pp.103-109
Phakdisoth, L., Kim, D. “The Determinants of Inbound Tourism in Laos”, ASEAN Economic Bulletin, 24 (2), 2007, pp. 225- 237
Shareef, R , McAleer, M. “Modelling International Tourism Demand and Volatility in Small Island Tourism Economies”, International Journal of Tourism Research 7, 2005, pp. 313-333
Tobin, J. “Liquidity Preference as Behaviour Towards Risk”, Review of Economic Studies, 25 (1). 1956, pp. 65-86
Witt, S. Witt, C. “Forecasting Tourism Demand: A Review of Empirical Research”, International Journal of Forecasting, 11, (3), 1995, pp. 447-475
Vanegas Sr, M. “Tourism Demand Response by Residents of Latin American Countries”, International Journal of Tourism Research, 11, 2009, pp. 17-29
Vogt, M. “Determinants of the demand for US exports and imports tourism”, Applied Economics, 40 (6), 2008, pp. 667-672
Romania and its content may not be copied or emailed to multiple sites or posted to a listserv without the copyright holder's express written permission. However, users may print, download, or email articles for individual use.