U
NIVERSIDADE DE
L
ISBOA
Faculdade de Ciências
Departamento de Biologia Animal
U
NDERSTANDING EMERGENCE AND CELL CYCLE DYNAMICS
OF NON
-
APICAL PROGENITORS IN THE
Z
EBRAFISH RETINA
Ana Patrícia Parracho Filipe Ramos
MESTRADO EM BIOLOGIA EVOLUTIVA E DO DESENVOLVIMENTO
2012
U
NIVERSIDADE DE
L
ISBOA
Faculdade de Ciências
Departamento de Biologia Animal
U
NDERSTANDING EMERGENCE AND CELL CYCLE DYNAMICS OF
NON
-
APICAL PROGENITORS IN THE ZEBRAFISH RETINA
Ana Patrícia Parracho Filipe Ramos
Dissertação para obtenção do Grau de Mestre emBiologia Evolutiva e do Desenvolvimento
Orientador interno: Profª Drª Sólveig Thorsteindóttir
Faculdade de Ciências da Universidade de Lisboa/ Departamento de Biologia Animal, Lisboa, Portugal
Orientador externo: Drª Caren Norden
Max Planck Institute of Molecular Cell Biology and Genetics, Dresden, Alemanha
Resumo
A retina, como parte do sistema nervoso central, é formada a partir do tubo neural. O neuroepitélio que dá origem à retina, apresenta muitas similaridades com o neuroepitélio que origina o cérebro. Desta forma, o estudo da neurogenese na retina tem permitido a compreensão dos processos envolvidos durante o desenvolvimento do restante sistema nervoso central. O neuroepitélio é constituído por apenas uma camada de células neuroepiteliais. Estas estão ligadas à superfície apical e, no extremo oposto, à superfície basal. Por sua vez, o núcleo destas células, migra ao longo de todo o eixo apical-basal, de uma forma que está dependente do ciclo celular. A esta migração nuclear deu-se o nome de migração inter nuclear (Interkinetic nuclear migration ou IKNM). O facto de os núcleos migrarem dentro das células e adquirirem diferentes posições ao longo do tempo, faz com que o neuroepitélio adquira uma estrutura pseudoestratificada. A característica mais particular da IKNM é o facto de as células dividirem-se apenas quando o núcleo se encontra junto da superfície apical. Para tal, este migra activamente em direcção à superfície apical durante a fase G2 do ciclo celular.
A retina é composta por cinco tipos de neurónios, três dos quais são excitatórios - foto-receptores, células bipolares e células ganglionares – e dois tipos de interneurónios – células amácrinas e células horizontais. Estes neurónios estão distribuídos por três camadas nucleares distintas. Os foto-receptores constituem a camada mais externa (outer nuclear layer ou ONL) , junto à superfície apical; enquanto que células horizontais, bipolar e amácrinas distribuem-se pela camada interna (inner nuclear layer ou INL). Células ganglionares compõem a camada ganglionar (ganglion cell layer ou GCL), a camada mais basal da retina. Todas os neurónios na retina provêm do mesmo grupo de células neuroepiteliais. Estas células estão sujeitas a IKNM e por isso dividem-se exclusivamente na superficie apical. Até há pouco tempo pensava-se que todos os neurónios eram formados na superfície apical após a divisão de uma célula neuroepithelial. Esta divisão seria procedida pela migração da célula pós-mitótica para a camada final onde se iria diferenciar. No entanto, foi descoberto que em peixe-zebra (Danio rerio) a camada de células horizontais é totalmente formada a partir da divisão de progenitors em posições não apicais, no local onde a futura camada destas células se vai formar. Para além das células horizontais, trabalhos recentes no nosso laboratório conduziram à descoberta de que a camada de células bipolares também é formada parcialmente pela divisão de progenitores não apicais. Tanto os progenitores que dão origem às células horizontais como aqueles que originam as células bipolares são unipotentes e expressam marcadores específicos da linhagem que vão originar. Progenitores não apicais das células horizontais expressam o factor de transcrição Ptf1a e o marcador celular Cx55.5; progenitores não apicais das células bipolares expressam o factor de transcrição Vsx1.
A retina do peixe-zebra desenvolve-se num curto espaço de tempo e às 72 horas após a fertilização (hpf) a neurogenese está praticamente completa. Por isso mesmo, os progenitores têm de proliferar e formar neurónios rapidamente. Além disso, a diferenciação dos diferentes tipos de neurónios ocorre em períodos de tempo que se sobrepõem, isto leva a que numa determinada janela temporal, várias camadas de células estejam a ser formadas ao mesmo tempo. A junção destes factores pode levar ao aparecimento de constrangimentos dentro do tecido podendo influenciar a proliferação celular, neurogeneses e migração. Foi com base nestes pressupostos que neste trabalho quisemos perceber se as características do tecido poderiam ter influência no aparecimento dos progenitores não apicais.
Os resultados previamente obtidos no laboratório apontavam para o facto de que os primeiros progenitores não apicais das células bipolares, surgirem ao mesmo tempo que o desenvolvimento da camada de células foto-receptoras Esta camada de células localiza-se justaposta à superfície apical, o que poderá limitar o seu acesso por parte dos progenitores. Tentou-se então perceber se o desenvolvimento da camada de células foto-receptoras poderia estar na base do surgimento dos progenitores de células bipolares não apicais. Para tal pretendeu-se eliminar a camada de células foto-receptoras e verificar se o numero deste tipo de progenitores poderia ser alterado.
Para além de limitações no acesso à superfície apical, outros factores dentro do tecido podem influenciar o surgimento de progenitores não apicais. Aquando da ablação genética de determinados tipos de células, a retina mantém a sua estrutura e compensa as células perdidas produzindo um maior número de células de outro tipo. Por exemplo, quando as células ganglionares são eliminadas, estas são substituídas por células que expressam Ptf1a, um factor de transcrição essencial para a diferenciação dos progenitores em células horizontais e amacrinas. Por outro lado, quando células horizontais e amácrinas são eliminadas, a INL é totalmente ocupada por células bipolares que são produzidas em maior número. Com este projecto tentou-se perceber onde é que este número supérfluo de células era originado (se na superfície apical ou noutro local da retina). Para tal, as células ganglionares e interneurónios foram eliminadas recorrendo a dois morfolinos que inibem a expressão dos factores de transcrição essenciais para a produção destes dois tipos celulares: Ath5 (essencial para o desenvolvimento de células ganglionares) e Ptf1a (essencial para o desenvolvimento de interneurónios). Para percebermos onde é que as células se dividiam, as retinas dos embriões onde estes neurónios foram eliminados, foram marcadas com um anticorpo especifico para células que estão na fase mitótica e analisados em diversos estadios do desenvolvimento.
A análise dos embriões trouxe resultados surpreendentes. Aquando da eliminação das células ganglionares, vários conjuntos de células foram observados a dividirem-se perto da superfície II
basal. Algumas destas divisões ocorrem após o estabelecimento da GCL, isto é, após a grande parte dos neurónios desta camada já estarar diferenciada e com sinapses estabelecidas. Divisões celulares em posições tão basais nunca foram descritas antes. Na análise dos embriões onde os interneurónios foram eliminados, observou-se que a frequência de progenitores não apicais que expressam Vsx1 diminuiu. Este facto é bastante intrigante uma vez que são as células positivas para Vsx1 que originam a maior parte das células bipolares. No entanto observou-se também que existe um aumento no número de progenitores não apicais que não expressam Vsx1.
Estes resultados para além de intrigantes deixam muitas questões em aberto. No caso em que as células ganglionares são eliminadas, ficamos por descobrir porque é que estas células se dividem tão basalmente. Específicamente será importante perceber se se tratam de células diferenciadas ou de progenitores indiferenciados. Depois será também preciso clarificar o porquê destas células se dividirem nesta região. Tendo em conta que a GCL está a ser preenchida por um tipo de células que normalmente não a compõem é indicativo que a ausência desta camada tem influência no comportamento das células. Na situação em que as células horizontais e amácrinas foram eliminadas também será importante saber o que vão originar os progenitores não apicais observados, que não expressam Vsx1.
Os resultados aqui apresentados apontam para a existência de factores externos, nomeadamente factores ligados à estrutura celular do tecido que influenciam o aparecimento de progenitores não apicais.
Uma futura exploração mais detalhada destas observações irá tornar possível o esclarecimento de como é que a estrutura e morfologia de um tecido poderão influenciar a proliferação celular.
Palavras-chave: Neuro-desenvolvimento; retina; progenitores basais; IKNM
Summary
Until recently it was thought that all the neurons in the retina were formed by the division of multipotent progenitors at the apical surface, followed by migration of the post-mitotic cell to the prospective neuronal layer. However, it was recently shown that, in the zebrafish (Danio rerio) retina the layer of horizontal cells (HCs) is formed solely by committed precursors that divide in non-apical positions. This finding was further expanded to the formation of the bipolar cell (BC) layer, by the discovery that BCs precursors can also divide at non-apical positions. Both pools of non-apical precursors are unipotent and express markers of the cell lineage that they will give rise to: Ptf1a and Cx55.5 in the case of HC precursors; Vsx1 in the case of BCs precursors.
The rapid proliferation and neurogenesis upon the development of the zebrafish retina might lead to the emergence of tissue constraints, specifically space constraints. In this work we set out to understand the occurrence of non-apical progenitors in the retina taking tissue architecture into account. Upon elimination of the most basal layer in the retina (the ganglion cell layer) we found that subset of cell can divide in regions close to the basal lamina. Divisions at such basal positions were never described. Furthermore we found that, upon ablation of the interneurons, a pool of non-apical cells, negative for the expression of Vsx1 emerges.
The results shown in these works point towards the existence of external factors, like the cellular structure of the tissue, that play a role in the emergence of non-apical progenitors.
A further exploration of these observations will allow understanding how the structure and morphology of the tissue can influence cellular proliferation.
Key words: neurodevelopment, retina, basal progenitors, IKNM
Acknowledgments
To Caren. Thank you for accepting me in your lab and for the opportunity to learn from you; for always be there whenever I needed and for care so much about me; Thank you for all your enthusiasm when I couldn’t see anything good coming out of my experiments! Doing this thesis at your lab, at this institute was a great opportunity and pleasure. I’ve learn a lot during this year and I couldn’t be more grateful for that.
To Prof. Solveig. Thank you for all this years that I had you as my teacher. It was a pleasure to learn from you! Thank you for all the support and comprehension during these crazy years of the masters; for your patience and for always reply to my requests made with short notice! To Isabell. Because you were my “mommy” for this entire year at the lab, thank you! Thank you for all that you taught me; for your patience whenever I couldn’t do the things right. Thank you for always be willing to help me with the experiments. This thesis wouldn’t be possible without you. I also thank you for all your friendship and companionship.
Special thanks to Sylvia for your (precious) help with the cloning and for Betty who have the trouble in making the graphs for this thesis.
For the entire Norden lab (current and past members): Betty, Caren, Franz, Isabell, Kate, Paulina, Sylvia, (and most recently Jaroslav). Thank you for receiving me so well and for always be willing to share your know-how with me. It was great to work with you.
Too the many people that I met during this year, either inside or outside this Institute and that made the -20ºC to feel not so cold. To the many new friends that I made here, you’ll always have a special place.
To the Portuguese Mafia! André Z., João F., Júlio S., Marta L., Miguel C., Tiago F.. Thanks for “adopt me” since my first days at Dresden. Thanks for all the soccer matches, volleyball, friday nights in Neustadt (I’m filling now obligated to mention the words Hebeda’s and Long Island Ice Tea….!), distractive afternoon coffees and… taka-taka!! Most of all, thanks for all the support and friendship. A special thanks to Marta and João who bothered to review this thesis. A decent reward will come in short time :p
To my dear friends, Bia, Rute, Ana, Zé, Vitinho, Mix, Miguel. Thank you for always be there for me, even at 3000 km away. It was a hard year without our night coffees. To Pedro, for teaching me so much.
To my BED fellows. It was great to share these two intense years with you. I’m proud of us . To Cátia F. and João E., companions since the early beginnings of our “scientific life”.
Finally to my family. Obrigada pelo apoio incondicional e por sempre acreditarem em mim. Para a minha avó que tanto orgulho tinha na sua neta.
In the study of this membrane I for the first time felt my faith in Darwinism weakened, being amazed and confounded by the supreme constructive ingenuity revealed not only in the retina […] of the vertebrates but even in the meanest insect eye.
Santiago Ramón y Cajal
Recollections of My Life (1898), 576.
Table of Contents
Resumo ... I Summary ... V Acknowledgments ... VII Table of Contents ... XI List of Acronyms ... XIII
I. Introduction ... 1
I.1 - Neuroepithelium as the basis for the development of the vertebrate central nervous system ... 2
I.1.A - The neuroepithelium and its characteristics - polarization and pseudostratification ... 2
I.1.B - Neurogenesis in the CNS – apical and basal progenitors ... 4
I.2 - The vertebrate retina as a model to study neuroepithelium development ... 5
I.2.A - Organization of the vertebrate retina ... 5
I.2.B - Vertebrate retinal histogenesis ... 7
I.2.C - Neurogenesis in the zebrafish retina ... 8
Lineage specification in zebrafish ... 9
I.3 - The phenomenon of non-apical divisions in the zebrafish retina ... 11
I.4 - Aims of the project ... 15
I.4.A - Understanding the emergence of non-apical progenitors ... 15
I.4.B - Understanding cell cycle kinetics of non-apical progenitors ... 16
II. Material and Methods ... 17
II.1 - Animals ... 17
II.2 - Transgenic lines ... 17
II.3 - Generation of transgenic lines... 17
II.3.A - Construction of the pMiniTol2- sCMV::PCNA-GFP plasmid ... 18
Gene amplification ... 18
Ligation and transformation ... 18
Plasmid extraction... 18
II.3.B - Construction of the pMiniTol2- b-actin::PCNA-GFP plasmid ... 19
Gene amplification and purification ... 19
II.4 - PCNA-GFP mRNA Microinjections ... 20
II.5 - Morpholino Injections ... 20
II.6 - Immunocytochemistry ... 21
II.7 - Imaging ... 21
II.8 - Quantification of mitotic cells ... 22
III. Results and Discussion ... 23
III.1 - Investigating the emergence of non-apical progenitors ... 23
III.1.A - Emergence of non-apical divisions of bipolar cells ... 23
III.1.B - Basal divisions can be induced upon elimination of the RGC layer ... 26
III.1.C - Non-apical progenitors are induced upon elimination of retinal interneurons ... 31
III.2 - Assessing cell cycle kinetics in non-apical progenitors ... 40
... 43
IV. Conclusions and future perspectives ... 45
V. References ... 47
VI. Appendix ... 52
VI.1 - Solutions used ... 52
List of Acronyms
ACs – Amacrine Cells Aps – Apical Progenitors BCs – Bipolar Cells
bHLH - basic helix-loop-helix BPs – Basal Progenitors
CNS – Central Nervous System Crx – cone-rod homeobox ECM – Extracellular Matrix HCs – Horizontal Cells
hpf – Hours Post Fertilization
IKNM – Interkinetic Nuclear Migration INL – Inner Nuclear Layer
IPL – Inner Plexiform Layer KD – Knock-Down
MO – Morpholino
Nrf mutant – not really finished mutant Nrf gene – nuclear respiratory factor ONL – Outer Nuclear Layer
OPL - Outer Plexiform Layer PRs – Photoreceptor Cells
Ptf1a - pancreas transcription factor 1a
RGCs – Retinal Ganglion Cells RPCs – Retinal Progenitor Cells TF – Transcription Factor WT – wild-type
I. Introduction
The ontogeny of the vertebrate central nervous system (CNS) is an extensively studied topic in Developmental Biology. While the arrays of events that will culminate in the formation of the CNS occur in a tightly coordinated manner, both in space and time and the similarities between different organisms are known, the single steps that lead to such complexity are poorly understood. To get to such an understanding we need to elucidate the mechanisms of differentiation, morphogenesis and migration involved in CNS formation.
The main structures of the CNS – brain, spinal cord and retina – exhibit a striking tissue stratification and polarization. They are composed of several layers made of neurons with similar structure and function. This peculiar distribution of the neuronal cell bodies correlates with the pattern of neuronal connections and thus with the flow of information, highlighting the importance of this laminar organization. Understanding how the different layers are formed is crucial to understand not only the development of the CNS but also its function. Advances in this field have been facilitated by studies in the vertebrate retina, which can, to some extent, be extrapolated to brain development. Therefore, the study of retina formation is important to understand the general mechanisms involved in the development of the CNS.
The aim of this thesis was to uncover processes related to layer formation in the zebrafish (Danio rerio) retina. Specifically, I will be focusing on a new pool of progenitor cells that arise at later stages of retina neurogenesis, the non-apical progenitors.
INTRODUCTION
I.1 - Neuroepithelium as the basis for the development of the vertebrate central nervous system
All structures of the CNS derive from the neural tube which is comprised of a germinal neuroepithelium. Each of the neuroepithelial cells that constitute it, has the capacity to differentiate into any of the CNS cell types.
I.1.A - The neuroepithelium and its characteristics - polarization and pseudostratification
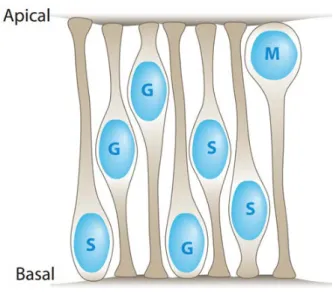
The neuroepithelium consists of a single cell layer in which cells are attached to the apical (luminal/ventricular) and basal (pial) surfaces by thin cytoplasmatic processes. A hallmark of this tissue is the migration of the nuclei along the apical-basal axis of the cells. The acquisition of different positions throughout time gives to the tissue a pseudostratified appearance. This phenomenon of intracellular nuclear movement is called Interkinetic Nuclear Migration (IKNM). It was first described in the chick neuroepithelium by Sauer in 1935 while studying “ the otherwise puzzling fact that
mitotic figures are confined to the region bordering the lumen”1. Through histological
analysis of the neural tube, Sauer proposed that the nuclei move within their cells in a cell cycle dependent manner: DNA synthesis (S-phase) occurs while the nucleus is near the basal surface and, as the cell proceeds through the cell cycle, it will migrate to the apical surface to undergo mitosis. Further studies extended this hypothesis to the neuroepithelium of other vertebrates and also to the retinal neuroepithelium2,3. The
development of techniques for in vivo imaging as well as cell cycle indicators for living cells confirmed that nuclear migration to the apical surface occurs exclusively during G2-phase, while translocation to the basal surface occurs during G1 and S-phase4–8 [Fig.
I-1]. Therefore cell cycle and IKNM are tightly linked9. However, why neuroepithelial
cells undergo IKNM and how this process changes upon neurogenesis are still much debated questions.
INTRODUCTION
Like other epithelia, the neuroepithelium is a highly polarized tissue, where the apical and basal surfaces show distinct compositions. The links between IKNM and apical-basal polarity are still being discussed. One of the reasons pointed for nuclei migration before mitosis, has to do with the position of the centrosome, which is localized always at the apical surface9,10. In addition, one interesting question is how IKNM and tissue polarity
correlate with cell proliferation and cell fate decisions. A recent study suggests that IKNM functions to balance the exposure of progenitors to neurogenic vs proliferative signals, specifically to Notch signalling which controls the balance between self-renewal and neurogenic transition. Specifically, IKNM might regulate the duration and level of exposure of neuroepithelial cells to Notch signalling, influencing the time at which precursors exit the cell cycle and differentiate11.
IKNM and tissue/cell polarity are common features not only of the neuroepithelium but also of other pseudostratified epithelia along the animal kingdom. This fact suggests that IKNM is an evolutionary conserved process in tissues with high proliferative turnover, highlighting its importance for tissue expansion and differentiation. Understanding how IKNM and tissue polarity influence cell proliferation and cell fate determination is crucial to understand the earliest steps of CNS development.
Fig. I-1 - Schematic representation of IKNM in the neuroepithelium – neuroepithelial cells nuclei migrate within the tissue in a cell cycle dependent manner. Mitosis always occurs always at the apical surface, whereas G1, S and G2 phases occur at more basal positions. From Norden and Lee 2012,
unpublished
INTRODUCTION
I.1.B - Neurogenesis in the CNS – apical and basal progenitors
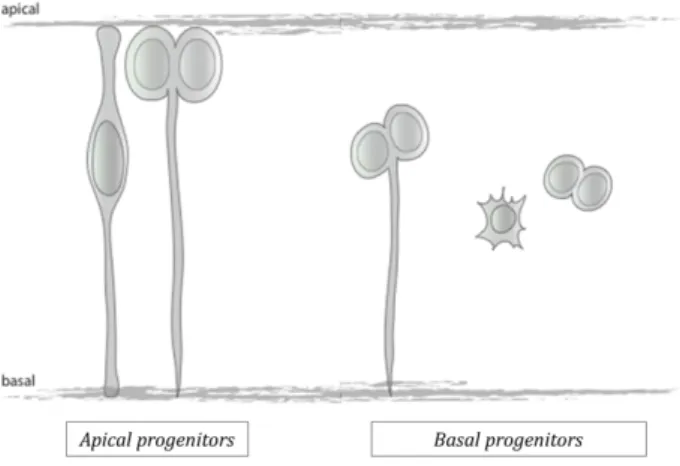
The expansion of the neuroepithelium occurs by symmetric divisions of neuroepithelial cells exclusively at the apical surface. Therefore neuroepithelial cells are referred to as apical progenitors (APs). The features characterizing APs include: a) cell divisions always occurs at the apical surface and features a horizontal division plane b) the apical process is maintained during mitosis c) the cell displays apical-basal polarity and d) cells are multipotent and can undergo either symmetric proliferative divisions (giving rise to two self-renewal daughters) or asymmetric divisions (giving rise to one self-renewal daughter and one neural progenitor cell)12.
In addition, a further type of neural progenitors was identified in the mammalian neocortex13,14. These progenitors are referred to as basal progenitors (BPs) due to the
fact that, unlike APs, they don’t divide at the apical surface but at more basal position of the epithelium. In addition, BPs differ from APs by the fact that: a) they do not undergo IKNM, b) the apical process is retracted, c) apical polarization is lost, d) they feature random division planes and e) they have a restricted cell fate and undergo symmetric divisions. In the neocortex, these progenitors appear at the onset of neurogenesis and originate from APs whose nuclei migrate basally after mitosis and from cells that retract their apical cytoplasmatic process. BPs contribute to neurogenesis by generating two neuronal daughter cells [Fig. I-2].
Fig. I-2 – Apical vs basal progenitors – apical progenitors always divide with a perpendicular division plane at the apical surface; whereas basal progenitors, which lose the apical process, and sometimes also the basal process, divide with random division planes at more basal positions. I.Weber
INTRODUCTION
The evolutionary origin of BPs is still under debate. However, several studies suggest that BPs might function to increase the number of neurons that are generated and may have contributed towards the expansion of the cerebral cortex in primates during evolution14–17.
Research on CNS development is mainly based on the analysis of organotypic cultures of the mammalian brain. However, with this method, several extracellular factors that play a role during development might not be totally considered. In addition, the brain is a vital organ for embryo development, which makes it unfeasible to resort to certain loss of function studies to uncover gene function. Therefore, it is important to establish different strategies. The use of other CNS structures, like the retina, has proven to be a reliable method to uncover mechanisms involved in CNS formation, presenting many advantages in comparison to other brain structures18
I.2 - The vertebrate retina as a model to study neuroepithelium development
The vertebrate retina is formed as an outpocketing of the neural tube. Thus, the retinal neuroepithelium shares many of its features: a) retinal neuroepithelial cells undergo IKNM b) the apical-basal polarity and its determinants are present. In addition, the retinal neuroepithelium will also develop from a single cell layer tissue to a multistratified organ. However, the retina is composed of only five main types of neurons, which are distributed into three discrete layers. This simple organization makes of the retina an ideal model to study the patterns of layer formation and neuronal circuits’ establishment.
I.2.A - Organization of the vertebrate retina
The five types of neurons that develop in the retina perform different functions. Visual information is collected and transmitted to the brain via a chain composed of three excitatory neurons – photoreceptors (PRs), bipolar cells (BCs) and retinal ganglion cells (RGCs). Two types of inhibitory neurons connect these to modulate the information – amacrine cells (ACs) and horizontal cells (HCs). While PRs are the responsible for the transduction of the light stimulus into electrical stimulus, RGCs are the cells that, through the optic nerve, transmit the information to the brain.
INTRODUCTION
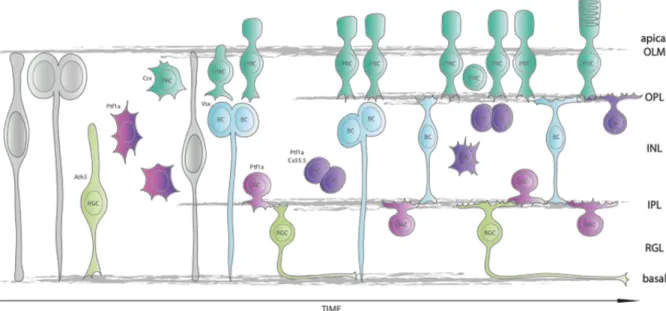
The cell bodies of each type of neurons are organized in three neuronal (or nuclear) layers. The neurons will then connect to each other and establish the synapses in the plexiform layers. The distribution of the different retinal neurons reflects their function. The PRs are located in the most apically and form the so-called outer nuclear layer (ONL). PRs connect to BCs and HCs dendrites located at the inner nuclear layer (INL). BCs will then connect to ACs, located in the INL and RGCs, which form the ganglion cell layer (GCL). Muller glial cells span the whole retina. The synapses established between the different neurons create the outer and the inner plexiform layers (OPL and IPL) [Fig. I-3]
Fig. I-3 - Organization of the vertebrate retina – A) The retina is the neuronal portion of the eye. It is
organized into discrete layers at the back of the eye; B) photoreceptors (PR) localize adjacent to the retinal pigment epithelium (RPE) and form the outer nuclear layer (ONL). At the outer limiting membrane (OLM) PRs form specialized extensions responsible for light transduction, the outer segments (OS). PRs connect to the bipolar cells (BC) that localize at the inner nuclear layer (INL). BCs transmit the signal from the PRs to the retinal ganglion cells (RGC) localized at the ganglion cell layer (GCL). The signal from PRs to BCs is modulated by horizontal cells (HC) at the outer plexiform layer (OPL). Amacrine cells (AC) and displaced amacrine cells (dACs) modulate the signalling between BCs and RGCs at the inner plexiform layer (IPL).
Adapted from Poché and Reese 2009; Randlett et al, 2011
INTRODUCTION
I.2.B - Vertebrate retinal histogenesis
Early in development, the retinal neuroepithelium is expanded by symmetric proliferative divisions of APs. Because these precursors are responsible for the formation of the retina, they are referred to as retinal progenitor cells (RPCs). Progressively, some RPCs start to divide asymmetrically, originating one RPC and a post-mitotic neuron. Only later in development do RPCs undergo symmetric, neurogenic divisions, giving rise to two post-mitotic neuronal precursors19. RPCs can undergo a
variable number of divisions and are capable of giving rise to all the cell types in the retina, with no commitment to a specific lineage20. Recent studies in zebrafish and rat
propose that a combination between stochastic and deterministic events, influence the decision of RPCs between proliferation and following a neurogenic fate19,21.
The order for retinal neurons formation is similar between several vertebrates (chick, monkey and mouse). The first cells to exit the cell cycle will give rise to the RGCs. They are followed by the first cone-PRs, HCs and ACs. The last neurons to be generated are BCs and rod-PRs 22. However, the generation times of each of these cell types are not
clearly distinguishable from each other and overlapping periods are frequent [Fig. I-4]. Furthermore, retinal neurogenesis progresses in a wave-like manner: starting from the central retina, a wave of differentiation progresses towards the periphery. This means that retinal development is not uniform and that, at a given time point, different parts of the retina show different stages of cell differentiation.
Fig. I-4 – Birth order in the vertebrate retina – RGCs are first cells to be formed, followed by HCs cone pRs and ACs. Rod PRs, BCs and Muller glia are the last neurons to be formed. Adapted from Basset, 2012
INTRODUCTION
Lineage tracing studies in retinal neurogenesis are based on the analysis of fixed samples. However, in order to fully understand retinal histogenesis, it is important to be able to follow the cells in vivo in order to be able to show a) what happens to the progenitors before, during and after cell divisions b) at which time points and at what location do progenitors effectively divide. For this purpose, the study of the zebrafish retina has revealed major advantages compared to the study of the retina in other vertebrates. Particularly, the fact that the embryo has an external development and is transparent, allows for in vivo imaging of the retina in its native environment. The small size and rapid development enables to image the whole process of eye development, from early stages until the full establishment of the eye. In addition, several transgenic lines expressing reporter proteins under control of specific promoters are already established, allowing a clear distinction between cell types.
I.2.C - Neurogenesis in the zebrafish retina
Retinal neurogenesis in the zebrafish starts around 30hpf (hours post fertilization). The wave of differentiation observed in vertebrates differs slightly in the zebrafish: instead of starting in the central retina, differentiation progresses from a nasal patch at the ventral side of the retina and progresses towards the dorsal side and periphery [Fig. I-5 (B) ]19,23. Retinogenesis is completed around 72hpf24 and few cells divide after this
developmental time-point. The exception is the marginal zone where proliferation and neurogenesis continue throughout the lifetime of the organism [Fig. I-5 (A)] 25.
INTRODUCTION
Each RPC is capable of giving rise to all the different types of retinal neurons. Several transcription factors (TFs) that participate in cell fate decision were already identified. Most of them are members of the basic helix-loop-helix (bHLH) or homeodomain TFs families.
Lineage specification in zebrafish
At 24hpf, the expression of TFs involved in cell fate determination is observed. At this developmental stage the homeodomain containing repressor Vsx2 is expressed in all RPCs26. Later in development, Vsx2 expression becomes restricted to a small subset of
BCs. The remaining BCs express Vsx1, another homeobox gene27.
At the ventral-nasal patch, some RPCs stop expressing Vsx2 and start to express Ath5 (Atonal 5/Atonal 7), a bHLH TF28. These cells then divide asymmetrically giving rise to
one RGC and one RPC29. Ath5 is required for progenitors to acquire competence to
differentiate into RGCs. In fact, mutations in the zebrafish lakritz (lak) locus, which encodes Ath5, lead to a complete loss of RGCs28.
Another TF whose transcription starts early in retinal development is Crx (cone-rod), also a member of homeobox genes30. In mammalians, this TF is found specifically in
post-mitotic PRs and is essential for their maintenance31. In zebrafish, though, its
Fig. I-5 - The zebrafish retina – A) Representation of the zebrafish retina showing the ciliary marginal
zone (CMZ) where neurogenesis continues throughout the lifetime of the organism; B) Scheme of the retina showing the progression of the proliferative and differentiation wave from the nasal-ventral patch towards the dorsal/temporal region. Adapted from He et al, 2012
INTRODUCTION
expression starts around 17-24hpf in all retinal progenitors and becomes restricted to PRs at later developmental time points.
The inhibitory cell lineage of the retina (HCs and ACs) is determined by the expression of Ptf1a (pancreas transcription factor 1a)32–34. Blocking of Ptf1a transcription leads to a
complete depletion of ACs and HCs and cells are re-specified to excitatory cell fates35. Ptf1a expression starts exclusively after an RPC divides for the last time at the apical
surface36. The cells in which Ptf1a is activated retract their basal and apical processes,
migrate basally and accumulate at the INL, in the prospective AC layer. They are able to give rise to ACs or HCs.
A model of the origin of the different cell lineages in the zebrafish retina can be found in Fig. I-6.
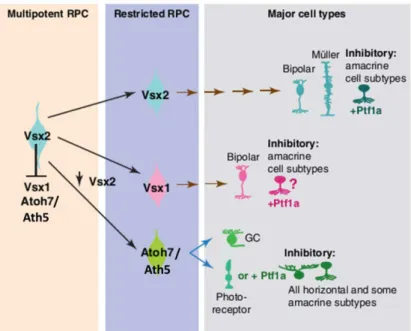
Fig. I-6 - Model of the origin of retinal lineages in zebrafish – Vsx2 expression allows RPC to maintain their multipotency probably through the repression of cell fate determinants like Vsx1 and Ath5. Vsx2+ progenitors give rise to distinct populations of Vsx1, Vsx2 and Ath5 positive cells. Vsx1 and Vsx2 give rise to distinct populations of BCs. Vsx2+ progenitors also originate Muller glia cells. Ath5 is expressed in RPCs that undergo asymmetric cell divisions, giving rise to a RGC and a RPC. This RPC will become a PR or an inhibitory neuron. Ptf1a expression in any of these progenitors leads cells to adopt an inhibitory cell fate.
Adapted from Basset, 2012
INTRODUCTION
In summary, the final decision of RPCs to generate one or another lineage is based on a balance between several factors.
The generally accepted view for retinal development is that committed post-mitotic precursors migrate short distances from the apical surface (where they were generated) directly to their appropriate laminar position. The migration is then followed by initiation of the differentiation program37. However recent studies in zebrafish and chick
showed that a pool of HC precursor cells has the potential to divide at non-apical positions, near the final laminar position 38,39
. This was the first time that non-apical progenitors, a phenomenon only described in the rodent and human neocortex, were identified in the retina.
I.3 - The phenomenon of non-apical divisions in the zebrafish retina
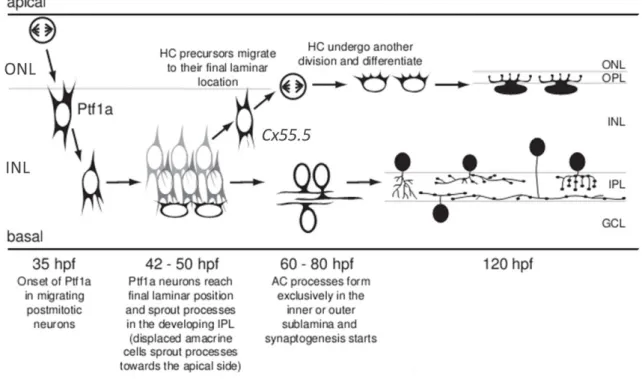
HC layer development reveals to be more complex than the development of other retinal neurons. As mentioned before, a pool of Ptf1a expressing cells accumulates at the inner part of the INL after the retraction of the apical and basal processes. A sub-population of these cells starts to express HC specific markers like Cx55.5 (connexin 55.5)40.
Interestingly, these cells migrate back until they reach the prospective HC layer, just below the OPL. In here, these HC precursors undergo another round of cell division. These precursors, who already lost their apical and basal processes, divide in a non-apical position, giving rise to, at least, 90% of the HC layer38. These findings led to a new
model for HC layer formation, summarized in Fig. I-7
INTRODUCTION
Recent work in our lab gave more insights on the process of HC layer formation by showing that Cx55.5 positive cells can divide not only near the OPL, but also at the inner part of the INL, close to the IPL (Isabel Weber, unpublished). This finding raises the possibility that HC precursors can divide more than once at non-apical positions.
Additionally, another class of cells dividing at non-apical positions was also identified. These cells also divide withinthe INL, but do not express HCs or ACs markers. By using a transgenic line expressing a reporter gene under control of the Vsx1 promoter, it was shown that these non-apically dividing cells are BCs precursor cells [Fig. I-8 (A)]. These cells also divide with a random division plane and lose their apical process upon mitosis, confirming that these precursors make part of another pool of non-apical progenitors. Fig. I-7 - Developmental progression of horizontal and amacrine cells – Starting at 35hpf, some retinal progenitors exit cell cycle at the apical surface, retract their apical and basal processes and migrate towards the inner nuclear layer (INL). During this migration, Ptf1a expression starts. Once settled, amacrine cells start to extend their processes in order to connect to ganglion cells at the developing inner plexiform layer (IPL). Some of these Ptf1a+ cells start to express horizontal cell markers, like Cx55.5 and migrate back until reaching their final layer. Here cx55.5+ cells undergo another round of cell division. Adapted from Jusuf et al., 2009
INTRODUCTION
The quantification of the number and position of Vsx1+ dividing cells shows that non-apical divisions surpass non-apical divisions around 56hpf [Fig. I-8 (B)]. By quantifying the total number of cells dividing at apical and non-apical positions, it was shown that at 60hpf non-apical progenitors contribute with more than 50% of the total number of dividing cells [Fig. I-8 (C)].
This data showed that non-apical divisions of precursor cells play a significant role during zebrafish retina development. Until now, birth order studies in the retina have considered only the formation of neurons through apical mitosis. However, the role of non-apical divisions sheds new light on the general birth order of retinal neurons. A new model for retinal neuron birth order is then proposed as described in Fig. I-9. It contrasts with the general view that all retinal neurons are born at the apical surface and states that BCs are born before HCs [Fig. I-4].
Fig. I-8 – Non-apical divisions are a common phenomenon during retinal development – A) Cells
expressing a reporter gene under control of the Vsx1 promoter and positive for the mitotic cell marker pH3, can be found at the INL (arrow head). This demonstrates that bipolar cell precursors also divide at non-apical positions; B) Quantification of the number of Vsx1+ cells dividing at non-apical or non-non-apical positions, relative to the total number of dividing cells, overtime. C) Total number of cells dividing apically or non-apically (in %). Between 56hpf and 60hpf non-apical divisions surpass the number of apical divisions. ONL – outer nuclear layer; INL – inner nuclear layer; GCL – ganglion cell layer. Isabel Weber
INTRODUCTION
Fig. I-9 - A new birth order for the development of retinal neurons in zebrafish – At 28hpf some RPCs, start to express Ath5, exit cell cycle and give rise to RGCs, which then migrate to the correct laminar position. A few hours later, Ptf1a+ cells start to migrate freely from the apical surface to the inner part of the developing INL, where they accumulate. The first differentiated cone-PRs, marked by expression of Crx, can be seen at 48hpf. At that time, the first non-apical Vsx1+ precursors appear. Between 50 and 60hpf, ACs and dACs start to sprout their processes to the developing IPL. The first Cx55.5+ cells emerge from the Ptf1a+ pool. The PR layer continues to differentiate and the ONL is clearly distinguishable in the most ventral parts of the retina. By this time, the number of non-apical VSX1+ precursors reaches a peak while post-mitotic BCs start to send their processes towards the IPL and OPL. Cx55.5+ cells start to migrate towards the apical side and, starting around 60hpf, divide near the OPL, giving rise to the HC layer. Later on, only Crx+ cells are seen dividing at the apical surface, giving rise to rod-PRs. Isabel Weber
INTRODUCTION
I.4 - Aims of the project
I.4.A - Understanding the emergence of non-apical progenitors
Tissue constraints might arise upon retinal development due to rapid cell proliferation and neurogenesis in a small tissue volume. In fact, non-apical divisions of Vsx1+cells coincide with the development of the PR cell layer, which constitutes the most apical layer. Since retinal development is not uniform, it is possible to directly observe that non-apical divisions mostly appear in regions where the PR layer is being established [Fig. I-10]. Therefore, migration of the committed precursor nuclei to the apical surface might be constrained due to the presence of this developing layer. It is possible then, that Vsx1+ non-apical progenitors arise as their nuclei cannot reach the apical surface where they would normally divide.
My aim was to understand whether the development of the PR layer is promoting the appearance of non-apical Vsx1+ progenitors by constraining their access to the apical surface. To test that hypothesis, I wanted to eliminate the PR layer and quantify the number of Vsx1+ cells dividing apically and non-apically.
Other factors within the tissue could also influence the emergence of non-apical divisions. By eliminating the AC and HC layer, as well the RGC layer with specific MOs, the zebrafish retina maintains its main organization. This is achieved by increasing the number of other retinal cell types, which fill in those missing layers. Thus, it appears that the loss of cells is compensated in order to maintain the same number of neurons in the Fig. I-10 – Non-apical divisions arise in the retina when the PR layer is being established – Around 60 hpf, only the most nasal area of the retina expresses intensively the PR cell marker Crx. At the centre of the retina, the PR cell layer is not discernible yet. Here, cells that do not express Crx divide apically (white arrows). However, as we move towards the nasal patch these cells start to divide at non-apical positions, beneath the differentiating PRs (red arrows). Here only PR precursors, marked by the expression of Crx, divide apically (white arrow heads)
INTRODUCTION
retina. Therefore I wanted to understand where are these surplus number of cells formed and concomitantly, if there is a change in the number of non-apical progenitors upon disruption of the cellular structure.
I.4.B - Understanding cell cycle kinetics of non-apical progenitors
It is known that RPCs undergo IKNM and their nuclei migrate actively to the apical side exclusively during G2-phase5. However, non-apical progenitor’s nuclei do not migrate to
the apical surface. Therefore, I wanted to investigate if cell cycle kinetics in non-apical progenitors and compare them to apically dividing ones.
To study cell cycle kinetics I used fluorescently tagged PCNA (proliferating cell nuclear antigen). PCNA is a DNA processivity factor for DNA polymerase, essential for DNA replication, but with no known enzymatic activity41,42. Expression of a GFP-tagged PCNA
can be used to differentiate between cell cycle phases in living cells43. Each cell cycle
phase has a characteristic PCNA distribution pattern: even nuclear distribution during G1 and G2-phase; small and big dots covering the nucleus during early and late S-phase, respectively and finally, a diffuse cellular distribution during M-phase [Fig. I-11]. Previous studies have already shown that PCNA-GFP is a reliable tool to study cell cycle during time-lapse imaging in the zebrafish retina5.
Fig. I-11 - PCNA-GFP distribution pattern differentiates cell cycle phases – zebrafish retinal nuclei expressing PCNA-GFP show different distribution patterns of GFP, allowing the distinction of each cell cycle phase. Adapted from Leung et al 2011
II. Material and Methods
A detailed composition of the solutions underlined is given in the attachments to this manuscript.
II.1 - Animals
Animal care followed the recommendations of European Convention for the Protection of Vertebrate Animals Used for Experimental and other Scientific Purposes (Council Directive 86/609/EEC). All animal procedures were approved by the local law from the government of Saxony, Germany, for the holding and breeding of experimental vertebrates (Erteilung der Erlaubnis für das Züchten und Halten von
Wirbeltieren zu wissenschaftlichen Zwecken, Az. 74- 9165.40- 9 -2001, 30.01.2001) and
for the scientific sacrifice of vertebrates (AZ: 24- 9168.24/2009- 1).
Adult zebrafish (Danio rerio) were maintained and bred at 26,5ºC. Embryos were raised at 28,5ºC in E3 medium and staged as previously described44 in hours post fertilization
(hpf). When imaging was required embryos were treated with 0.003% PTU (Sigma) from 11hpf on to prevent pigmentation. For live imaging embryos were anaesthetized with 0,04% of MS-222 tricaine.
II.2 - Transgenic lines
Transgenic zebrafish lines expressing red or green fluorescent protein under the control of different promoters were used: Tg(Ptf1a::GFP) and Tg(Ptf1a::dsRed)45,46;;
Tg(Vsx1::GFP)47,48..
II.3 - Generation of transgenic lines
Two transgenic lines were constructed during this project: Tg(sCMV::PCNA-GFP) and a Tg(b-actin::PCNA-GFP). To generate the two lines the Tol2 transposon system was used. This system allows integration of large DNA sequences into the genome 49.
The final plasmids were diluted to a final concentration of 25ng/µl and stored at -20ºC. To allow the integration of the DNA of interest into the zebrafish genome, the DNA constructs were injected together with mRNA encoding the Tol2 transposase (15ng/ µl). Page | 17
MATERIAL AND METHODS
The injection was performed into wild-type embryos at one cell stage. At 36hpf expression of the fluorescent signal was assessed using an Olympus SZX16 stereomicroscope and the F0 generation was bred untill adulthood. After 3 to 4 months the carriers for the transgene were identified by crossing the F0 generation with wild type embryos. F0 carriers were then incrossed to establish the F1 generation.
II.3.A - Construction of the pMiniTol2- sCMV::PCNA-GFP plasmid Gene amplification
A ~2.6-kb long fragment containing the PCNA-GFP or PCNA-RFP gene50 under the
control of a sCMV promoter was isolated from a pCS2+ vector previously constructed
and sequenced in the lab (pCS2+-sCMV::PCNA-GFP) 5. To amplify the sequence of
interest the following primers were used: 5’-TATGACGCGGCCGCTCGACCATAGCCAATTCAATATGG – 3’ (forward, Not1 restriction site underlined) and 5’- TGAATGCAATTGTTGTTGTTAACTTGT-3’ (reverse, Mfe1 restriction site underlined). The amplified PCR product was then digested with restriction enzymes
NotI and MfeI.
A Tol2 plasmid, containing the miniTol2 sequences (the minimal DNA sequence required for Tol2 transposition) and an ampicillin resistance gene was linearized using
NotI and EcoRI (which produces compatible ends with MfeI) restriction enzymes.
Ligation and transformation
The digested pMiniTol2 backbone and the PCR product were ligated through enzymatic reaction using a T4 DNA ligase. The product was then amplified in DH5α competent E.
coli, transformed by heat-shock at 42ºC for 45sec and plated in selective medium with
ampicillin (1µl/ml).
Plasmid extraction
To identify bacterial clones carrying the correct plasmid, a colony-PCR was performed in 96 bacterial clones. The following primers were used: 5’-AATTGAATTGCGCTGATGC-3’ (forward) and 5’- GTCGAGCAGAGGTGTAAAAAGT-3’ (reverse). The size of the PCR product was assessed by gel electrophoresis. Positive clones carrying the correct sequence produced PCR products of 3,5 kb. 5 positive clones were cultured overnight Page | 18
MATERIAL AND METHODS
(O.N) in LB medium with ampicillin (1µl/ml). The plasmid DNA was then extracted using a QIAprep Spin Miniprep Kit [Quiagen] and sequenced.
II.3.B - Construction of the pMiniTol2- b-actin::PCNA-GFP plasmid
The MultiSite Gateway Pro recombination kit [Invitrogen] was used to construct the b-actin::PCNA-FP plasmid.
Gene amplification and purification
The PCNA-GFP gene was isolated from the pCS2+-sCMV::PCNA-GFP plasmid. To amplify
the sequence of interest the following primers were used 5’-GGGGACAAGTTTGTACAAAAAAGCAGGCTGGGGATCCCCGAAGAAGAAGC-3’ (forward) and 5’-GGGGACCACTTTGTACAAGAAAGCTGGGTCCTAAGATCCTTCTTCATCCT-3’.
A gel electrophoresis was performed and the correct DNA band was purified from the gel with a QIAXE II Gel Extraction Kit [Invitrogen].
BP reaction, entry clone amplification and purification
The isolate gene was cloned into an entry clone (pDONR221[P1-P2]) with an ampicillin resistance gene, through a recombination reaction mediated by the enzyme BP clonase. The resulting entry clone, was amplified in DH5α competent E. coli, transformed by heat-shock at 42ºC for 45sec and plated in selective medium with ampicillin (1µL/mL). The positive clones were screened trough a colony PCR using the primers 5’- TGTAAAACGACGGCCAGT-3’ (forward) and 5’- GGAAACAGCTATGACCATG-3’ (reverse). Positive clones carrying the correct sequence produced PCR products of 1850 bp. Positive clones were cultured O.N in LB medium with ampicillin (1µL/mL). The plasmid DNA was then extracted using a QIAprep Spin Miniprep Kit [Quiagen].
LR reaction and final plasmid amplification and purification
To construct the final plasmid miniTOL2-bactin::PCNA-GFP, a final recombination reaction was performed between the entry clone (pME-PCNA-GFP), a middle entry clone with the b-actin promoter (p5ENTR[L4-R1]) and a destination vector with the miniTol2
MATERIAL AND METHODS
transposition sites (pDEST[R4-R2]). The reaction was catalysed by the enzyme LR clonase.
The final plasmid obtained was then amplified in DH5α competent E. coli, transformed by heat-shock at 42ºC for 45sec and plated in selective medium with ampicillin (1µL/mL) O.N. . Again a colony PCR was performed to screen for positive clones, using
the primers CGCAAAGCGGCTCAAACC-3’ (forward) and
5’-TACGATCCCGGGCTAAGATCCTTCTTCATCCTC-3’ (reverse). The clones in which the correct plasmid was inserted produce PCR products with 1800bp. Positive clones were cultured O.N in LB medium with ampicillin (1µl/ml). The plasmid DNA was then extracted using a QIAprep Spin Miniprep Kit [Quiagen].
II.4 - PCNA-GFP mRNA Microinjections
PCNA-GFP mRNA was obtained from the pCS2+-PCNA-GFP plasmid, containing the SP6
promoter and linearized with Not1. The capped mRNA was synthetized with the mMESSAGE mMACHINE Kit (Ambion) and purified with phenol, using Phase Lock Gel (PLG) tubes (5 PRIME GmbH). The mRNA was then injected into the yolk of 16 to 64 cell stage embryos.
II.5 - Morpholino Injections
In total, three morpholino oligonucleotides (MO) were used during this project. All were obtained from GeneTools, reconstituted as 1 mM (or 2mM for Ptf1aMO) stock solution in water and injected into either the yolk or the cell of 1-cell stage embryos. Non-injected transgenic embryos were used as a control.
Two antisense Ptf1a translation-blocking MO, previously described were used46: Ptf1aMO1 was targeted against the initiation codon with the sequence
5’-CAACACAGTGTCCATTTTTTGTGC-3’(antisense start codon underlined); Ptf1aMO2 was targeted against a region 44 bp upstream from the ATG site with the sequence 5’-TTGCCCAGTAACAACAATCGCCTAC-3’. For an effective eye phenotype 12ng of each
Ptf1aMO were injected at the same time, together with 4ng of p53MO (
5′-GCGCCATTGCTTTGCAAGAATTG-3′) to supress cell apoptosis. The MO were injected into
double transgenic embryos Tg(Vsx1:GFP/Ptf1a::dsRed)
MATERIAL AND METHODS
For knock-down of the Ath5 promoter, the following antisense translational MO (5’-TTCATGGCTCTTCAAAAAAGTCTCC–3’, antisense start codon underlined), was injected into Tg(Ptf1a::GFP) embryos51.
An Nrf MO was designed by GeneTools, considering the available sequence (ENSDARG00000000018). The antisense translational MO was targeted against a region 10 bp upstream of the translational start site with the sequence 5’-AGTTTCACTCAAACACACTCAGAGC-3’. An effective eye phenotype was obtained by injecting 12ng of this MO into Tg(Ptf1a::GFP) embryos.
II.6 - Immunocytochemistry
All the antibody stainings were perform in whole-mount embryos. Embryos were fixed in 4% PFA (Paraformaldehyde) in 0.1M PBS O.N at 4°C. After fixation embryos were permeabilized with a Trypsin-EDTA solution for 15 min (for 48hpf embryos) to 17 min (for 72hpf embryos). Blocking was performed for two hours at room temperature in blocking solution. The primary antibody - rabbit anti phospho-histone 3 (pH3) (Milipore) was diluted in blocking solution (1:500) and incubated for 3 to 4 days at 4ºC. The secondary antibody - goat anti-rabbit Alexa 647 (Invitrogen) (1:2000 in BS) - was incubated for 2 days ate 4ºC. Nuclei were counterstained with DAPI (4’, 6-diamidino-2-phenylindole) at a concentration of 1:10000.
II.7 - Imaging
Live or stained embryos were mounted in 1% low melting point agarose (Sigma) in E3 medium on a 30 mm glass bottom dish (Mattek), with the eye facing the coverslip. 30µl of 0,04% of MS-222 tricaine and 50µl of 0,01M HEPES buffer were added to the agarose when living embryos were used.
Confocal images were obtained using a Zeiss LSM 510 or a Zeiss LSM 700 confocal microscope and a Zeiss C-Apochromat 63x NA 1.2 water immersion objective.
For time-lapse movies, the central part of the embryonic retina was imaged using an Andor Spinning Disk (with an Olympus UPlanSApo 60x NA 1.2 water objective) or a Zeiss Spinning Disk (with a Zeiss C-Apochromat 63x NA 1.2 water objective). Optical sections of 1µm were imaged within a volume of the retina up to 25µm in depth. Images Page | 21
MATERIAL AND METHODS
were acquired every 5 minutes over a period of 12 to 16 hours. The 4D data obtained was processed and analysed using FIJI/ImageJ.
II.8 - Quantification of mitotic cells
Wildtype and morphant embryos were fixed every four hours between 48hpf and 72hpf and stained with an antibody against the mitotic cell marker pH352. For imaging, each
half of the central retina was scanned in a confocal system and optical sections with 1µm were obtained.
To quantify the number of cells dividing apically versus non-apically, Z-stacks covering the central 30µm (for embryos between 48-60hpf) or 50µm (for embryos between 64-72hpf) of the embryonic retina were analysed. Cells positively labelled by the pH3 antibody and localized at least 1 nucleus away from the apical surface were considered a non-apical division. Mitotic cells were counted in retinas of three different embryos per stage. The mean and the standard error of the mean were calculated for each stage. The absolute mean numbers for each time point, as well as their percentage relative to the total number of mitotic cells were plotted as graphs. A t-student test was performed within each stage/condition.
To quantify the distance of the nuclei to the apical surface Z-stacks of 15µm (for embryos between 48-60hpf) or 30µm (for embryos between 64-72hpf) of the central retina were analysed. For each half of the retina, the total distance between the apical and basal surface was measured three times in three different z-positions and the mean distance calculated. The distance from the centre of each nucleus to the apical surface was measured. Mitotic cells were analysed in retinas of three different embryos per stage and condition. All measurements of one time point and condition were plotted as a relative value to the mean of the distance between the apical and basal surface. All the distances were measured using the MEASURE tool on FIJI.
III. Results and Discussion
III.1 - Investigating the emergence of non-apical progenitors III.1.A - Emergence of non-apical divisions of bipolar cells
The first non-apical divisions of bipolar cell precursors (marked by the expression of
Vsx1) are seen between 48 and 52hpf. This developmental timepoint coincides with the
development of photoreceptor cells which constitute the most apical layer of the retina. Therefore, migration of the committed precursor nuclei to the apical surface might be restricted. We aimed to understand whether the development of the PR layer influences the emergence of Vsx1+ non-apical progenitors. Therefore we wanted to eliminate the PR layer and analyse the frequency of non-apical progenitors during retinal development.
A previously described mutant zebrafish line affecting the Nrf gene shows an extensive loss of photoreceptors and their precursors, due to apoptosis during differentiation53. To
mimic this mutant phenotype a translational morpholino (MO) was designed to knock down (KD) the expression of the Nrf gene.
The MO was injected into transgenic Ptf1a::GFP embryos and non-injected embryos were used as a control. Since there is still no known marker that labels specifically PRs at early stages of their differentiation, the effects of the MO were assessed from 60hpf on, since at this stage PRs can be distinguished based on nuclei morphology and position.
We found that injection of 12ng of the Nrf MO did not eliminate the complete PR cell layer. Nevertheless, we observed nuclei in that layer that do not show the normal elongated shape but look more roundish [Fig. III-1]. In addition, nuclei were further apart from each other than in the control conditions. [Fig. III-1(B)]. The HC and AC layers were developing normally, as seen by the expression of Ptf1a, which labels interneurons (HCs and ACs) [Fig. III-1 (B)].
RESULTS AND DISCUSSION
As already mentioned, the first non-apical divisions of Vsx1+ cells are seen between 48 and 52hpf. Thus, we wanted to analyze the effect of the elimination of the PR layer on non-apical precursors from 48hpf on. However, upon analysis of the morphant embryos a great variability in the phenotype was observed and only few of the injected embryos (10%, n=30 embryos) showed the severe phenotype described above. To overcome this issue, we would need to assess Nrf protein expression for each of the injected embryos. This could be achieved by immuno-labelling; however there are no antibodies described for zebrafish Nrf protein. The low number of affected embryos by the MO might be due Fig. III-1 - Control and Nrf morphant retinas – A) control retina and B) Nrf morphant retina. At 60 hpf,
the nuclei at the OPL present a more rounded shape and are further apart. The HC and AC layers develop normally. ONL – outer nuclear layer; INL – inner nuclear layer; GCL – ganglion cell layer
RESULTS AND DISCUSSION
to a low efficiency in inhibiting the translation of the gene. To increase this efficiency a splicing MO could also be designed and be used as a complement of the translational MO. Due to our difficulties in eliminating the PR layer, other strategies could be considered. Several other genes, crucial for PR development, have already been identified. For example NRL54, Rx55 or NeuroD56, are known down-stream targets of the transcription
factor Crx, which is upregulated in PRs from 60hpf on. However in zebrafish, those genes also play a role in early development of the retina. Therefore, the complete KD could lead to severe retinal developmental defects. A strategy to eliminate the PR layer might be the induction of PR cell death. This can be achieved by a nitroreductase-mediated cell/tissue ablation approach57. This method allows spatial and temporal specific cell
ablation. Inducing the expression of this enzyme in PRs and promoting their cell death at specific time points, might be a valid strategy to eliminate the PR layer, without affecting the surrounding cells.
If we succeeded in eliminating the PR layer, without affecting the development of other neurons, we would be able to understand if the establishment of this layer influences the emergence of Vsx1+ non-apical progenitors. Specifically we aim to understand if these cells divide at this location due to the fact that they cannot reach the apical surface. If that is the case, we would expect that upon elimination of the PR layer, the number of
Vsx1+ non-apical progenitors would be reduced. The outcome of these experiments will
be crucial to understand if the emergence of Vsx1+ non-apical progenitors is a cell intrinsic program or if it is being induced by extracellular factors like tissue constraints.
RESULTS AND DISCUSSION
III.1.B - Basal divisions can be induced upon elimination of the RGC layer
Besides the unattainability of the apical surface, we tried to understand if other factors within the tissue could trigger non-apical divisions. As it was already shown, upon KD of Ath5, RGCs are not produced and the GCL is partially replaced by misplaced ACs28,35,51.
We wanted to know if these changes on retinal structure and on cell numbers could influence the emergence of non-apical progenitors.
Injection of Ath5 MO into Tg (Ptf1a::GFP), enabled us to reproduced the results already described. In control embryos, Ptf1a+ cells are seen mostly in the INL [Fig. III-2 (A)], whereas in the Ath5 morphants the population of Ptf1a+ cells expands towards the GCL [Fig. III-2(B)].
To analyse the effect of the morpholino on non-apical progenitors, control and morphant embryos were fixed every 4h from 48hpf to 72hpf. During this time, all retinal layers are created, giving us a broad overview on neurogenesis. Upon immunostaining of these embryos with the mitotic marker pH3 (phospho-histone 3), mitotic figures in control embryos are found at the apical surface and within the INL [Fig. III-2 (A)]. Surprisingly, when analysing the morphant embryos, we found that mitotic figures could be found across the whole retina, spanning from the apical to the basal surface. Particularly from 64hpf on, these mitotic figures were found beneath the IPL [Fig. III-2 (E-F, white arrows)]. In addition, some of these cells express Ptf1a [Fig. III-2 (G, red arrows)]. Although in control embryos, divisions of Ptf1a+ cells can be found at various positions between the apical surface and the IPL, divisions below the IPL, at the GCL were never observed.
Fig. III-2 – Ath5 morphant embryos show ectopic mitosis beneath the IPL (next page) – A-C) control
retinas D-F) Ath5 morphant retinas. Upon injection of Ath5 MO, RGCs are not produced and the GCL is occupied by misplaced amacrine cells. pH3 positive cells can be found beneath the IPL at 64 and 68hpf. G) In Ath5 morphant embryos Ptf1a+ cells undergo division beneath the IPL (red arrows). Detail of E). ONL – outer nuclear layer; INL – inner nuclear layer; GCL – ganglion cell layer. Maximum projection (5 µm) of 1µm confocal sections. Scale bar - 20µm
RESULTS AND DISCUSSION
RESULTS AND DISCUSSION
To obtain a better understanding of the effects of Ath5 KD over time, we quantified the number and position of all mitotic nuclei within the developing retina of these embryos. The distance from the centre of each pH3+ nucleus to the apical surface was measured in 3 different retinas and plotted as a relative position between the apical and basal surfaces (0% corresponds to the apical surface whereas 100% corresponds to the basal surface) (see Material and methods).
These quantifications are in agreement to what has been described for control embryos. In the first stages analysed, pH3+ nuclei are seen mainly in the upper 10% relative to the apical surface [red dots Fig. III-3]. These divisions correspond to APs. From 56hpf on, pH3+ nuclei are seen at more distant positions from the apical surface, corresponding to the emergent pools of Vsx1 and Ptf1a non-apical progenitors. From 60hpf onwards, two populations of dividing cells can be distinguished. One divides near the apical surface, with a relative distance of approximately 0% to 10%; the other divides at non-apical positions, 15% to 50% away from the apical surface. A clear gap is seen between those populations. This gap most likely corresponds to the thickness of the OPL layer, which increases over time when PR cells are differentiating and establishing connections with BCs and HCs. The existence of this gap is in line with our first assumption that the establishment of the PR layer might constraint the access of progenitors to the apical surface in order to divide. Concomitantly, at 68hpf and 72hpf pH3+ nuclei are only seen in a short range interval below the OPL and at the apical surface.
The same analysis in Ath5 morphants revealed many differences from the control situation related to mitotic nuclei positions [blue dots Fig. III-3]. At the first stages analysed (48 to 56hpf) the majority of divisions occur near the apical surface as seen in the control situation. From 56hpf onwards, we see a considerable amount of cells dividing sparsely across the whole developing retina, with some cells dividing very close to the basal surface. These nuclei probably correspond to the non-apical progenitors found in control situations; however, they are seen occupying a very basal position, which was never observed in the wild-type (WT) situation. From 60hpf onwards, again two populations of dividing nuclei are distinguishable. Although the population of cells dividing at apical positions remains similar to the one found in the control embryos, the population of non-apically dividing cells is scattered throughout the tissue, from the OPL to the basal surface. The most substantial differences are seen at 68 and 72hpf where, in Page | 28
RESULTS AND DISCUSSION
the morphant embryos non-apical divisions still span the entire length below the OPL; whereas in the control situation this pool is confined to a small region 15% to 20% away from the apical surface.
Although in control embryos non-apical progenitors are seen to divide in a broad range of the retinal epithelium, these divisions happen only in the upper 50% of the epithelium. Interestingly however, is the fact that in the morphant embryos cellular divisions can occur further away from the apical surface. We now need to investigate what makes cells divide at the GCL, near the basal surface at later time points and the identity of this new pool of non-apical progenitors induced in Ath5 morphants.
Fig. III-3 - Cells divide at more basal positions in Ath5 morphants – the distance of each ph3+ nucleus was measured and its relative position within the tissue plotted (0%-apical / 100%-basal). In Ath5 morphants (blue) pH3+ nuclei are seen very close to the basal lamina, in contrast to the position of the nuclei of mitotic cells in control conditions (red) at more apical positions. n=3 embryos.